
 ?Mathematical formulae have been encoded as MathML and are displayed in this HTML version using MathJax in order to improve their display. Uncheck the box to turn MathJax off. This feature requires Javascript. Click on a formula to zoom.
ABSTRACT
The influential factors of the generation of kitchen solid waste (KSW) are vital to design policies that target effective KSW reductions and achieve sustainable KSW management, but has not been extensively studied. The study aims at the first step of KSW management only, i.e., generation, which is the first KSW analysis survey in Shanghai to comprehensively investigate the characteristics and influential factors of KSW generation (KSWG). The data were collected from August to October 2019, which resulted in a total of 433 usable questionnaires regarding KSWG in Shanghai, China. The average rate of KSWG is 6.038 kg/household/week or 0.265 kg/person/day. The average per-person number of KSWG bags is 0.295. The regression results show that the characteristics of KSWG are related to household size, household income, the habit of ordering takeout, district of residence, and meticulous consumption culture. Some interesting findings are observed in the present study. Firstly, there is a nonlinear relationship between KSWG and household size, which can be explained by “common consumption”. Secondly, there is a nonlinear relationship between KSWG and household income, which can be explained by the Engel coefficient, which also provides supporting evidence for the environmental Kuznets curve (EKC) hypothesis. Finally, the habit of ordering takeout, district of residence, and meticulous consumption culture are all influential factors of KSWG. The results of the study can improve public awareness and knowledge of KSWG, and suggestions on the minimization of KSWG are put forward, thus will serve as a new reference for the sustainable KSW management of other cities, especially cities in developing countries.
Implications: In the practice of sustainable waste management, KSWG is a complex issue that requires a broad analytic approach that considers several factors simultaneously. From a practical perspective, policy decision-makers should pay attention to at least four important actions to reduce KSWG: Firstly, compared with urban areas, rural areas are important areas for reducing KSWG, which should be given sufficient attention. Secondly, compared with low-income households, high-income households are the focus of KSWG reduction and should be considered. Thirdly, meticulous consumption culture plays an important role in promoting the reduction of KSWG, and this culture should be promoted and cultivated in the formulation of actual waste management policies. This is also an important way to reduce KSWG and should be fully considered. Finally, in the pilot process of domestic waste separation in Chinese cities, 3 R (Reduce, Reuse, and Recycle) waste management concept and method in circular economy can be applied to KSW treatment, and adequate financial support is necessary. Through strengthening the management of KSW, the potential value of KSW can be further developed, so as to realize KSWG reduction and resource utilization.
Introduction
Household solid waste (HSW) generation, especially kitchen solid waste (KSW) generation (KSWG), has become one of the intractable problems worldwide (Chu et al. Citation2020). It has also become a reoccurring issue because they are an integral part of every human society (Shekar Citation2009) and a challenge for city authorities in developing countries (Guerrero, Maas, and Hogland Citation2013) over the last decades, both in economic and environmental contexts. From an economic perspective, the quantity and complexity of solid waste are increasing with economic development, urbanization, and improvements in living standards (Grazhdani Citation2016; Li et al. Citation2020), furthermore, the burden imposed on municipal budgets is also increasing, so are the costs associated with its management. From an environmental perspective, waste pollution is causing major environmental problems (Zheng et al. Citation2019). However, the lack of insufficient disposal capacity makes it difficult for the majority of Chinese cities to handle the increasing municipal waste (Sun Citation2016). As kitchen waste has significantly increased in recent years (Hafid et al. Citation2017), information on the characteristics and influential factors of KSWG is crucial for decision-makers to achieve sustainable KSW management. However, there is a scarcity of relevant information (Buenrostro, Bocco, and Bernache Citation2001). HSW is an important part of municipal solid waste (MSW) (Suthar and Singh Citation2015). KSW is the main component of HSW, accounting for approximately 60% of it in China (Lu and Sidortsov Citation2019). As one of the most economically developed cities in China, rapid economic growth has caused a surge in household waste. In 1978, the amount of domestic waste generated in Shanghai was 1.08 million tons (Mt), and it reached 9 Mt in 2017, a nearly 8-fold increase over 40 years (Ma Citation2019). Shanghai takes the lead in the mandatory separation of domestic waste (MSoDW) and has become the first city in China to realize MSoDW. Moreover, as an international megalopolis, Shanghai has a meticulous consumption culture. The culture is an open self-contained unique regional Shanghai-style culture that has both the classics and elegance of Jiangnan culture and the modernity and fashion of an international metropolis. From the perspective of the field of diet, it is a culture with a refined and economical consumption concept. China is also vigorously promoting a culture of conservation to reduce household food waste (HFW). However, the existing literature pays little attention to the meticulous consumption culture of Shanghai.
We take Shanghai as an example to provide a more comprehensive and extended model of KSW avoidance by Shanghai residents with the following main objectives: Firstly, provide a descriptive analysis of the characteristics of KSWG in Shanghai, China. Secondly, comprehensively analyze the influential factors of KSWG in Shanghai, China. Thirdly, compare the influential factors to the other city or countries. Finally, provide suggestions on minimization of KSWG. The remainder of the study is structured as follows: Section 2 presents a literature review; Section 3 presents the methodology; Section 4 presents the research area and data collection; Section 5 presents the characteristics of KSWG; Section 6 is the results; and Section 7 presents the discussion and conclusions, Section 8 presents the suggestions on minimization of KSWG and recommendations for future work.
Literature review
Here we review the relevant literature over the last several decades, which involves KSW utilization technologies, factors affect HFW and MSW generation, and available models for waste management research. Firstly, KSW utilization technologies. There have been a few studies on how to produce high-value-added products from kitchen waste for beneficial use, include bioethanol, biodiesel, and bio-oil (Karmee Citation2016), as well as highly efficient catalytic systems for the utilization of kitchen waste (Tian et al. Citation2020). Jayalakshmi, Joseph, and Sukumaran (Citation2009) studied the kitchen waste and household waste power generation cooperative treatment technology. Adebule, Aderiye, and Adebayo (Citation2018) researched the issue of how to improve bioelectricity generation with mediators using kitchen waste as a substrate. Studies have also found that organic KSW can be reduced if an anaerobic digester is installed in houses (Minale and Worku Citation2013). Secondly, factors affect HFW generation. Previous studies have identified factors that affect the amount of HFW. More than a third of the food that is grown for human consumption is wasted (Garcia-Garcia et al. Citation2016). Some studies have helped better understand the factors that affect HFW, such as seasonal variations and daily variations (Thanh, Matsui, and Fujiwara Citation2010) as well as perspectives on the potential to reduce food waste (FW) and the influence of purchasing particular food packet sizes (Koivupuro et al. Citation2012). Williams et al. (Citation2012) also identified packet sizes as an important factor that affects HFW. Moreover, food shopping, preparation habits, life stages, and lifestyles (Parizeau, von Massow, and Martin Citation2015) as well as health concerns, having children at home, etc. (Visschers, Wickli, and Siegrist Citation2016) have been shown to be factors affecting HFW generation. Thirdly, factors affect MSW generation. It should be noted that survey analyses or regression approaches based on questionnaires have been used to analyze MSW generated by households with socioeconomic parameters, such as income and household size, as seen in prior literature (Umeh, Nkwocha, and Iheukwumere Citation2019). With the increasing frequency of grocery shopping, the food consumption of households also increases, which then increases the likelihood that household members will later throw away unused excess food (Porpino, Parente, and Wansink Citation2015), thus increasing the amount of waste. Finally, available models for waste management research. In order to improve the level of waste management, more detailed information on waste generation is needed (Parfitt and Flowerdew, Citation1997). However, other than in more centralized infrastructures, waste generation can not be measured directly in detail except in rare cases (e.g. Pay-As-You-Throw systems have been installed) (Beigl, Lebersorger, and Salhofer Citation2008). Hence, models are helpful for analyzing the problem. Most waste management models can be categorized into cost-benefit analysis, life cycle analysis and multicriteria decision analysis (Morrissey and Browne, Citation2004), these waste generation models are lagging behind and are far from reaching general modeling standards (Beigl, Lebersorger, and Salhofer Citation2008). There are also new statistical approaches like artificial neural network (ANN) (Purkayastha, Majumder, and Chakrabarti Citation2018), they are very useful in predicting the future and studying future evolution trends.
In summary, there are some limitations in the existing literature, which constitute the innovation of this article. This research contributes to the overall knowledge of the comprehensive analysis of KSWG, which has been poorly investigated in the existing literature. Firstly, in industrialized countries, households account for the largest share of FW along the supply chain (Dobernig and Schanes Citation2019), and studies including both direct waste analysis and socioeconomic parameters have been conducted in developed countries (Hockett, Lober, and Pilgrim Citation1995). However, such studies are sparse in developing countries (Villalba et al. Citation2020), especially in China, the largest developing country in the world. This is the first KSW analysis survey in Shanghai to comprehensively investigate the characteristics and influential factors of KSWG. Secondly, the vast majority of studies insist that the lower the level of income and the smaller the household size are, the smaller the amount of waste generated. According to the Engel coefficient, as income increases, the proportion of food expenditures decreases, and a family’s consumption may be more diversified, more cooked, more refined, and more economical. Will the KSWG continue to increase with increasing household size and income? Existing research rarely payed attention to the effect. This study considered the nonlinear effect of household size and income on KSWG, which is a complement to the existing linear relationship analysis.
Thirdly, according to the European Parliament (Citation2008), bio-waste is the food and kitchen waste from households, restaurants, caterers, and retail premises, and comparable waste from food processing plants. The focus in this area is limited to FW exclusively. Furthermore, Parfitt, Barthel, and Macnaughton (Citation2010) distinguish the food losses and FW from the perspective of the supply chain and consumption chain. Unlike many works just discussed FW in the very last step of the chain (Schott and Andersson Citation2015), the present work discussed KSW with wider coverage, including both the food supply chain and consumption chain. Besides, the basic steps of waste management are generation → collection → sorting → separation → transfer → transport → disposal (Mckay and Buck Citation2004). Numerous studies have focused on the end steps of waste management, in this study, we focus on the first steps of, ie. generation. Finally, due to the lack of a comprehensive perspective, existing studies have often focused on a single or a few factors affecting waste generation at the household level or city level. Although previous research on FW has consistently grown during the past decade (Dreyer et al. Citation2019), researchers are still calling for further studies (Aschemann-Witzel, Giménez, and Ares Citation2018), especially at the household-consumer level (Parizeau, von Massow, and Martin Citation2015). To date, few studies have focused on diversified household consumption behavior (e.g., shopping and eating out, especially ordering takeout) and its influence on KSWG. KSW generated by residents in urban and rural areas has very rarely been discussed in the waste management literature, more comprehensive analysis is still lacking and needed. This study has considered household size, household income, and their nonlinear influential effects as well as habits of ordering takeout, district of residence, and meticulous consumption culture. It also takes shopping behavior, habits of eating out, and population age structure into consideration, which can contribute to a more comprehensive analysis of the influential factors of KSWG. This study is of vital significance to realize the sustainable management of KSW in Shanghai, and can also serve as a new reference for KSW management of other cities, especially cities in developing countries.
Methodology
As mentioned in the literature review, there are many statistical approaches in waste management research, while in the present study, our aim is to identify the key factors that affect KSWG in Shanghai, China and to identify a causal effect. Therefore, simple correlation analysis, group comparisons, input-output analysis, and time series analysis, ANN, etc. are not the best methods for the present work. Regression analysis, especially the ridge regression analysis method that considering collinearity (Gómez et al. Citation2016) will be more suitable to quantify the specific influence of various factors on KSWG, then provide a reliable basis for suggestions on the minimization of KSWG. The modeling in this study starts out as a model of a linear function, following the previous study by Ojeda-Benítez et al. (Citation2008), it is represented in the following equation:
In EquationEq. (1(1)
(1) ), Yi stands for the dependent variables and refers to the KSWG for household i, it is divided into three subcategories: total KSWG, per-person KSWG, and per-person number of KSWG bags. The dependent variables are taken as logarithms to eliminate heteroscedasticity. Generally, KSW is the solid waste generated in the kitchen, which consists of food losses that taking place in production, post-harvest, and processing stages of the food supply chain and FW that occurs in the retail and final consumption chain (Parfitt, Barthel, and Macnaughton Citation2010). In the present study, KSW consists of cooked kitchen waste (eg. Leftovers such as unused vegetable roots, rotten leaves, etc.) and raw materials and finished products (cooked food) or residues used in the family’s daily diet (eg. vegetable offal, fruit husks, peels, staple food, eggshells, tea dregs, bones, and scallops, etc.). In a broad sense, KSW also includes used chopsticks and food packaging materials. And toilet paper, diapers, cat litter, cigarette butts, desiccant, stained plastic, nylon products, woven bags, etc. are not included in the KSW. Kitchen waste mainly includes vegetable offal, leftovers, and fruit husks (Yang et al. Citation2019). α is the intercept; βk is the slope of independent variables and indicates the average change in the response variable when the random variable increases; Xki is the kth independent variable that affects KSWG for household i, which is the household size and its square, household income and its square, habit of ordering takeout, district of residence, and meticulous consumption culture; γj is the slope of control variables and indicates the average change in the response variable when the random variable increases; Zji is the jth control variable that affects KSWG for household i, which includes shopping behavior, the habit of eating out, and the population age structure; and ε is the average random error. In the next section, all variables, including the dependent variables, independent variables, and control variables, are described in detail. The key factors of consumers’ behavior are reflected in Xki, KSWG is reflected in Yi. The regression coefficient βk represents Xki on Yi in the regression equation. The larger the βk is, the greater the influence of Xki on Yi, the positive βk means that Yi increases as Xki increases, and the negative βk means that Yi decreases as Xki increases.
To find a mathematical model that can reasonably explain the influential factors of KSWG, several main constructs were thoroughly investigated and included in EquationEq. (1)(1)
(1) . The dependent variables include total KSWG, per-person KSWG, and per-person number of KSWG bags. Learn from Parizeau, von Massow, and Martin (Citation2015), the total KSWG is measured by KSW amount per household (kg/week); the per-person KSWG is measured by KSW amount per person (kg/person/day), and the per-person number of KSWG bags is measured by the number of KSWG bags per person. The independent variables include household size and its square, household income and its square, habit of ordering takeout, district of residence, and meticulous consumption culture. For household size, some researchers have found that the waste generation rate is negatively correlated with household size (Jörissen, Priefer, and Bräutigam Citation2015; Thanh, Matsui, and Fujiwara Citation2010; Williams et al. Citation2012) and the positive effect was identified by Koivupuro et al. (Citation2012), while they did not consider the non-linear relationship. In this study, we also take the nonlinear influential effect of household size into consideration. Therefore, the direction of influence is uncertain and needs to be identified. The household size is measured by the actual population in the household. The household size square is the square of the household size. For household income, an increase in income can change the consumption patterns of households, which results in changes in the composition and quantity of household waste (Ogwueleka Citation2013). It includes household income as a key independent variable and checks the environmental Kuznets curve (EKC), an empirical hypothesis that reveals an inverted U-shaped relationship between economic growth and the environment. Household income is measured by per-household income (household total income/household size). The total household income was captured through the following question: “How much is your family’s total income (10,000 yuan) in 2018 (after taxes)?” Responses were reported as follows: < 1 = 1; 1 ~ 2 = 2; 2 ~ 3 = 3; 3 ~ 5 = 4; 5 ~ 10 = 5; 10 ~ 20 = 6; 20 ~ 30 = 7; 30 ~ 50 = 8; and > 50 = 9 (currently, 6.62 yuan = 1 United States dollar). In this study, we also take the nonlinear influential effect of household income into consideration. Some studies believe that there is a positive correlation between the waste generation and household income (Bandara et al. Citation2007; Thanh, Matsui, and Fujiwara Citation2010), while there is also a study believes that no correlation has been found between them (Williams et al. Citation2012). Therefore, the direction of influence is uncertain and needs to be identified. For the habit of ordering takeout, with economic development and urbanization, people’s living standards are increasing, as is the frequency of ordering takeout. In this case, people prepare less food at home, which reduces the amount of waste generated during the process of preparing meals. Therefore, we propose that ordering takeout will negatively affect KSWG, and needs to be identified. Ordering takeout refers to ordering from a restaurant and taking it home for use. The habit of ordering takeout was captured through the following question: “Since July 2019, what was the frequency of ordering takeout in your family each week?” Responses were reported as follows: None = 0; 1 time = 1; 2 ~ 3 times = 2; 4 ~ 5 times = 3; 6 ~ 10 times = 4; 11 ~ 15 times = 5; 16 ~ 20 times = 6; 21 ~ 25 times = 7; and ≥ 25 times = 8. For districts of residence, few studies have examined the difference between rural and urban waste generation. Due to the heterogeneity of urban and rural areas, it is likely to have an impact on waste generation. However, only a few studies have examined the resource recycling potential of urban and rural domestic waste, such as FW, waste plastics, toilet paper, waste glass, used clothes, waste electronics, paper, and metals (Yang, Yang, and Yu Citation2012). The district of residence was recorded using a dummy variable (1 = urban, 0 = rural). As rural households generally have vegetable gardens and engaged in agricultural production, which will potentially increase the KSWG in the process of food preparation, consumption, and leftover disposal. Therefore, we propose that district of residence will negatively affect KSWG and needs to be identified. For meticulous consumption culture, food being thrown away pertains to local food cultures and ideologies of edibility (Wahlen and Winkel Citation2016). Thus, consumption culture is an important factor that may affect KSWG. Shanghainese have a refined, economical consumption concept, special food cultures, and ideologies of edibility, which enables them to consume in a refined and economical manner. This will lead to less KSWG from a theoretical analysis point of view. Therefore, we propose that meticulous consumption culture will negatively affect KSWG and needs to be identified. The consumption culture was captured through the following question: “How many years have you lived in Shanghai?” Responses were reported as follows: < 1 year = 1; 1 ~ 5 years = 2; 6 ~ 10 years = 3; 11 ~ 20 years = 4; 21 ~ 30 years = 5; and ≥ 30 years = 6. The influence of culture on consumption, especially the meticulous consumption culture of Shanghai is rarely paid attention to. Intuitively, the inheritance and influence of culture is a long-term accumulation process. The longer a person lives in a region, the greater the person will be influenced by the culture. Therefore, theoretically speaking, using the length of residence to measure is a more feasible method, under the premise that there is no better method. Besides, the longer a household has lived in Shanghai, the more they are affected by the meticulous consumption culture, then, they may eat in a refined and economical manner, and less KSWG.
During the regression processing, three control variables are considered for the analysis: Shopping behavior, the habit of eating out, and population age structure (ratio of young people in the household and ratio of elderly people in the household). For shopping behavior, shopping is a critical integrated practice in modern societies as a routine means of bringing food into the home (Ganglbauer, Fitzpatrick, and Comber Citation2013), which is used as a control variable in this study. The shopping behavior was captured through the following question: “Since July 2019, what was the frequency of going grocery shopping each week?” Responses were reported as follows: None = 0; 1 time = 1; 2 ~ 3 times = 2; 4 ~ 5 times = 3; 6 ~ 7 times = 4; and ≥ 8 times = 5. For the habit of eating out, eating outside the home has become a common practice that helps people overcome certain mismatches in their working life (Díaz-Méndez and García-Espejo Citation2017). Eating out refers to not eating at home and eating in a restaurant outside the home. Eating out might increase HFW if food is left uneaten in the home, while it can also reduce waste if eating out results in less grocery shopping (Bravi et al. Citation2020). Following McCarthy and Liu (Citation2017), the habit of eating out was captured through the following question: “Since July 2019, what was the frequency of eating out in your family each week?” Responses were reported as follows: None = 0; 1 time = 1; 2 ~ 3 times = 2; 4 ~ 5 times = 3; 6 ~ 10 times = 4; 11 ~ 15 times = 5; 16 ~ 20 times = 6; 21 ~ 25 times = 7; and ≥ 25 times = 8. For the population age structure, because the composition of HSW varies by household according to the family’s age (Ojeda-Benitez, de Vega, and Ramirez-Barreto Citation2003), the control variables also take demographic characteristics into consideration. This study divides people’s ages into three categories: people below 30 years, young people (31 to 59), and elderly people (persons aged 60 years and above). People below 30 years serve as the reference group. The ratio of young people is measured by the proportion of young people in the household; the ratio of elderly people is measured by the proportion of elderly people in the household.
Research area and data collection
Research area
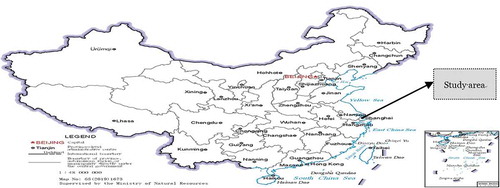
Shanghai is an international megalopolis. According to the Shanghai Statistical Yearbook (Citation2018), it had a permanent population of 24,183,300 at the end of 2017. It is located between latitudes 30°40ʹ to 31°53ʹN and 120°52ʹ to 122°12ʹE. On January 31, 2019, the Second Meeting of the Fifteenth People’s Congress of Shanghai Municipality voted to pass the “Regulations of Shanghai Municipality on the Administration of Domestic Waste Management”, which was officially implemented on July 1. Shanghai is the first city in China to implement a full range of KSW management and is the first city to implement MSoDW. This approach to KSW management is a reflection of Shanghai’s refined city management. Under the regulations, households will undoubtedly contribute to the conservation and recycling of resources as well as the reduction and recycling of waste, and they will consume in a refined and economical manner. According to the official plan, by 2020, 46 key cities will have basically completed the domestic waste separation and treatment system. Other prefecture level cities have achieved full coverage of domestic waste separation by public institutions, and at least one street has basically built a domestic waste separation demonstration area. However, waste separation is a gradual process, and people also have a process of adaptation. At present, most cities can only provide separated collection facilities in the release link. Facilities for separated transportation and disposal are generally insufficient, and the problem of “separation before mixing” has not been clearly solved. Shanghai is the first city that has implemented MSoDW. The comprehensive analysis is generalizable and will serve as a new reference for KSW management of other cities, the significance of policy reference is obvious. Therefore, this study selects Shanghai as the representative study area (). According to the Shanghai Statistical Yearbook (Citation2018), the total amount of waste is divided into domestic waste and construction waste, and since 2012, the removal and transportation of engineering residue have been added to construction waste. The total amount of waste in Shanghai from 2008 to 2017 roughly shows an inverted U-shaped curve of increasing first and then decreasing, while the proportion of domestic waste in waste generation shows a U-shaped curve of decreasing first and then increasing slightly. The amount of domestic waste in Shanghai from 2008 to 2017 shows a linear upward trend.
Figure 1. Map showing the location of the study area of Shanghai in China
Data collection
Accurate data is vital to improve the efficiency of solid waste management services, especially the generation and composition data (Khair, Rachman, and Matsumoto Citation2019). However, reliable data on KSWG and composition is still lack in many cities in China, especially census data are not available at the household level, thus gather information from questionnaires is a feasible methodology. Since we aim to make a holistic consideration, it is difficult and costly, and unnecessary to measure KSWG one by one. In fact, the most detailed and valid waste assessments are rarely done because of their high costs (Parizeau, von Massow, and Martin Citation2015). Therefore, different from the measurement using weighing tools such as electronic scales, respondents evaluated the waste their household generated based on their own experience. Because of time and financial constraints, we assessed the self-reported amount of waste in our questionnaire (Parizeau, von Massow, and Martin Citation2015; WRAP Citation2009). We asked about the weight of KSW generated by the respondent’s family in the past week, in a relatively short period of time, the assessment errors of respondents will not be magnified, and the family population is relatively stable. In addition, we have conducted a certain number of offline questionnaires, all of which help ensure the quality of our data. Besides, the data comprehensively examined two aspects of KSWG per household (kg/week) and KSWG bags. To conduct the survey, some previous studies have used online platforms to assist with their research, such as SurveyMonkey software (Paganini et al. Citation2016; Schwartz et al. Citation2014), which has some advantages, including easier access, avoidance of input and data coding errors, a faster distribution, reduced time and costs, etc. However, this approach also has some limitations, for instance, response rates and the length of the questionnaire. In China, there is also an online platform called SurveyStar, which has been applied in many studies (Wu, Bai, and Fiske Citation2018; Zhao et al. Citation2020). Random online surveys were used, followed by offline face-to-face surveys with the participants who were randomly visited and invited to participate in the survey. The data were mainly collected using the SurveyStar professional online platform, which is designed to conduct questionnaires online across China. The survey was initiated in August 2019 and lasted nearly 4 months. It took about fifteen minutes for 433 participants to complete all anonymous questionnaires. Some related studies have provided procedures to determine the minimum number of samples (Das et al. Citation2019; Gomez et al. Citation2008). Taking into account the cost of collecting the questionnaire, we conducted as many questionnaire scans as possible, and our sample size was 433, which is larger than similar studies in Vietnam of 100 samples (Thanh, Matsui, and Fujiwara Citation2010), Finland of 388 samples (Koivupuro et al. Citation2012), Sweden of 61 samples (Williams et al. Citation2012), and Canada of 61 samples (Parizeau, von Massow, and Martin Citation2015). It is worth noting that, Zhang et al. (Citation2012) used econometric analysis to study the influential factors about the source separation of MSW in Shanghai, China, and the sample size is 432. Many research on KSW in Shanghai, China are case study approaches, such as Lu and Sidortsov (Citation2019), Chu et al. (Citation2020). Besides, modeling procedures should balance information gain and implementation costs (Beigl, Lebersorger, and Salhofer Citation2008). Thus, considering the cost, a final sample size of 433 was used after removing the questionnaires in which the respondents misunderstood the questions. Making comparisons with previous studies is not a good reason to say that the survey has sufficient representation. Of course, a larger sample size is better. This is not to say that 433 is enough, it is just to show that our sample size is acceptable compared with existing studies, especially those in Shanghai, China under the cost allowance. Our samples cover all administrative areas of Shanghai, including 375 online questionnaires and 58 random offline questionnaires, presents the features of respondents. It can be considered that our survey is representative, which allows us to obtain more comprehensive information to analyze the characteristics of KSWG and its influential factors in Shanghai. presents descriptive statistics of the main variables. It shows that there is a minimum nonzero amount of KSWG and KSWG bags generated from households, irrespective of the number of individuals living in a household. The average rate of KSWG is 6.038 kg/household/week or 0.265 kg/person/day. The average per-person number of KSWG bags is 0.295.
Table 1. Features of respondents
Table 2. Descriptive statistics
Characteristics of KSWG
KSWG involves several important links. Firstly, in the process of food preparation, the removal of the inedible parts of vegetables, such as inedible vegetable roots and rotten vegetable leaves, is an important part of KSWG. Secondly, during the food consumption process, the inedible parts of food, such as pig bones and fish bones, and food that is accidentally dropped on the ground are also an important part of KSWG. In addition, for the disposal of leftovers, especially the consumption of numerous meals, if the last few meals are not consumed, they will become part of KSWG, even in the case of extravagance and waste. When a meal is discarded, it will directly become KSW and in fact, constitutes the most important source of KSWG. This part outlines the information derived from our survey relating to the characteristics of KSWG (the mean KSWG per household, the specific KSWG, and the specific number of KSWG bags) for different household sizes. The setting of population size follows the research of Dennison, Dodd, and Whelan (Citation1996a). The average household size of the 433 households in the sample is approximately 4 persons. details the distribution of the household size in the survey. One- and two-person households comprise nearly 6.466% of all households. The household size with the largest proportion in the sample is three-person households, which comprise nearly 48.037% of all households. Households with 5 or fewer people accounted for 77.828% of all households. The average KSWG according to household size is found to vary according to household size in the manner presented in . Based on , one-person households generate, on average, more than two (0.571/0.247) times as much KSW per person as households with four persons. One-person households generate, on average, approximately three (0.714/0.255) times as many KSWG bags per person as those with four persons. By further analyzing the changes in the dependent variables, we can find that the specific number of KSWG bags follows a linear downward trend with increasing household size, while the relationship between the mean KSWG per household and household size follows an inverted U-shaped curve of increasing first and then decreasing.
Table 3. Household size distribution in the sample
Table 4. Average KSWG according to the household size
Results
The influential factors of KSWG
This study further explored the influential factors of KSWG from three dimensions: total KSWG, per-person KSWG, and per-person number of KSWG bags. Variance inflation factors (VIFs) have been widely applied in the scientific literature to diagnose the existence of collinearity, and ridge estimation is a commonly used method to overcome collinearity (Gómez et al. Citation2016). It is generally accepted that severe collinearity exists when the VIF values exceed 10 (Kennedy Citation1992). Firstly, total KSWG. The VIFs of household size, the square of household size, household income, and the square of household income are 65.021, 59.603, 12.463, and 10.973, respectively, while the VIFs of the other variables are all less than 1.800. Thus, this study used ridge estimation to overcome the collinearity problem, and the results are shown in column (1) of . Column (1) of shows that total KSWG has an inverse U-shaped relationship with household size, and the relationship is statistically significant at the 5% significance level. The average household size of Shanghai in our survey is 4.023, which is past the turning point of 3.689 (=−0.450/(2×(−0.061))). Thus, with increasing household size, the total KSWG should decline, so is the per-person KSWG. This can be explained by the notion of “common consumption” (Qu et al. Citation2009). According to “common consumption”, there exists a negative correlation between household size and the expected rate of daily KSWG. In other words, the smaller the household size is, the larger the daily per-person KSWG, which is in agreement with the investigation by Dennison, Dodd, and Whelan (Citation1996b) in Dublin, Ireland. Jörissen, Priefer, and Bräutigam (Citation2015) showed that the FW rate per person is higher for households with one person than for households with two or more persons in both Karlsruhe and Ispra, which is also consistent with the findings of the present study. The findings show that the total KSWG also has an inverse U-shaped relationship with household income, and the relationship is statistically significant at the 5% significance level. This result provides supporting evidence for the EKC hypothesis. The Engel coefficient is the proportion of total food expenditures to total personal consumption expenditures. Generally, the lower a family’s income is, the greater the proportion of their income (or total expenditures) spent on food. With the increasing of family income, the proportion of a family’s income (or total expenditures) spent on food will decrease. The average household income in Shanghai in our survey is 1.644 (approximately 20,000 yuan), which does not cross the turning point of 3.881 (=−0.458/(2×(−0.059))). Thus, with increasing household income, the total KSWG will also increase. This finding is in agreement with the study by Bandara et al. (Citation2007). They found that higher-income households tend to consume more food; thus, the amount of organic waste also increases. They also showed that higher-income households tend to cook at home; thus, the waste generation rate is higher. The habit of ordering takeout has a negative effect on the total KSWG, although this effect is not significant. The district of residence, which represents geographic conditions, is a dummy variable. The variable has a negative correlation with the total KSWG, and the influential coefficient is statistically significant at the 5% significance level, which shows that compared with rural households, less total KSW is generated by urban households. There are several reasons that may explain this phenomenon. On the one hand, urban households tend to buy more cooked food in supermarkets or vegetable markets, and part of KSWG generated in the process of food preparation is disposed of before the food enters the supermarkets or vegetable markets. In contrast, rural households generally have vegetable gardens in their homes, and most of them use raw food. Thus, more organic waste is then often recycled in one’s own gardens (self-composting). In the end, less organic waste is produced for disposal. Families in urban households go out to eat frequently, thus, there are fewer opportunities for urban households to generate KSW than rural households. On the other hand, rural households engaged in physical work expend a large amount of physical energy, and these families need to consume more food to supplement their energy, which potentially increases the total KSWG in the process of food preparation, consumption, and leftover disposal. Therefore, more KSWG will be generated in the process of food preparation. There is a negative relationship between the meticulous consumption culture and the total KSWG, and the influential coefficient is statistically significant at the 10% significance level. This finding can be explained by the refined and economical consumption culture of Shanghai, China. Urban households in Shanghai have special food cultures and ideologies of edibility in that they consume in a refined and economical manner; in other words, the amount of food that they buy is relatively small, but the nutrition is sufficient. This small and refined food consumption culture reduces the amount of KSWG at all stages of the KSWG process. Secondly, per-person KSWG. Because the VIFs were all less than 10, severe collinearity did not exist. Thus, the ordinary least squares (OLS) regression method was used. The regression results are shown in column (2) of . These results show that the per-person KSWG has an inverse U-shaped relationship with household income which is consistent with the EKC hypothesis. The average household income of Shanghai in our survey is 1.644 (approximately 20,000 yuan), which does not cross the turning point of 4.723 (=−1.039/(2×(−0.110))). On the left side of the turning point, the per-person KSWG increases with the increase of household income, and on the right side of the turning point, the per-person KSWG decreases with the increase of household income. Thus, with increasing household income, the per-person KSWG will also increase. This is because higher-income households tend to consume more food and cook at home. The habit of ordering takeout has a negative effect on the per-person KSWG. According to the CITY FOOD DELIVERY INDEX (CFDI 2018), there are 93,301 and 79,469 takeout shops on Eleme and Meituan in Shanghai, respectively, more than that in Beijing, Changsha, Changzhou, Chengdu, Chongqing, Dalian, Dongguan, Foshan, Fuzhou, Guangzhou, Hangzhou, Hefei, Nanchang, Nanjing, Ningbo, Qingdao, Shanghai, Shenyang, Shenzhen, Suzhou, and Tianjin. As the frequency of ordering takeout increases, less FW is generated at home; thus, the per-person KSWG decreases. The results show that the district of residence has a negative correlation with the per-person KSWG, although the influential coefficient is not statistically significant at the 10% significance level. There is a negative relationship between the meticulous consumption culture and the per-person KSWG, and the influential coefficient is statistically significant at the 5% significance level. This finding can be explained by the refined and economical consumption culture of Shanghai, China. Thirdly, the per-person number of KSWG bags. In addition to the amount of waste, this study also considered the number of KSWG bags. The advantage of this approach is that one can clearly see the separation level of a household. A household with more waste bags and less waste weight indicates more detailed separation practices. As severe collinearity did not exist, the ordinary OLS regression method was used. The regression results are shown in column (3) of . The per-person number of KSWG bags has an inverse U-shaped relationship with household income. This result also provides supporting evidence for the EKC hypothesis. The average household income of Shanghai in our survey is 1.644 (approximately 20,000 yuan) and does not cross the turning point of 5.699 (=−0.889/(2×(−0.078))), which means that with increasing household income, the per-person number of the KSWG bags increases. This is because higher-income households tend to consume more food and cook at home, thus requiring more bags to contain household waste. The habit of ordering takeout has a significant negative effect on the per-person number of KSWG bags. As the frequency of ordering takeout increases, less KSW is generated at home; thus, the per-person number of KSWG bags decreases. The results show that the district of residence has a positive correlation with the per-person number of the KSWG bags, although the influential coefficient is not statistically significant at the 10% significance level. There is a positive relationship between the meticulous consumption culture and the per-person number of KSWG bags. This can be explained by the fact that Shanghai residents separate their waste effectively. If the frequency of separation was used as the dependent variable in the model. There is a positive relationship between meticulous consumption culture and the frequency of separation. Although the number of KSWG bags increases, the amount of KSWG decreases, which implies that urban households have more detailed waste separation practices.
Table 5. Regression results of the influential factors of KSWG
A simple comparative study on the influential factors of KSWG in other cities and countries
Finally, we conduct a simple comparative study on the influential factors of other cities and countries (), which helps obtain a more comprehensive understanding of the influential factors of KSWG in Shanghai, China. Compared to Can Tho City, Vietnam, which is also a city in a developing county, the average waste generation is 285.28 g/person/day, which is larger than the 265 g/person/day of Shanghai, China. In developed countries, the waste generation exhibits larger differences, such as 63 g/person/day in Finland (Koivupuro et al. Citation2012), while the number in Canada is 1 457 g/person/day (Parizeau, von Massow, and Martin Citation2015). Regarding the influential factors are concerned, the waste generation rate has been shown to be negatively correlated with household size (Thanh, Matsui, and Fujiwara Citation2010; Williams et al. Citation2012), which is highly consistent with our results, although a positive effect was identified by Koivupuro et al. (Citation2012). It should be noted that this paper explores the nonlinear effects of household size on waste generation, which may provide a more scientific explanation of the impact of household size because the different effects of household size are identified. However, the conclusions are not uniform. According to rank correlation analysis, household income has been shown to have a positive effect on waste generation (Thanh, Matsui, and Fujiwara Citation2010), although it is a weak relationship. No correlation has been found between household income and FW (Williams et al. Citation2012). Our results show that waste generation has an inverse U-shaped relationship with household income, and the relationship is statistically significant at the 5% significance level. Moreover, in our study, we also consider the influence of the habit of ordering takeout, district of residence, meticulous consumption culture, shopping behavior, the habit of eating out, the ratio of young people, and the ratio of elderly people, which can more comprehensively explain the influential factors of KSWG.
Table 6. The influential factors compared to other cities and countries
Discussion
Compared with Can Tho City, Vietnam, which is also located in a developing country (Thanh, Matsui, and Fujiwara Citation2010), the average generation rate of KSW in Shanghai, China is very similar to it. The average household size of Shanghai in our survey is 4.023, which has crossed the turning point of 3.689. Therefore, at present, household size has a negative effect on KSWG, which is consistent with the conclusions of Thanh, Matsui, and Fujiwara (Citation2010) and Williams et al. (Citation2012), while this is not consistent with the work of Koivupuro et al. (Citation2012). Our results can be explained by the notion of “common consumption” (Qu et al. Citation2009). According to “common consumption”, the smaller a household is, the larger the daily per-person waste generation, which is in agreement with the investigation of Dennison, Dodd, and Whelan (Citation1996b) in Dublin, Ireland, and the work of Jörissen, Priefer, and Bräutigam (Citation2015). This shows that in the practice of sustainable waste management, per-household waste generation and per-person are equally important. The average household income in Shanghai in our survey has not crossed the turning point, which indicates a positive relationship between household income and the waste generation. This result is in agreement with the findings of Dennison, Dodd, and Whelan (Citation1996a) and Bandara et al. (Citation2007), who found that higher-income households tend to consume more food, increasing the amount of organic waste. In another study, household income was found to have a weakly positive effect on waste generation (Thanh, Matsui, and Fujiwara Citation2010) according to a rank correlation analysis. Moreover, no correlation was found between household income and FW in Williams et al. (Citation2012).
Conclusion
This study collected a total of 433 usable questionnaires on the KSWG in Shanghai, China. The average rate of KSWG is 6.038 kg/household/week or 0.265 kg/person/day. The average per-person number of KSWG bags is 0.295. The average household size is approximately 4 persons, and three-person households represent the largest proportion of households based on size, comprising 48.037% of all households. The specific number of KSWG bags shows a linear downward trend with increasing household size. The relationship between the mean KSWG per household and household size shows an inverted U-shaped curve. The regression results show that the characteristics of KSWG are related to several socioeconomic factors. Firstly, there is a nonlinear relationship between KSWG and household size, which can be explained by “common consumption”; secondly, there is a nonlinear relationship between KSWG and household income, which can be explained by the Engel coefficient, which also provides supporting evidence for the EKC hypothesis; and thirdly, the habit of ordering takeout, district of residence, and meticulous consumption culture are all influential factors of KSWG. The habit of ordering takeout has a negative effect on KSWG, and its effect is significant when measured by the per-person KSWG and KSWG bags. The district of residence has a significant and negative correlation with the total KSWG, which shows that compared with rural households, the total amount of KSW generated by urban households is lower. There is a significant and negative relationship between meticulous consumption culture and total KSWG, which can be explained by the refined and economical consumption culture of Shanghai, China. Besides, meticulous consumption culture has a significant and negative correlation with the per-person KSWG and a significant and positive correlation with the number of KSWG bags, the latter of which can be explained by the detailed waste separation practices in Shanghai, China.
Suggestions on minimization of KSWG and recommendations for future work
Suggestions on minimization of KSWG
In the practice of sustainable waste management, the research reveals that per-household waste generation and per-person are equally important. KSWG is a complex issue that requires a broad analytic approach that considers several factors simultaneously. From a practical perspective, policy decision-makers should pay attention to at least four important actions to reduce KSWG: Firstly, compared with urban areas, rural areas are important areas for reducing KSWG, which should be given sufficient attention. Secondly, compared with low-income households, high-income households are the focus of KSWG reduction and should be considered. Since the current income level in Shanghai has not crossed the inverted U-shaped turning point, as people’s income increases, the waste amount will also increase. Once the inflection point is crossed, it will help reduce the waste amount. As a family’s consumption may become more diversified, more refined, and more economical if the household income is higher, this will helps to reduce KSWG. Thirdly, meticulous consumption culture plays an important role in promoting the reduction of KSWG, and this culture should be promoted and cultivated in the formulation of actual waste management policies. This is also an important way to reduce KSWG and should be fully considered. Finally, in the pilot process of domestic waste separation in Chinese cities, 3 R (Reduce, Reuse, and Recycle) waste management concept and method in circular economy can be applied to KSW treatment, and adequate financial support is necessary (Zamroni et al. Citation2020). Through strengthening the management of KSW, the potential value of KSW can be further developed, so as to realize KSWG reduction and resource utilization.
Recommendations for future work
Although some interesting findings were observed in the present research, due to the particularity of the research, there is no good way to test the validity of the sample, which is a limitation of this article. There are still many studies that can be conducted in the future, especially given the limitations of this study. Because Shanghai was the first city in China to implement MSoDW, this study takes Shanghai as an example to analyze the characteristics and influential factors of KSWG. The domestic waste practices in other cities are similar to those in Shanghai. Therefore, for future research, the behavior of KSWG and its influential factors in different cities could be compared. In addition, we consider the effect of the habit of ordering takeout and the habit of eating out. These behaviors will also affect the waste generation of restaurants, future research should aim to the effect of KSWG on restaurant waste generation. Besides, the impact of KSWG on environmental quality is also an issue that can be followed up.
Abbreviations
| HSW | = | Household Solid Waste |
| KSW | = | Kitchen Solid Waste |
| KSWG | = | Kitchen Solid Waste Genration |
| MSW | = | Municipal Solid Waste |
| MSoDW | = | Mandatory Separation of Domestic Waste |
| Mt | = | Million tons |
| HFW | = | Household Food Waste |
| FW | = | Food Waste |
| EKC | = | Environmental Kuznets Curve |
| ANN | = | Artificial Neural Network |
| VIFs | = | Variance Inflation Factors |
| OLS | = | Ordinary Least Squares |
| CFDI | = | CITY FOOD DELIVERY INDEX |
| 3R | = | Reduce, Reuse, and Recycle |
Disclosure statement
The authors declare no conflicts of interest.
Additional information
Funding
Notes on contributors
Keqiang Wang
Keqiang Wang, Ph.D., supervisor, Professor of Shanghai University of Finance and Economics. Wang does research in theory and policy of sustainable development.
Jianglin Lu
Jianglin Lu, Ph.D. candidate, Shanghai University of Finance and Economics. Lu does research in theory and policy of sustainable development.
Hongmei Liu
Hongmei Liu, Ph.D., Professor of Shanghai Normal University. Liu does research in theory and policy of resource and environmental economy.
References
- Adebule, A. P., B. I. Aderiye, and A. A. Adebayo. 2018. Improving bioelectricity generation of microbial fuel cell (MFC) with mediators using kitchen waste as substrate. Ann. Appl. Microbiol. Biotechnol. J. 2 (1):1008. doi:10.36876/aamb.1008.
- Aschemann-Witzel, J., A. Giménez, and G. Ares. 2018. Convenience or price orientation? Consumer characteristics influencing food waste behaviour in the context of an emerging country and the impact on future sustainability of the global food sector. Glob. Environ. Chang. Part A 49:85–94. doi:10.1016/j.gloenvcha.2018.02.002.
- Bandara, N. J. G. J., J. P. A. Hettiaratchi, S. C. Wirasinghe, and S. Pilapiiya. 2007. Relation of waste generation and composition to socio-economic factors: A case study. Environ. Monit. Assess. 135:31–39. doi:10.1007/s10661-007-9705-3.
- Beigl, P., S. Lebersorger, and S. Salhofer. 2008. Modelling municipal solid waste generation: A review. Waste Manage. 28 (1):200–14. doi:10.1016/j.wasman.2006.12.011.
- Bravi, L., B. Francioni, F. Murmura, and E. Savelli. 2020. Factors affecting household food waste among young consumers and actions to prevent it. A comparison among UK, Spain and Italy. Resour. Conserv. Recycl. 153:104586. doi:10.1016/j.resconrec.2019.104586.
- Buenrostro, O., G. Bocco, and G. Bernache. 2001. Urban solid waste generation and disposal in Mexico: A case study. Waste Manage. Res. 19:169–76. doi:10.1177/0734242X0101900208.
- CFDI. 2018. China city has the largest data report of ordering takeout. Accessed May 27, 2020. http://www.doc88.com/p-9445011093667.html.
- Chu, Z., A. Zhou, Z. He, W. Huang, and Z. Lv. 2020. The potential value of recycling municipal household solid waste in Shanghai, China. J. Air Waste Manag. Assoc. doi:10.1080/10962247.2019.1705435.
- Das, S., S.-H. Lee, P. Kumar, K.-H. Kim, S. S. Lee, and S. S. Bhattacharya. 2019. Solid waste management: Scope and the challenge of sustainability. J. Clean. Prod. 228:658–78. doi:10.1016/j.jclepro.2019.04.323.
- Dennison, G. J., V. A. Dodd, and B. Whelan. 1996a. A socio-economic based survey of household waste characteristics in the city of Dublin, Ireland. I. Waste composition. Resour. Conserv. Recycl. 17:227–44. doi:10.1016/0921-3449(96)01070-1.
- Dennison, G. J., V. A. Dodd, and B. Whelan. 1996b. A socio-economic based survey of household waste characteristics in the city of Dublin, Ireland - II. Waste quantities. Resour. Conserv. Recycl. 17:245–57. doi:10.1016/0921-3449(96)01155-X.
- Díaz-Méndez, C., and I. García-Espejo. 2017. Eating out in Spain: Motivations, sociability and consumer contexts. Appetite 119:14–22. doi:10.1016/j.appet.2017.03.047.
- Dobernig, K., and K. Schanes. 2019. Domestic spaces and beyond: Consumer food waste in the context of shopping and storing routines. Int. J. Consum. Stud. 43:480–89. doi:10.1111/ijcs.12527.
- Dreyer, H. C., I. Dukovska-Popovska, Q. Yu, and C. P. Hedenstierna. 2019. A ranking method for prioritising retail store food waste based on monetary and environmental impacts. J. Cleaner Prod. 210:505–17. doi:10.1016/j.jclepro.2018.11.012.
- European Parliament. 2008. Directive 2008/98/EC of the European Parliament and the council of 19 November 2008 on waste and repealing certain Directives.
- Ganglbauer, E., G. Fitzpatrick, and R. Comber. 2013. Negotiating food waste: Using a practice lens to inform design. ACM Trans. Comput. - Hum. Interact. 20:1–25. doi:10.1145/2463579.2463582.
- Garcia-Garcia, G., E. Woolley, S. Rahimifard, J. Colwill, R. White, and L. Needham. 2016. A methodology for sustainable management of food waste. Waste Biomass Valorization 8 (6):2209–27. doi:10.1007/s12649-016-9720-0.
- Gomez, G., M. Meneses, L. Ballinas, and F. Castells. 2008. Characterization of urban solid waste in Chihuahua, Mexico. Waste Manage. 28 (12):2465–71. doi:10.1016/j.wasman.2007.10.023.
- Gómez, R. S., J. G. Pérez, M. D. M. L. Martín, and C. G. García. 2016. Collinearity diagnostic applied in ridge estimation through the variance inflation factor. J. Appl. Stat. 43:1831–49. doi:10.1080/02664763.2015.1120712.
- Grazhdani, D. 2016. Assessing the variables affecting on the rate of solid waste generation and recycling: An empirical analysis in Prespa Park. Waste Manage. 48:3–13. doi:10.1016/j.wasman.2015.09.028.
- Guerrero, L. A., G. Maas, and W. Hogland. 2013. Solid waste management challenges for cities in developing countries. Waste Manage. 33:220–32. doi:10.1016/j.wasman.2012.09.008.
- Hafid, H. S., N. A. A. Rahman, U. K. M. Shah, A. S. Baharuddin, and A. B. Ariff. 2017. Feasibility of using kitchen waste as future substrate for bioethanol production: A review. Renew. Sust. Energ. Rev. 74:671–86. doi:10.1016/j.rser.2017.02.071.
- Hockett, D., D. J. Lober, and K. Pilgrim. 1995. Determinants of per capita municipal solid waste generation in the southeastern United States. J. Environ. Manage. 45:205–17. doi:10.1006/jema.1995.0069.
- Jayalakshmi, S., K. Joseph, and V. Sukumaran. 2009. Bio hydrogen generation from kitchen waste in an inclined plug flow reactor. Int. J. Hydrog. Energy 34 (21):8854–58. doi:10.1016/j.ijhydene.2009.08.048.
- Jörissen, J., C. Priefer, and K. R. Bräutigam. 2015. Food waste generation at household level: Results of a survey among employees of two European research centers in Italy and Germany. Sustainability 7:2695–715. doi:10.3390/su7032695.
- Karmee, S. K. 2016. Liquid biofuels from food waste: Current trends, prospect and limitation. Renew. Sust. Energ. Rev. 53:945–53. doi:10.1016/j.rser.2015.09.041.
- Kennedy, P. A. 1992. A guide to econometrics. 4th ed. Cambridge, MA: MIT Press.
- Khair, H., I. Rachman, and T. Matsumoto. 2019. Analyzing household waste generation and its composition to expand the solid waste bank program in Indonesia: A case study of Medan City. J. Mater. Cycles Waste Manage. 21:1027–37. doi:10.1007/s10163-019-00840-6.
- Koivupuro, H.-K., H. Hartikainen, K. Silvennoinen, J.-M. Katajajuuri, N. Heikintalo, A. Reinikainen, and L. Jalkanen. 2012. Influence of socio-demographical, behavioural and attitudinal factors on the amount of avoidable food waste generated in Finnish households. Int. J. Consum. Stud. 36:183–91. doi:10.1111/j.1470-6431.2011.01080.x.
- Li, Y., Z. Chu, H. Zhang, W. Huang, and F. Liu. 2020. Predicting the implementation effect of the municipal solid waste mandatory classification policy based on the residents’ behavior. J. Air Waste Manag. Assoc. 1–11. doi:10.1080/10962247.2020.1798826.
- Lu, H., and R. Sidortsov. 2019. Sorting out a problem: A co-production approach to household waste management in Shanghai, China. Waste Manage. 95:271–77. doi:10.1016/j.wasman.2019.06.020.
- Ma, J. 2019. Shanghai’s annual output of 9 million tons of household waste ranked second in the country, who is the first? Accessed May 27, 2020. https://www.sohu.com/a/323618474_157078.
- McCarthy, B., and H. B. Liu. 2017. Food waste and the ‘green’ consumer. Australas. Mark. J. 25:126–32. doi:10.1016/j.ausmj.2017.04.007.
- Mckay, R. B., and K. Buck. 2004. Removing maximum kitchen organics from the waste stream: A case study. J. Environ. Syst. 30 (2):159–75. doi:10.2190/9DQ9-K37J-PDUB-W84C.
- Minale, M., and T. Worku. 2013. Anaerobic co-digestion of sanitary wastewater and kitchen solid waste for biogas and fertilizer production under ambient temperature: Waste generated from condominium house. Int. J. Environ. Sci. Technol. 11 (2):509–16. doi:10.1007/s13762-013-0255-7.
- Morrissey, A.J., J. Browne. 2004. Waste management models and their application to sustainable waste management: Waste Manage 24 (3):297–308. doi:10.1016/j.wasman.2003.09.005.
- Ogwueleka, T. C. 2013. Survey of household waste composition and quantities in Abuja, Nigeria. Resour. Conserv. Recycl. 77:52–60. doi:10.1016/j.resconrec.2013.05.011.
- Ojeda-Benitez, S., C. A. de Vega, and M. E. Ramirez-Barreto. 2003. Characterization and quantification of household solid wastes in a Mexican city. Resour. Conserv. Recycl. 39:211–22. doi:10.1016/S0921-3449(03)00028-4.
- Ojeda-Benítez, S., G. Lozano-Olvera, R. A. Morelos, and C. A. de Vega. 2008. Mathematical modeling to predict residential solid waste generation. Waste Manage. 28:S7–S13. doi:10.1016/j.wasman.2008.03.020.
- Paganini, M., F. Borrelli, J. Cattani, L. Ragazzoni, A. Djalali, L. Carenzo, F. D. Corte, F. M. J. Burkle, and P. L. Ingrassia. 2016. Assessment of disaster preparedness among emergency departments in Italian hospitals: A cautious warning for disaster risk reduction and management capacity. Scand. J. Trauma, Resusc. Emerg. Med. 24:101. doi:10.1186/s13049-016-0292-6.
- Parfitt, J., M. Barthel, and S. Macnaughton. 2010. Food waste within food supply chains: Quantification and potential for change to 2050. Philos. Trans. R. Soc. B 365:3065–81. doi:10.1098/rstb.2010.0126.
- Parfitt, J.P., R. Flowerdew. 1997. Methodological problems in the generation of household waste statistics: An analysis of the United Kingdom’s National Household Waste Analysis Programme. Appl. Geogr. 17(3): 231–44. doi:10.1016/S0143-6228(96)00031-8.
- Parizeau, K., M. von Massow, and R. Martin. 2015. Household-level dynamics of food waste production and related beliefs, attitudes, and behaviours in Guelph, Ontario. Waste Manage. 35:207–17. doi:10.1016/j.wasman.2014.09.019.
- Porpino, G., J. Parente, and B. Wansink. 2015. Food waste paradox: Antecedents of food disposal in low income households. Int. J. Consum. Stud. 39:619–29. doi:10.1111/ijcs.12207.
- Purkayastha, D., M. Majumder, and S. Chakrabarti. 2018. Municipal solid waste collection time optimization using AHP, GMDH and ANN. Adv. Waste Manage. 43–57. doi:10.1007/978-981-13-0215-2_4.
- Qu, X., Z. Li, X. Xie, Y. Sui, L. Yang, and Y. Chen. 2009. Survey of composition and generation rate of household wastes in Beijing, China. Waste Manage. 29:2618–24. doi:10.1016/j.wasman.2009.05.014.
- Schott, A. B. S., and T. Andersson. 2015. Food waste minimization from a life-cycle perspective. J. Environ. Manage. 147:219–26. doi:10.1016/j.jenvman.2014.07.048.
- Schwartz, S. E. O., J. E. Rhodes, B. Liang, B. Sánchez, R. Spencer, S. Kremer, and S. Kanchewa. 2014. Mentoring in the digital age: Social media use in adult - youth relationships. Child. Youth Serv. Rev. 47:205–13. doi:10.1016/j.childyouth.2014.09.004.
- Shanghai Statistical Yearbook. 2018. Accessed May 27, 2020. http://tjj.sh.gov.cn/tjnj/nj18.htm?d1=2018tjnj/C0201.htm; http://tjj.sh.gov.cn/tjnj/nj18.htm?d1=2018tjnj/C0618.htm.
- Shekar, A. V. 2009. Sustainable solid waste management: An integrated approach for Asian countries. Waste Manage. 29:1438–48. doi:10.1016/j.wasman.2008.08.025.
- Sun, K. 2016. The national challenge induced from Shanghai’s waste dumping. http://dajia.qq.com/original/category/sk20160822.html.
- Suthar, S., and P. Singh. 2015. Household solid waste generation and composition in different family size and socio-economic groups: A case study. Sustain. Cities Soc. 14:56–63. doi:10.1016/j.scs.2014.07.004.
- Thanh, N. P., Y. Matsui, and T. Fujiwara. 2010. Household solid waste generation and characteristic in a Mekong Delta city, Vietnam. J. Environ. Manage. 91:2307–21. doi:10.1016/j.jenvman.2010.06.016.
- Tian, L., L. Zhang, Y. Liu, Y. He, Y. Zhu, R. Sun, S. Yi, and J. Xiang. 2020. Clean production of ethyl levulinate from kitchen waste. J. Clean. Prod. 268:122296. doi:10.1016/j.jclepro.2020.122296.
- Umeh, P. P., K. F. Nkwocha, and S. O. Iheukwumere. 2019. Geographical analysis of household waste generation and disposal in Taraba State, Northeast Nigeria. Int. J. Geogr. And Geol. 8:58–68. doi:10.18488/journal.10.2019.82.58.68.
- Villalba, L., R. S. Donalisio, N. E. C. Basualdo, and R. B. Noriega. 2020. Household solid waste characterization in Tandil (Argentina): Socioeconomic, institutional, temporal and cultural aspects influencing waste quantity and composition. Resour. Conserv. Recycl. 152:104530. doi:10.1016/j.resconrec.2019.104530.
- Visschers, V. H. M., N. Wickli, and M. Siegrist. 2016. Sorting out food waste behaviour: A survey on the motivators and barriers of self-reported amounts of food waste in households. J. Environ. Psychol. 45:66–78. doi:10.1016/j.jenvp.2015.11.007.
- Wahlen, S., and T. Winkel. 2016. Household food waste. In Reference module in food science, ed. G. Smithers, 1–5. Amsterdam, NL: Elsevier.
- Williams, H., F. Wikström, T. Otterbring, M. Löfgren, and A. Gustafsson. 2012. Reasons for household food waste with special attention to packaging. J. Clean. Prod. 24:141–48. doi:10.1016/j.jclepro.2011.11.044.
- WRAP. 2009. Household food and drink waste in the UK. Accessed September 23, 2020. http://www.wrap.org.uk/sites/files/wrap/Household%20food%20and%20drink%20waste%20in%20the%20UK%20-%20report.pdf.
- Wu, S. J., X. Bai, and S. T. Fiske. 2018. Admired rich or resented rich? How two cultures vary in envy. J. Cross Cult. Psychol. 49 (7):1114–43. doi:10.1177/0022022118774943.
- Yang, C., M. Yang, and Q. Yu. 2012. An analytical study on the resource recycling potentials of urban and rural domestic waste in China. Procedia Environ. Sci. 16:25–33. doi:10.1016/j.proenv.2012.10.005.
- Yang, F., Y. Li, Y. Han, W. Qian, G. Li, and W. Luo. 2019. Performance of mature compost to control gaseous emissions in kitchen waste composting. Sci. Total Environ. 657:262–69. doi:10.1016/j.scitotenv.2018.12.030.
- Zamroni, M., R. S. Prahara, A. Kartiko, D. Purnawati, and D. W. Kusuma. 2020. The waste management program of 3R (Reduce, Reuse, Recycle) by economic incentive and facility support. J. Phys.: Conf. Ser. 1471:12048. doi:10.1088/1742-6596/1471/1/012048.
- Zhao, X., M. Lan, H. Li, and J. Yang. 2020. Perceived stress and sleep quality among the non-diseased general public in China during the 2019 coronavirus disease: A moderated mediation model. Sleep Med. doi:10.1016/j.sleep.2020.05.021.
- Zhang, W., Y. Che, K. Yang, X. Ren, and J. Tai. 2012. Public opinion about the source separation of municipal solid waste in Shanghai, China: Waste Manage. Res. 30(12):1261–71. doi:10.1177/0734242x12462277.
- Zheng, J., M. Xu, M. Cai, Z. Wang, and M. Yang. 2019. Modeling group behavior to study innovation diffusion based on cognition and network: An analysis for garbage classification system in Shanghai, China. Int. J. Environ. Res. Public Health. 16:3349. doi:10.3390/ijerph16183349.