
ABSTRACT
In this study, the mercury (Hg) emission, speciation, and mass distribution of four coal-fired power plants (CFPPs) located at central, southern, and northern Taiwan with various types of air pollution control devices were investigated. Gaseous Hg in the coal-combustion flue gas was sampled by using the Ontario Hydro method, and the solid and liquid samples were collected for understanding the Hg mass balance. The experimental results showed that the total Hg concentrations in flue gases at the inlets of selective catalytic reduction (SCR) varied from 2.984 to 4.692 μg Nm−3, while the total Hg concentrations in the flue gases at the stacks ranged from 0.240 to 0.675 μg Nm−3. These four CFPPs showed similar Hg speciation results at the stacks. The average Hg removal efficiencies of Plants 1 (SCR + electrostatic precipitator [ESP] + wet flue gas desulfurization [WFGD]), 2 (SCR + ESP + WFGD), 3 (SCR + bag filter (BF) + seawater flue gas desulfurization [SWFGD]) and 4 (SCR + BF + SWFGD) were 92.4%, 90.1%, 85.9%, and 84.8%, respectively. Coal was the major raw material in Hg input of CFPPs with a mass flow rate ranging 5.87–12.05 g hr−1. Elemental Hg (Hg0), accounting for 66.4%−97.1% of the total Hg, was the dominant species emitted to the atmosphere. The Hg mass balances for the four CFPPs varied from 86.0% to 117% of the Hg input, suggesting that good mass balances were obtained from the tested CFPPs.
Implications: Mercury emissions from coal-fired power plant (CFPPs) have been greatly concerned and should thus be better comprehended. The present study examined the mercury speciation and mass distribution of four CFPPs located at Taiwan. Overall, these CFPPs had similar Hg speciation results at stack and Hg0 was the dominant species emitted to the atmosphere. The selective catalytic reduction (SCR) + electrostatic precipitator (ESP) + wet flue gas desulfurization (WFGD) system had the highest Hg removal efficiency and the Hg mass balances for the four CFPPs varied from 86.0 to 117%. This study helps better understanding the Hg emission inventory of CFPPs and provides useful information for selecting adequate air pollution control devices (APCDs) for Hg control.
Introduction
Mercury (Hg) has been known as a global hazardous pollutant owing to its high toxicity, long-distance transport, persistence, and bioaccumulability in the environment, causing serious damage to the environment and human health. Therefore, atmospheric Hg emissions from anthropogenic sources have caused great concerns in recent years. Atmospheric Hg could be contributed from different sources such as coal combustion, non-ferrous smelting, and cement production (UNEP Citation2013a). Coal combustion for generating electricity is one of the dominant sources of anthropogenic Hg emissions to the atmosphere (Masoomi et al. Citation2020; Su et al. Citation2017; Wilcox et al. Citation2012; Zhang et al. Citation2012; Zhao et al. Citation2017a, Citation2017b), and coal-fired power plants (CFPPs) are considered to be one of the largest Hg sources in several countries (Pacyna et al. Citation2010; Tang et al. Citation2016). The Minamata Convention on Mercury delivered on March 19, 2013 addressed the necessity of prevention and abatement of Hg emission and release via global and legally-binding agreements between countries (UNEP Citation2013b). The Minamata Convention also indicated that reducing mercury emission to the atmospheric from CFPPs should be implemented. There are six CFPPs in Taiwan including twenty-four coal-fired power generation units with an total installed capacity of 14.6 GW. The air pollution control devices (APCDs), including low NOx burner (LNB) + selective catalytic reduction (SCR) + electrostatic precipitator (ESP) + wet flue gas desulfurization (WFGD) and LNB + SCR + bag filter (BF) + seawater flue gas desulfurization (SWFGD), were used for subcritical and ultra-supercritical pressure boilers in coal-fired power plants, respectively. Additionally, these CFPPs emit approximately 0.145 metric ton of Hg each year, around 9% (1.61 metric ton of Hg each year) of the atmospheric Hg emissions from the anthropogenic sources in Taiwan (Taiwan EPA,Citation2019).
Hg emissions to the atmosphere from CFPPs account for 26% of global anthropogenic Hg (AMAP Citation2008). Fossil fuel (primarily coal) burning contributes Hg emission flux of 700–900 Mg/yr to the atmosphere (Pacyna et al. Citation2010; Pirrone et al. Citation2010; Streets et al. Citation2011; Streets, Zhang, and Wu Citation2009). Glodek and Pacyna (Citation2009) also suggested that the main source of anthropogenic Hg emission to the atmosphere was due to coal combustion, contributing 38% of the total Hg emission in China (Streets et al. Citation2005). There were over 2,000 CFPPs in China making it as the largest single atmospheric Hg emitter in the world (Zhao et al. Citation2017a). In China, CFPPs and industrial boilers emit around 250 metric ton of Hg each year, or around half of atmospheric Hg emissions from the anthropogenic sources (Hu and Cheng Citation2016). Therefore, obtaining a better understanding of Hg distribution and speciation in the coal combustion process is critical and would greatly help in improvement of comprehending the global Hg emission inventory and control of the atmospheric Hg emissions.
The trace amounts of Hg were reported to be 0.01–0.5 mg kg−1 in coal (Wang et al. Citation2010). Krzyżyńska et al. (Citation2020) also indicated that the Hg concentration in coals generally ranges from 0.05 to 0.5 μg g−1. After combustion in high temperatures boilers, the Hg in coal releases into the exhaust gas. Generally, Hg emitted from coal combustion exists in three major forms in the flue gas, elemental mercury (Hg0), oxidized mercury (Hg2+), and particle-bound mercury (Hgp) (Su et al. Citation2017; Tang et al. Citation2016; Wang et al. Citation2010; Zhao et al. Citation2017a). The different physicochemical forms of Hg influence its transport and fates in the environment (Tang et al. Citation2016). Hg0 is volatile, relatively inert, and insoluble in water, and can stay in the atmosphere for 0.5 − 2 yr (Galbreath and Zygarlicke Citation2000; Galbreath et al. Citation2000); it is difficult to control the emission by typical air pollution control devices (APCDs). Notably, catalytic oxidation of Hg0 to Hg2+ by SCR can help Hg2+ being captured in the subsequent WFGD system, which provides an effective way to control Hg0 emission from CFPPs (Chiu, Hsi, and Lin Citation2015a; Chiu et al. Citation2015b; Su et al. Citation2017; Zhang et al. Citation2020). Compared to Hg0, Hg2+ and Hgp can be easily removed by APCDs, such as WFGD, ESP, and fabric filter (FF) (Liu et al. Citation2019; Pavlish et al. Citation2003; Slemr, Seiler, and Schuster Citation1981; Tang et al. Citation2016; Zhao et al. Citation2017b) due to their lower volatility, higher chemical activity, and higher water solubility (Galbreath et al. Citation2000; Lindberg and Stratton Citation1998; Tang et al. Citation2016; Zhao et al. Citation2017b). Therefore, some countries have been studying and utilizing conventional APCDs to control Hg emissions from CFPPs (Li et al. Citation2019; Liu et al. Citation2019; Srivastava et al. Citation2006; Wdowin et al. Citation2015, Citation2014; Wiatros-Motyka et al. Citation2013).
Hg in CFPPs was mainly contributed from coal and lime/limestone feeding, distributed in ESP fly ash (57.6%−64.3%), gypsum (4.5%−12.9%), effluents (0.5%−1.9%), and stack emission (15.2%−27.0%) (Kim et al. Citation2010). Therefore, the existing APCDs in CFPPs could play a role in reducing Hg emissions into the atmosphere and affect the magnitudes of Hg emission factors. Wang et al. (Citation2010) indicated that the average Hg removal efficiencies of ESP, ESP + WFGD, and ESP + dry flue gas desulfurization (FGD)−FF systems were 24%, 73%, and 66%, respectively, and a SCR system reduced about 32% of total Hg and oxidized 16% Hg0. Liu et al. (Citation2016) showed that the average Hg removal efficiencies from dust collector plus WFGD were > 50% and the Hg0 removal efficiency of FF was two times more than that of ESP. Su et al. (Citation2017) showed that 57%–64% of Hg0 was transformed to Hg2+ by a SCR system and then increased the Hg2+ removal efficiencies of SWFGD, which ranged from 67% to 82%. Tang et al. (Citation2016) also indicated that limestone WFGD had higher removal efficiency for Hg2+ (87%−95%) than Hg0 and Hgp. Additionally, Li et al. (Citation2019) indicated that SCR converted 90.3% of Hg0 into Hg2+, and ESP-FF removed 99.8% of Hgp downstream, and WFGD absorbed 96.8% of Hg2+ in a CFPPs.
More detailed measurements are still needed to better understand the Hg concentrations and species transformation in the combustion process of coal, which is vital to further comprehend the mass flow of Hg in CFPPs that greatly influence the fates of Hg in different environmental media. The main objectives of this study are to better understand (1) the Hg mass flows and speciation in four CFPPs in Taiwan based on the field samplings, (2) the concentration and removal efficiency of various Hg species by various APCDs, and (3) the Hg emission rates of these four CFPPs. These data provide an insight into the Hg speciation and distribution across APCDs and can be further utilized to evaluate the environmental impacts of Hg emissions from CFPPs. It is worth noting that few studies reported Hg speciation and mass balance results about CFPPs equipped BF combined with SWFGD. The obtained data also help understanding if a retrofit on existing APCDs or additional control measures (e.g., activated carbon injection) are required for compliance of regulations.
Experimental section
Power plants tested
Onsite tests were carried out in four CFPPs located at central (Plant 1), southern (Plants 2 and 3), and northern (Plant 4) Taiwan, covering the most common unit types in terms of boiler and APCD variety. Plants 1 and 2 are equipped with subcritical pressure boilers, and Plants 3 and 4 are equipped with ultra-supercritical pressure boilers. The sampling campaigns were conducted on August 29, 30, and 31, 2011 for Plant 1; on February 21, 22, and 23, 2012 for Plant 2; on October 24, 25, and 26, 2018 for Plant 3; and on October 31 and November 1 and 2, 2017 for Plant 4. Sampling campaigns in each power plant lasted 3 days, the sampling was done one time per day, and each APCD location was sampled for 2 h. As shown in , the tested burners are 550 MW (Unit #5), 500 MW (Unit #2), 800 MW (Unit #1), and 800 MW (Unit #1) for Plants 1, 2, 3, and 4, respectively. Bituminous and subbituminous coals from Indonesia, Australia, and Colombia were pulverized and blended for firing. Three Hg sampling campaigns were performed in this study for each plant. All test units have an ESP or BF system for removing particles in flue gases. Two of four tested units install limestone WFGD, and the other two plants use SWFGD to control SO2 emissions. In addition, all test plants install SCR to control NOx emissions. All of the power units were operated under full-load, normal conditions during those tests.
Table 1. Information of the onsite tested utility boilers
Sampling procedure and analysis methods
During the test period, the measurements for the concentrations of Hg0, Hg2+, Hgp, and total Hg in flue gases were carried out at the inlets of the SCR, ESP, WFGD, and at the stack for Plants 1 and 2, as well as at the inlets of SCR, BF, SWFGD, and at the stack for Plants 3 and 4. The Hg speciation in exhausted flue gases was analyzed by the standard test method for Hg0, Hg2+, Hgp, and total Hg in flue gases generated from coal-fired stationary sources (i.e., D6784-02, Ontario Hydro Method; OHM) (ASTM, Citation2002). The quartz fiber filter was used to collect Hgp; Hg2+ was captured by impingers with KCl solution. Then, Hg0 was oxidized and absorbed by impingers with H2O2 + HNO3 solution and H2SO4+ KMnO4 solution. In order to ensure full absorption of Hg, all of the impingers were put in an ice bath. Silica gel was used to remove moisture in the flue gas. The samplers (probe and filters) were heated to 120 °C to prevent water and acid condensation. After sampling, the Hg concentration was analyzed by cold vapor atomic absorption spectrometry (CVAAS; NIC RA-3320, Japan), for which the detection range of Hg concentration was 0.5‒100 μg Nm−3.
Liquid and solid samples were collected in the field, including coal, limestone powder, gypsum cake, bottom ash/slag, fly ash, WFGD/SWFGD influent water, and WFGD/SWFGD liquid. The Hg contents in those liquid and solid samples were obtained based on USEPA methods 7473, 245.1, and 1631e, respectively. The data obtained from each onsite test were averaged to obtain the final results. The total Hg concentration in solid samples was analyzed by combustion atomic absorption spectrometry with gold amalgamation (NIC MA-2000 & MA-3000, Japan). The method was described in details in USEPA Method 7473 (USEPA Citation2007). Controlled heating in an oxygenated decomposition furnace was used to liberate Hg from the solid samples in the instrument. The sample was dried and then thermally and chemically decomposed within the decomposition furnace. The decomposition products were then carried to an amalgamator that selectively trapped Hg, the amalgamator was rapidly heated, releasing Hg vapor. The absorbance (peak height or peak area) of Hg concentration was determined at 253.7 nm as a function (USEPA Citation2007). The instrument detection limit (IDL) and method detection limit (MDL) for the total Hg determination was 1 ng and 0.002 μg g−1, respectively.
The total Hg concentration in liquid samples was analyzed by United States Environmental ProtectionAgency (USEPA) methods 245.1 (USEPA, Citation1994) and 1631e (USEPA, Citation2002). For the USEPA Method 245.1, a known portion of water sample is transferred to a biological oxygen demand (BOD) bottle, equivalent ground glass stoppered flask, or other suitable closed container. It is digested in diluted potassium permanganate-potassium persulfate solutions and oxidized for 2 h at 95°C. Hg in the digested water sample is reduced with stannous chloride to elemental Hg and then measured by the CVAAS (NIC RA-3220, Japan); the detection range of the method is 0.2−10 µg Hg L−1. USEPA Method 1631e is for determining Hg in filtered and unfiltered water by oxidation, purge and trap, desorption, and cold-vapor atomic fluorescence spectrometry (Tekran 2600-IVS, USA). The detection range of the method is 0.5−100 ng Hg L−1. After the data from each CFPP were analyzed and calculated, the removal efficiencies and mass balance of Hg in these CFPPs were determined.
Quality assurance and quality control
To ensure the representativeness of the experiment results and to decrease the experimental error, as aforementioned, the sampling campaigns in each power plant would last 3 days; the sampling was done one time per day, and each APCD location was sampled for 2 h. By doing so, all sampling tests and analyses were carried out at least three times to obtain an average result and to reduce uncertainties. Each of the seven impingers in the sampling train of the OHM was recovered and analyzed separately.
Solid samples were first dried at room temperature to a constant weight. Then, homogenization and pulverization were performed. In this study, each solid sample was analyzed at least twice to obtain an average result. Standard reference materials from the National Institute of Standards and Technology, USA (NIST 1632c, coal) were used to guarantee the analytical quality. The Hg mass balance was conducted according to the Hg concentration of flue gas and solid samples, and the Hg recovery was found to be 86.0%‒117%, which is acceptable for field tests (Yokoyama et al. Citation2000).
Results and discussion
Mercury concentration and speciation in flue gas
gives the concentrations of total Hg, Hg0, Hg2+, and Hgp across APCDs and at the stack in four CFPPs. The total Hg concentrations in the flue gas at the inlet of SCR varies over a range from 2.984 ± 0.520 to 4.692 ± 1.046 μg Nm−3, while the total Hg concentrations in the flue gas at the stack ranged from 0.240 ± 0.111 to 0.675 ± 0.222 μg Nm−3. In this study, the pulverized coal-burning unit emitted a lower concentration of total Hg than the anthracite and bituminous coal-fired boilers in a previous study (Wang et al. Citation2010). Notably, the Hg emission concentrations from the stack of these four tested CFPPs were lower than those of China and South Korea in the range of 0.29–9.16 and 0.48–16.3 μg m−3, respectively, and also lower than those of Poland, Netherlands, and the United States within the range of 2.0–15.1 μg m−3 (Zhao et al. Citation2019). During coal combustion, most of the Hg is first released as Hg0 form (i.e, for Plants 3 and 4). Additionally, the Hg speciation prior to SCR was mainly in particle-bound form; a portion of Hg0 could transform into Hg2+, and wass then subsequently absorbed onto the particle surface to form Hgp (i.e., for Plants 1 and 2). Because this study did not use an ash-free probe that could eliminate a majority of the ash effects for Hg sampling, the possibility of fly ash buildup is much larger in the OHM sampling process, resulting in more opportunity for gaseous Hg to transform into Hgp and Hg0 to transform into Hg2+ (Cao et al. Citation2005). In all test plants, Hg0 significantly decreased across SCR, and then Hg2+ was captured by passing through FGD. Hg0 decreased from 0.811 ± 0.173 to 0.601 ± 0.081 μg Nm−3, 0.539 ± 0.121 to 0.186 ± 0.023 μg Nm−3, 2.865 ± 0.279 to 1.046 ± 0.312 μg Nm−3, and 2.152 ± 0.786 to 0.948 ± 0.0.313 μg Nm−3 for Plants 1, 2, 3, and 4, respectively, at the outlet of SCR. Niksa and Fujiwara (Citation2005) indicated that HCl in flue gas first absorbs at the SCR to generate active sites and then reacts with weakly bound Hg0. Therefore, the SCR system is beneficial for the Hg0 oxidation. Hg2+ and Hgp increased at the outlet of SCR due to the transformation of Hg0 to Hg2+ and a portion of Hg2+ absorbed on fly ash to form Hgp (Thompson et al. Citation2009).
Table 2. Concentration of mercury species in flue gases sampled at the inlet of APCDs and at the stack (n = 3)
also shows that Hgp significantly decreased at the outlets of ESP and BF. Hgp decreased from 2.058 ± 0.644 to 0.047 ± 0.005 μg Nm−3, 3.859 ± 0.298 to 0.038 ± 0.014 μg Nm−3, 0.475 ± 0.082 to 0.0001 ± 0.000 μg Nm−3, and 0.865 ± 0.355 to 0.001 ± 0.001 μg Nm−3 for Plants 1, 2, 3, and 4, respectively. Due to a high fly ash capture efficiency, the amounts of Hgp at the ESP and BF outlets are small. Thus, ESP and BF showed good removal effects on Hgp. Notably, also shows that the Hg0 concentration increased when the gas stream flowed through the ESP system. These results may indicate that Hgp and Hg2+ could be reduced to reform Hg0, or the physically adsorbed Hg0 on the particle surface as Hgp could be repartitioned into the gaseous phase, causing the increase in Hg0 concentration. Wang et al. (Citation2010) indicated that the balance between Hg2+ and Hg0 was broken when some of the Hg0 was adsorbed onto the particles and removed by ESP, at which time some Hg2+ converts into Hg0 to build up a new balance. Zhang et al. (Citation2016) also indicated that charging anode of ESP can neutralize Hg2+ and convert it to Hg0, while Hg0 in flue gas continues to be oxidized to Hg2+ via heterogeneous reactions in ESP under 150−200 ◦C, resulting in the Hg0 concentration to either increase or decrease inside ESP depending on the processes’ interplay.
These four CFPPs had similar Hg speciation results at stack. Hg0 was the main species in stack sampling points, and the Hg0 concentrations were 0.221 ± 0.111, 0.424 ± 0.177, 0.399 ± 0.031, and 0.448 ± 0.112 μg Nm−3 for Plants 1, 2, 3, and 4, respectively. Hg0 occupies 66.4%−97.1% of the total Hg in the flue gases at the stacks of these four CFPPs.
Mercury concentration in different solid and liquid samples
The Hg concentrations of solid and liquid samples collected in the four tested CFPPs are shown in . Coal was the main raw material in the electricity generation process in CFPPs and the Hg concentrations in coal were 0.031 ± 0.006, 0.043 ± 0.018, 0.021 ± 0.002, and 0.047 ± 0.009 mg kg−1 for Plants 1, 2, 3, and 4, respectively. Notably, the main sources of coal in this four tested power plants were Australia, Indonesia, and Colombia; the mean Hg concentration in these coal ranged from 0.021 − 0.043 mg kg−1. Compared with the mean value of Hg content in the coal of the world (0.1 mg kg−1) (Yudovich and Ketris Citation2005), China (0.20 mg kg−1) (Yang et al. Citation2015), United States (0.17 mg kg−1) (Finkelman Citation1993), South African (0.20 mg kg−1) (Lusilao-Makiese et al. Citation2012), Indonesia (0.10 mg kg−1) (Belkin et al., Citation2009), Poland (0.05 mg kg−1) (Wierzchowski, Checko, and Pyka Citation2017), and Australia (0.06 mg kg−1) (Swaine and Goodarzi Citation1995), the Hg concentrations in the coals used in the four tested CFPPs plants were lower. Other input materials, such as WFGD and SWFGD influent water, had low Hg concentrations from 0 to 0.0082 ± 0.0012 μg L−1 (the Hg concentration in the WFGD influent water of Plant 2 was under the detection limit), as compared to those in coal. However, the Hg concentrations in limestone powder were from 0.034 ± 0.002 to 0.036 ± 0.002 mg kg−1, which were comparable to those in coal. The concentrations of Hg in gypsum cake were 0.267 ± 0.028 mg kg−1 in Plant 1 and 0.359 ± 0.031 mg kg−1 in Plant 2, respectively. Notably, the FGD liquid in Plant 1 had the greatest Hg concentration (94.2 μg L−1) as compared to those in the WFGD/SWFGD liquid of tested CFPPs. Additionally, the fly ash, a raw material from waste, had Hg concentrations as high as 0.204 ± 0.035 mg kg−1 in Plant 1 and 0.305 ± 0.049 mg kg−1 in Plant 2, respectively, and with lower Hg concentrations in Plant 3 (0.060 ± 0.001 mg kg−1) and Plant 4 (0.081 ± 0.037 mg kg−1) as compared to Plants 1 and 2. The four CFPPs had similar Hg concentrations in bottom ash/slag ranging from 0.001 ± 0.001 to 0.003 ± 0.001 mg kg−1. Notably, pulverized coal was the only fuel used in these four CFPPs. The Hg concentrations in pulverized coals range from 0.021 ± 0.002 to 0.047 ± 0.009 mg kg−1 in the four CFPPs. Tang and Pan (Citation2013) indicated the average Hg concentration in pulverized coal ranging from 0.023 to 0.043 mg kg−1 in four typical pulverized coal fired boilers in a large-scale power plant. The measurement of Hg concentration in the different solid and liquid samples shows the variation in the characteristics of Hg in the electricity generation process of CFPPs, which could be greatly different, plant to plant, and case-specific. All of the collected data have been used for the calculation of Hg mass balance in the four tested CFPPs.
Table 3. Mercury concentration of coal, lime slurry, ash, gypsum, and WFGD/SWFGD liquid (n = 3)
Mercury removal efficiencies of APCDs
Results in clearly indicated that the removal efficiencies of total Hg by the tested ESP system were 62% and 69% for Plants 1 and 2, respectively. Large removal efficiencies of 98% and 99% for Hgp were shown for ESP in Plants 1 and 2, respectively. Results in also showed that the removal efficiencies of total Hg by the tested BF system were 28% and 14% for Plants 3 and 4, respectively. Notably, the Hg0 removal efficiencies of Plants 3 and 4 for BF were 99.9% and 99.9%, respectively. Additionally, results in also showed that FGD removed 78% (Plant 1), 60% (Plant 2), 79% (Plant 3), and 83% (Plant 4) of the total Hg. The removal efficiencies of Hg0, Hg2+, and Hgp for Plant 1 were 66%, 98%, and 66%, respectively, and those for Plant 2 were 7%, 86%, and 84%, respectively, and those for Plant 3 were 59%, 99%, and 0%, respectively, and those for Plant 4 were 21%, 93%, and 0%, respectively. Notably, larger removal efficiency for Hg2+ as compared with Hg0 and Hgp was shown in the four tested CFPPs. Because Hg0 is only slightly water-soluble and is typically difficult to be removed by wet scrubbing, the great removal in Hg0 may be contributed by an enhancing oxidation of Hg0 into Hg2+ by the added lime slurry. In contrast, the resulting Hg2+ is highly water-soluble and can be easily removed by the FGD system.
In this study, the average Hg removal efficiencies of the Plants 1 (SCR+ESP+WFGD), 2 (SCR + ESP + WFGD), 3 (SCR + BF + SWFGD), and 4 (SCR + BF + SWFGD) were 92%, 88%, 87%, and 86%, respectively, as shown in . These results indicate that Hg removal efficiencies of SCR + ESP + WFGD is slightly higher than that of SCR + BF + SWFGD and the Plant 1 has the highest Hg removal efficiency (92%). Wang et al. (Citation2010) indicated that as compared to ESP + WFGD, the combination of SCR + ESP + WFGD has relatively higher Hg removal efficiency due to the oxidizing effect of SCR. Li et al. (Citation2019) also indicated that a combination of SCR + ESP – FF + WFGD leads to a co-beneficial Hg control of 96%. The synergistic removal efficiency of Hg by APCDs installed in the tested seven CFPPs is 66.69%–97.56% (Liu et al. Citation2019). Pudasainee et al. (Citation2010) also showed that many factors impact on Hg removal efficiencies during coal combustion in the CFPP, including the Hg content in the coal, the available concentration of oxygen or halogen, the residence time of flue gas, and the Hg removal rate across APCDs. These results strongly indicate that for a coal-fired utility burner equipped with thorough APCDs, high Hg removal efficiency can be achieved via adequate operation of the burner and the APCDs. A retrofit on existing APCDs or additional control strategies (e.g., adsorbent injection system) may not be needed for compliance of regulations because the Hg emission is regulated to be lower than 5 µg Nm−3 for existing facilities in Taiwan.
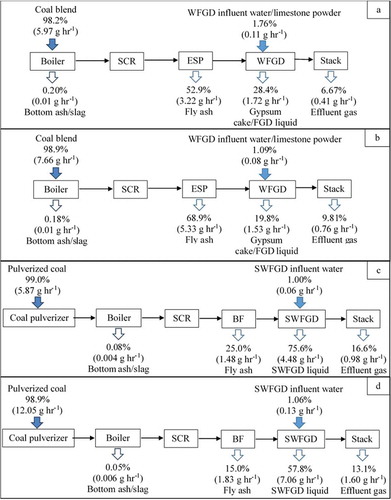
Figure 1. Mercury mass balance for (a) Plant 1; (b) Plant 2; (c) Plant 3; and (d) Plant 4
Mercury mass balance in coal-fired power plants
and show the mass distribution of Hg according to the Hg mass balance at the four tested CFPPs. The data used to calculate the mass balance are also shown in Supplementary Data, Tables S1--S4 for clarity. Hg entered into the power plant from coal, and WFGD influent water/limestone powder is released through several streams: boiler bottom ash/slag, fly ash (ESP), FGD by-products (gypsum cake, WFGD/SWFGD liquid), and effluent gas emission. The average Hg mass flows entering the boiler from coal feeding were 5.97, 7.66, 5.87, and 12.1 g hr−1 for Plants 1, 2, 3, and 4, respectively, and the Hg mass flows in WFGD influent water/limestone powder were 0.107 and 0.084 g hr−1 for Plants 1 and 2, respectively, and those in SWFGD influent water were 0.059 and 0.130 g hr−1 for Plants 3 and 4, respectively. Besides, in the output stream, 3.22, 5.33, 1.48, and 1.83 g hr−1 of Hg were present in the fly ash of the ESP/BF for Plants 1, 2, 3, and 4, respectively. Also, 1.72 and 1.53 g hr−1 of Hg were present in gypsum cake/WFGD liquid for Plants 1 and 2, respectively and 4.48 and 7.06 g hr−1 in SWFGD liquid for Plants 3 and 4, respectively. Approximately 0.012, 0.014, 0.004, and 0.006 g hr−1 of Hg were present in the boiler bottom ash/slag for Plants 1, 2, 3, and 4, respectively. Additionally, gaseous emission rates from the stack were 0.405, 0.760, 0.984, and 1.60 g hr−1 for Plants 1, 2, 3, and 4, respectively.
Table 4. Calculated mercury mass flows in flue gas, coal, lime slurry, ash, gypsum, and WFGD/SWFGD liquid (n = 3)
Figure 2. Overall mercury removal efficiencies of tested CFPPs using different APCDs
The 98.2% Hg input was contributed by coal blend for Plant 1, as well as 98.9% by coal blend for Plant 2, respectively. In addition, the 99.0% Hg input was contributed by pulverized coal for Plant 3 and 98.9% by pulverized coal for Plant 4. Notably, about 1.09%−1.76% Hg input by WFGD influent water/limestone powder for Plants 1 and 2, as well as 1.00%−1.06% by SWFGD influent liquid for Plants 3 and 4. Results also showed that only 0.05%−0.20% of Hg was retained in the bottom ash or slag; about 15.0%−68.9% of Hg was adsorbed by fly ash and then collected. Additionally, about 19.8%−75.6% of Hg was removed by the WFGD or SWFGD liquid, and the remaining 6.67%−16.6% of Hg in the effluent gas was emitted to the atmosphere. As seen from , most Hg was absorbed by fly ash then captured by ESP in Plants 1 (52.9%) and 2 (68.9%), as well as most Hg was absorbed by seawater in Plants 3 (75.6%) and 4 (57.8%). Notably, Hg0 was oxidized by SCR system resulting in the proportion of Hg2+ or HgP increased in the flue gas at the WFGD/SWFGD inlet, ultimately increasing the amount of Hg removed by WFGD/SWFGD. These results also indicate that Hgp captured by ESP and absorption of Hg2+ in SWFGD are the main ways to remove Hg in the studied CFPPs. The total Hg output and mass balance were thus calculated to be 88.2%, 98.6%, 117%, and 86.0% for Plants 1, 2, 3, and 4, respectively, within an acceptable range of 70%−130% for a single test (Chen et al. Citation2008; Takahisa and Kazuo Citation2000; Yokoyama et al. Citation2000; Zhao et al. Citation2017a). These experimental results are comparable to those reported in previous studies, which indicated that Hg mass balances for all individual tests ranged from 103% to 115% (Su et al. Citation2017), and the average Hg mass balance in the range of 104.1%−112.9% was obtained from a commercial coal-fired circulating fluidized bed (CFB) power plant (Li et al. Citation2020). In addition, Wang et al. (Citation2010) also showed that Hg balances recovery rates ranged from 87 to 116% for six power plants and the Hg mass balance for the tested seven CFPPs varied from 72.9% to 109.7% (Liu et al. Citation2019). These previous data support that good mass balances are also obtained from the four tested CFPPs.
Conclusion
The present study examined the Hg emission, speciation, and mass balance in four Taiwan’s CFPPs with various types of APCDs. The experimental results indicate that these four CFPPs have similar Hg speciation results at stack with Hg0 as the main species in stack. The measurement of Hg concentration in the different solid and liquid samples showed the variation in the characteristics of Hg in CFPPs, which could be greatly different, plant to plant, and case-specific. The experimental results also showed that the average Hg removal efficiencies of the four tested CFPPs ranged from 84.8%−92.4% and the SCR + ESP + WFGD system in Plant 1 showed the highest Hg removal efficiency. The total Hg output and mass balance were thus calculated to be 88.2%, 98.6%, 117%, and 86.0% for Plants 1, 2, 3, and 4, respectively, within an acceptable range with 70%–130% for a single test. The results obtained from this study help better understand the Hg emission inventory of CFPPs with various types of APCDs, as well as providing useful information for selecting/adding new or retrofitting existing APCDs for advanced Hg control in the future.
Highlights
Hg speciation and mass distribution from four power plants (CFPPs) are studied.
The total Hg at the stack was from 0.240 to 0.675 μg Nm−3 of the four test CFPPs.
Hg0 was the main species at the stack sampling points of the four test CFPPs.
The average Hg removal efficiencies of the four test CFPPs were 84.8%−92.4%.
The Hg mass balances for the four CFPPs varied from 86.0% to 117%.
Mass balance calculation
In this study, Hg mass balance was obtained based on the average volumetric/mass flow rates of flue gas, coal, lime slurry, ash, gypsum, and WFGD liquid and their corresponding Hg concentrations. The data used to calculate the mass balance are listed in Tables S1--S4.
Supplemental Material
Download MS Word (41.8 KB)Disclosure statement
No potential conflict of interest was reported by the authors.
Supplementary material
Supplemental data for this article can be accessed on the publisher’s website.
Additional information
Funding
Notes on contributors
Chien-Ping Chou
Chien-Ping Chou is a Ph.D. student at Institute of Environmental Engineering and Management, National Taipei University of Technology, in Taipei, Taiwan, and he is also a senior researcher at Green Energy and Environment Research Laboratories, Industrial Technology Research Institute, in Hsinchu, Taiwan.
Chun-Hsiang Chiu
Chun-Hsiang Chiu is a postdoctoral fellow at Research Center for Environmental Changes, Academia Sinica, in Taipei, Taiwan.
Tien-Chin Chang
Tien-Chin Chang is a professor at Institute of Environmental Engineering and Management, National Taipei University of Technology, in Taipei, Taiwan.
Hsing-Cheng Hsi
Hsing-Cheng Hsi is a professor at Graduate Institute of Environmental Engineering, National Taiwan University, in Taipei, Taiwan.
References
- Arctic Monitoring and Assessment Programme (AMAP) and United Nations Environment Programme (UNEP). 2008. Technical background report to the global atmospheric mercury assessment. Geneva, Switzerland: AMAP and UNEP.
- ASTM International. 2002. ASTM D6784: Standard test method for elemental, oxidized, particle bound, and total Hg in flue gas generated from coal-fired stationary sources (Ontario hydro method). West Conoshockton, PA: American Society for Testing and Materials.
- Belkin, H. E., S. J. Tewalt, J. C. Hower, J. D. Stucker, and J. M. K. O’Keefe. 2009. Geochemistry and petrology of selected coal samples from Sumatra, Kalimantan, Sulawesi, and Papua. Indonesia. Int. J. Coal Geol. 77:260–68. doi:10.1016/j.coal.2008.08.001.
- Cao, Y., Y. F. Duan, S. Kellie, L. C. Li, W. B. Xu, J. T. Riley, W. P. Pan, P. Chu, A. K. Mehta, and R. Carty. 2005. Impact of coal chlorine on mercury speciation and emission from a 100-MW utility boiler with cold-side electrostatic precipitators and low-NOx burners. Energy Fuels 19:842–54. doi:10.1021/ef034107u.
- Chen, J. S., D. X. Yuan, Q. L. Li, J. M. Zheng, Y. Q. Zhu, X. Y. Hua, S. He, and J. S. Zhou. 2008. Effect of flue-gas cleaning devices on mercury emission from coal-fired boiler. Proc. CSEE 28 (2):72–76.
- Chiu, C. H., H. C. Hsi, and H. P. Lin. 2015a. Multipollutant control of Hg/SO2/NO from coal-combustion flue gases using transition metal oxide-impregnated SCR catalysts. Catal. Today 245:2–9. doi:10.1016/j.cattod.2014.09.008.
- Chiu, C. H., H. C. Hsi, H. P. Lin, and T. C. Chang. 2015b. Effects of properties of manganese oxide-impregnated catalysts and flue gas condition on simultaneous control of Hg0/SO2/NO. J. Hazard. Mater. 291:1–8. doi:10.1016/j.jhazmat.2015.02.076.
- Finkelman, R. B. 1993. Trace and minor elements in coal. In Organic geochemistry, ed. M. H. Engel and S. A. Macko, 10–12. New York: Plenum.
- Galbreath, K. C., and C. J. Zygarlicke. 2000. Mercury transformations in coal combustion flue gas. Fuel Process. Technol. 65-66:289–310. doi:10.1016/S0378-3820(99)00102-2.
- Galbreath, K. C., C. J. Zygarlicke, E. S. Olson, J. H. Pavlish, and D. L. Toman. 2000. Evaluating mercury transformation mechanisms in a laboratory-scale combustion system. Sci. Total Environ. 261 (1–3):149–55. doi:10.1016/S0048-9697(00)00637-9.
- Glodek, A., and J. M. Pacyna. 2009. Mercury emission from coal-fired power plants in Poland. Atmos. Environ. 43 (35):5668–73. doi:10.1016/j.atmosenv.2009.07.041.
- Hu, Y., and H. Cheng. November 2016. Control of mercury emissions from stationary coal combustion sources in China: Current status and recommendations. Environ. Pollut. 218:1209–21. doi:10.1016/j.envpol.2016.08.077.
- Kim, J. H., D. Pudasainee, Y. S. Yoon, S. U. Son, and Y. C. Seo. 2010. Studies on speciation changes and mass distribution of mercury in a bituminous coal-fired power plant by combining field data and chemical equilibrium calculation. Ind. Eng. Chem. Res. 49:5197–203. doi:10.1021/ie901361q.
- Krzyżyńska, R., Z. Szeliga, L. Pilar, K. Borovec, and P. Regucki. 2020. High mercury emission (both forms: Hg0 and Hg2+) from the wet scrubber in a full-scale lignite-fired power plant. Fuel 270:117491. doi:10.1016/j.fuel.2020.117491.
- Li, X., Y. Teng, K. Zhang, H. Peng, F. Cheng, and K. Yoshikawa. 2020. Mercury migration behavior from flue gas to fly ashes in a commercial coal-fired CFB power plant. Energies 13:1040. doi:10.3390/en13051040.
- Li, Z., X. Chen, W. Liu, T. Li, J. Chen, C. J. Lin, G. Sun, and X. Feng. 2019. Evolution of four-decade atmospheric mercury release from a coal-fired power plant in North China. Atmos. Environ. 213:526–33. doi:10.1016/j.atmosenv.2019.06.045.
- Lindberg, S. E., and W. J. Stratton. 1998. Atmospheric mercury speciation: Concentrations and behavior of reactive gaseous mercury in ambient air. Environ. Sci. Technol. 32:49–57. doi:10.1021/es970546u.
- Liu, Q., S. Yi, B. Yong, X. Xu, Y. Tian, and J. Lu. 2016. Characteristics of mercury emissions from a coal-fired power plant. J. Residuals Sci. Technol. 13:S175–S180. doi:10.1021/es970546u.
- Liu, S., J. Chen, Y. Cao, H. Yang, C. Chen, and W. Jia. 2019. Distribution of mercury in the combustion products from coal-fired power plants in Guizhou, southwest China. J. Air Waste Manage. Assoc. 69 (2):234–45. doi:10.1080/10962247.2018.1535461.
- Lusilao-Makiese, J., E. Tessier, D. Amouroux, H. Tutu, L. Chimuka, and E. M. Cukrowska. 2012. Speciation of mercury in South African coals. Toxicol. Environ. Chem. 94 (9):1688–706. doi:10.1080/02772248.2012.728604.
- Masoomi, I., H. Kamata, A. Yukimura, K. Ohtsubo, M. O. Schmid, and G. Scheffknecht. 2020. Investigation on the behavior of mercury across the flue gas treatment of coal combustion power plants using a lab-scale firing system. Fuel Process. Technol. 201:106340. doi:10.1016/j.fuproc.2020.106340.
- Niksa, S., and N. Fujiwara. 2005. A predictive mechanism for mercury oxidation on selective catalytic reduction catalysts under coal-derived flue gas. J. Air Waste Manage. Assoc. 55 (12):1866–75. doi:10.1080/10473289.2005.10464779.
- Pacyna, E. G., J. Pacyna, K. Sundseth, J. Munthe, K. Kindbom, S. Wilson, F. Steenhuisen, and P. Maxson. 2010. Global emission of mercury to the atmosphere from anthropogenic sources in 2005 and projections to 2020. Atmos. Environ. 44:2487–99.
- Pavlish, J. H., E. A. Sondreal, M. D. Mann, E. S. Olson, K. C. Galbreath, D. L. Laudal, and S. A. Benson. 2003. Status review of mercury control options for coal-fired power plants. Fuel Process. Technol. 82:89–165. doi:10.1016/S0378-3820(03)00059-6.
- Pirrone, N., S. Cinnirella, X. Feng, R. B. Finkelman, H. R. Friedli, J. Leaner, R. Mason, A. B. Mukherjee, G. B. Stracher, D. G. Streets, et al. 2010. Global mercury emissions to the atmosphere from anthropogenic and natural sources. Atmos. Chem. Phys. 10:5951–64.
- Pudasainee, D., S. J. Lee, S. H. Lee, J. H. Kim, H. N. Jang, S. J. Cho, and Y. C. Seo. 2010. Effect of selective catalytic reactor on oxidation and enhanced removal of mercury in coal-fired power plants. Fuel 89:804–09. doi:10.1016/j.fuel.2009.06.022.
- Slemr, F., W. Seiler, and G. Schuster. 1981. Latitudinal distribution of mercury over the Atlantic Ocean. J. Geophys. Res. 80:1159–66. doi:10.1029/JC086iC02p01159.
- Srivastava, R. K., N. Hutson, B. Martin, F. Princiotta, and J. Staudt. 2006. Control of mercury emissions from coal-fired electric utility boilers. Environ. Sci. Technol. 40 (5):1385–93. doi:10.1021/es062639u.
- Streets, D., J. Hao, Y. Wu, J. Jiang, M. Chan, H. Tian, and X. Feng. 2005. Anthropogenic mercury emissions in China. Atmos. Environ. 39 (40):7789–806. doi:10.1016/j.atmosenv.2005.08.029.
- Streets, D. G., M. K. Devane, Z. F. Lu, T. C. Bond, E. M. Sunderland, and D. J. Jacob. 2011. All-time releases of mercury to the atmosphere from human activities. Environ. Sci. Technol. 45 (24):10485–91. doi:10.1021/es202765m.
- Streets, D. G., Q. Zhang, and Y. Wu. 2009. Projections of global mercury emissions in 2050. Environ. Sci. Technol. 43:2983–88. doi:10.1021/es802474j.
- Su, S., L. Liu, L. Wang, S. S. A. Syed-Hassan, F. Kong, S. Hu, Y. Wang, L. Jiang, K. Xu, A. Zhang, et al. 2017. Mass flow analysis of mercury transformation and effect of seawater flue gas desulfurization on mercury removal in a full-scale coal-fired power plant. Energy Fuels 31:11109–16. doi:10.1021/acs.energyfuels.7b02029.
- Swaine, D. J., and F. Goodarzi. 1995. Environmental aspects of trace elements in coal, 23–28. Netherlands: Kluwer Academic Publishers.
- Taiwan Environmental Protection Administration, (Taiwan EPA) Executive Yuan. 2019, The project of emission investigation and reduction promotion plan for stationary sources of dioxin and heavy metals. EPA-105-FA12-03-A167.
- Takahisa, Y., and A. Kazuo. 2000. Mercury emissions from a coal fired power plant in Japan. Sci. Total Environ. 259 (1):97–103. doi:10.1016/S0048-9697(00)00552-0.
- Tang, N., and S. W. Pan. 2013. Study on mercury emission and migration from large-scale pulverized coal fired boilers. J. Fuel Chem. Technol. 41:484–90. doi:10.1016/S1872-5813(13)60026-2.
- Tang, S. L., L. Wang, X. B. Feng, Z. H. Feng, R. Y. Li, H. P. Fan, and K. Li. 2016. Actual mercury speciation and mercury discharges from coal-fired power plants in Inner Mongolia, Northern China. Fuel 180:194–204. doi:10.1016/j.fuel.2016.04.037.
- Thompson, J. S., J. H. Pavlish, L. L. Hamre, M. D. Jensen, D. Smith, S. Podwin, and L. A. Brickett. 2009. Sorbent injection into a slipstream baghouse for mercury control: Project summary. Fuel Process. Technol. 90:1392–99. doi:10.1016/j.fuproc.2009.06.016.
- U.S. EPA. 1994. Method 245.1: Determination of mercury in water by cold vapor atomic absorption spectrometry. Revision 3.0. Cincinnati, OH: Environmental Protection Agency.
- UNEP. 2013a. Global Mercury Assessment 2013: Sources, emissions, releases and environmental transport. Geneva, Switzerland: UNEP Chemicals Branch.
- UNEP News Centre website. Accessed October 2013b. http://www.unep.org/newscentre/default.aspx?DocumentID=2702&ArticleID=9373&l=zh.
- USEPA. 2007. Method 7473: Mercury in solids and solutions by thermal decomposition, amalgamation, and atomic absorption spectrophotometry. Washington, DC: United States Environmental Protection Agency.
- Wang, S. X., L. Zhang, G. H. Li, Y. Wu, J. M. Hao, N. Pirrone, F. Sprovieri, and M. P. Ancora. 2010. Mercury emission and speciation of coal-fired power plants in China. Atmos. Chem. Phys. 10:1183–92. doi:10.5194/acp-10-1183-2010.
- Wdowin, M., M. Macherzyński, R. Panek, J. Górecki, and W. Franus. 2015. Investigation of the sorption of mercury vapour from exhaust gas by an Ag-X zeolite. Clay Miner. 50 (1):31–40. doi:10.1180/claymin.2015.050.1.04.
- Wdowin, M., M. M. Wiatros-Motyka, R. Panek, L. A. Stevens, W. Franus, and C. E. Snape. 2014. Experimental study of mercury removal from exhaust gases. Fuel 128:451–57. doi:10.1016/j.fuel.2014.03.041.
- Wiatros-Motyka, M. M., C. Sun, L. A. Stevens, and C. E. Snape. 2013. High capacity coprecipitated manganese oxides sorbents for oxidative mercury capture. Fuel 109:559–62. doi:10.1016/j.fuel.2013.03.019.
- Wierzchowski, K., J. Checko, and I. Pyka. 2017. Variability of mercury content in coal matter from coal seams of the Upper Silesia Coal Basin. Arch. Min. Sci. 62 (4):843–56.
- Wilcox, J., E. Rupp, S. C. Ying, D. H. Lim, A. S. Negreira, A. Kirchofer, F. Feng, and K. Lee. 2012. Mercury adsorption and oxidation in coal combustion and gasification processes. Int. J. Coal Geol. 90-91:4–20. doi:10.1016/j.coal.2011.12.003.
- Yang, A., Z. Yan, R. Hui, Z. Shen, and K. Zhuang. 2015. The abundance, distribution, and modes of occurrence of Hg in Chinese coals. Sci. Technol. Eng. 15 (32):1671–815. (in Chinese).
- Yokoyama, T., K. Asakura, H. Matsuda, S. Ito, and N. Noda. 2000. Mercury emissions from a coal-fired power plant in Japan. Sci. Total Environ. 259:97–103.
- Yudovich, Y. E., and M. P. Ketris. 2005. Mercury in coal: A review. Part 1. Geochemistry. Int. J. Coal Geol. 62:107–34. doi:10.1016/j.coal.2004.11.002.
- Zhang, L., S. Wang, Y. Meng, and J. Hao. 2012. Influence of mercury and chlorine content of coal on mercury emissions from coal-fired power plants in China. Environ. Sci. Technol. 46:6385–92. doi:10.1021/es300286n.
- Zhang, L., S. Wang, Q. Wu, F. Wang, C. J. Lin, L. Zhang, M. Hui, M. Yang, H. Su, and J. Hao. 2016. Mercury transformation and speciation in flue gases from anthropogenic emission sources: A critical review. Atmos. Chem. Phys. 16:2417–33. doi:10.5194/acp-16-2417-2016.
- Zhang, S., Q. Zhang, Y. Zhao, J. Yang, Y. Xu, and J. Zhang. 2020. Enhancement of CeO2 modified commercial SCR catalyst for synergistic mercury removal from coal combustion flue gas. RSC Adv. 10:25325–38. doi:10.1039/D0RA04350H.
- Zhao, S., Y. Duan, L. Chen, Y. Li, T. Yao, S. Liu, M. Liu, and J. Lu. 2017b. Study on emission of hazardous trace elements in a 350 MW coal-fired power plant. Part 1. Mercury. Environ. Pollut. 229:863–70. doi:10.1016/j.envpol.2017.07.043.
- Zhao, S., Y. Duan, T. Yao, M. Liu, J. Lu, H. Tan, X. Wang, and L. Wu. 2017a. Study on the mercury emission and transformation in an ultra–low emission coal–fired power plant. Fuel 199:653–61. doi:10.1016/j.fuel.2017.03.038.
- Zhao, S., D. Pudasainee, Y. Duan, R. Gupta, M. Liu, and J. Lu. 2019. A review on mercury in coal combustion process: Content and occurrence forms in coal, transformation, sampling methods, emission and control technologies. Prog. Energy Combust. Sci. 73:26–64. doi:10.1016/j.pecs.2019.02.001.