
 ?Mathematical formulae have been encoded as MathML and are displayed in this HTML version using MathJax in order to improve their display. Uncheck the box to turn MathJax off. This feature requires Javascript. Click on a formula to zoom.
ABSTRACT
Air quality is a global challenge issue, and many regions of the world, such as India, are experiencing daunting challenges. An important aspect is to identify and then control the emissions from major contributing sources. To advance this aspect, this paper describes an air quality network that has been set up in the National Capital Territory of Delhi (NCT-Delhi) to identify major contributing source categories in real-time. The various components include an innovative cloud-based dashboard to compile the data in real-time from a series of PM instruments (Beta Attenuation Monitors (BAM)) and a low-cost sensor network (22 APT- MAXIMA sensors). Furthermore, at one of the locations (urban site), three real-time chemical speciation monitors are installed to provide elemental speciation (30 elements), elemental carbon (EC), and organic carbon (OC) data. PM2.5 concentrations at different sites (urban, industrial, and background) were compared to the BAM measurements over an 8-month period from May 2019 to February 2020; spanning the summer, monsoon, autumn, and winter seasons in Delhi. The APT sensor measurements were well correlated to the BAM measurements, with R2 values ranging between 0.84 and 0.95 for all sites. This validated that the APT-MAXIMA low-cost sensors can be a useful tool for distributed monitoring of PM2.5 levels. The mean PM2.5 concentrations showed a trend with winter (Dec, Jan, Feb: 205.2 ± 95.1 µg m−3) and autumn (Oct, Nov: 171.7 ± 128.3 µg m−3) highs and summer (May, Jun: 64.6 ± 57.2 µg m−3) and monsoon (Jul, Aug, Sep: 27.6 ± 16.7 µg m−3) lows. The bivariate polar plot reveals high PM2.5 levels originated from local/regional combustion sources located east and south-west of the urban site, especially when high PM2.5 episodes are encountered during the festival season and other smog episodes.
Implications: Low-cost sensors are useful for distributed monitoring under both low and high pollution conditions. A cloud-based dashboard system provided real-time, remote access to the data and in the visualization of air quality in the entire region. The real-time data availability on the cloud enabled establishing hot-spot regions of air pollution, spatial variation of PM2.5, real-time source apportionment, and health risk estimates to benefit both policy makers, and the general public.
Introduction
Fine particles (particulate matter with aerodynamic diameter less than 2.5 μm (PM)2.5) are a widely accepted integrated metric for the representation of air quality as it is correlated to adverse effects on climate change and human health (Apte et al. Citation2015; Bond et al. Citation2013; HEI Citation2019; Zhou et al. Citation2018). PM2.5 levels at a location result due to a contribution from multiple sources, and often contain a complex mixture of species such as elemental carbon (EC), organic matter (OM), water-soluble inorganic ions (WSIIs), and trace elements (Venkataraman et al. Citation2005). Accurate PM2.5 monitoring and data analytics is crucial for long-term assessment of health studies, source apportionment, evaluation of source emission control improvements, regulatory emission norms, and decision-making for the new policies.
A recent “IQAir AirViusal 2019 World Air Quality Report” (https://www.iqair.com/world-most-polluted-cities) has compiled a list of the 20 most polluted urban cities in South Asia, and 16 of these are cities in India. Delhi, the capital of India, is one of the most polluted urban cities in the world. This is due to a variety of local and regional sources such as vehicle tailpipe emissions, road dust, biomass burning, waste incineration, open waste burning (Plastics/trashes), and other small-scale industries contributing to the PM levels at different locations in Delhi (Chowdhury et al. Citation2019a; CPCB Citation2010; David et al. Citation2019; Pant et al. Citation2015; Tiwari et al. Citation2016; Venkataraman et al. Citation2018). Regional sources near Delhi are dominant in the winter and autumn season. The heterogeneity of these sources is dependent on location, PM emissions, chemical composition, and their sizes (Zikova et al. Citation2017). As a result of this daunting problem, regulatory bodies and government organizations have deployed a series of instruments based on the Federal Reference Method (FRM) and Federal Equivalent Method (FEM) for accurate and reliable air quality measurements in Delhi (NCAP, Citation2018). A total of 26 Continuous Ambient Air Quality Monitoring Stations (CAAQMS) have been set up to help improve air quality datasets and characterize the pollutants and their sources (http://www.dpccairdata.com).
Conventional FRM and FEM instruments have high capital and operating costs, require maintenance, and lack portability. Thus, such devices are not amenable to help provide an understanding of heterogeneous PM concentrations and do not provide adequate real-time spatio-temporal information. Such characteristics are desirable in larger urban cities, and especially in cities with poor air quality, such as Delhi. Several studies to establish spatio-temporal variations have been conducted (Srivastava et al. Citation2014, Li et al., Citation2020a); however, they are not complete in their conclusions due to the use of only a few instruments. Recently, however, there has been a proliferation in the use of PM sensors that offer advantages of low cost, compact size, and high portability (Sayahi, Butterfield, and Kelly Citation2019; Rai et al. Citation2017; Kumar et al. Citation2015; Kelly et al. Citation2017; Liu et al. Citation2017; Li et al., Citation2020a, Citation2020b; Sousan et al. Citation2016; Wang et al. Citation2015).
It should be noted that these devices need to be calibrated appropriately, and several groups have explained the deficiencies and limitations of low-cost sensors (Bulot et al. Citation2019; Li and Biswas Citation2017; Wang et al., Citation2015; Zhang, Marto, and Schwab Citation2018). Some of the studies have explored in depth the laboratory-based algorithms for inverting sensor data and extracting information on the aerosol size distribution (Li et al. Citation2018). Recent studies have demonstrated that PM sensors exhibit good linearity against reference instruments, showing promising potential for personal monitoring, and satellite monitoring with sensor networks (Wang et al. Citation2015a; Feenstra et al. Citation2019; Bulot et al. Citation2019; Li et al., Citation2020a). While sensors are beginning to be used, they offer great potential for deploying them as a network, cloud-based operation, and field calibration (Arroyo et al. Citation2019). These concepts are described in this paper, and a cloud-based approach is demonstrated in the city of Delhi. The objectives of this paper are: the deployment of a network of APT MAXIMA sensors with cloud-based data analytics; and setup of a dashboard for real-time data observation. The measurements from the PM sensors are compared to the FRM BAM network. Finally, the power of such networks is illustrated by analyzing spatio-temporal variations in the Delhi region.
Methods
The sensor network established in the city of Delhi and the cloud-based data collection system are described. A dashboard for real-time data analytics was developed to provide access to the results in real-time. Data analytics approaches are elucidated. A test plan for the study is developed.
Description of the study area
The National Capital Territory of Delhi (NCT-Delhi) is one of the world’s most populated metropolitan city with a population of around 19.0 million (11312 people/km2 in 2019; https://delhi.gov.in/). It is surrounded by the state of Haryana districts (Gurugram, Faridabad, Jhajjar, and Sonipat), and Uttar Pradesh districts (Ghaziabad, Noida). Delhi has experienced high PM levels over the last decades, especially during mid-October to mid-November (PM2.5 level >500 µg/m3) due to unfavorable meteorology as reported by Chowdhury et al. (Citation2019a) using an analysis of 15-year satellite datasets to estimate the PM2.5 level. NCT-Delhi experiences low rainfall (~600 mm), hot summers (mean temperature 34°C maximum 48°C in June), and cold winters (mean temperature 14°C and minimum 2°C in January) associated with dust storms and frequent temperature inversions. As per the Indian Meteorological Department (IMD), the climate of Delhi has classified four distinct seasons: winter [December, January, February], summer [March, April, May, June], monsoon [July, August, September], and autumn [October, November]. The classification of the season depends on temperature, rainfall, and geographical location in India, and the end of the season can different in any part of India.
APT low-cost sensor: specification and configuration
The sensor used in the study, APT MAXIMA (Figure S1, Supplementary Section), is developed by Applied Particle Technology (APT). The device is relatively small in size and placed in a weather protective box (dimension-5.12” ×3.92” ×2.75” cm; weight-317 g, USB cable supply, 3.7 V, 200 mA power). The device measures the temperature (T), pressure (P), relative humidity (RH) inside the sensor casing, which is used to monitor the ambient environment condition and particle concentration effectively. A fan draws a sample (~0.1 lpm) into the detection region of the optical sensor. The device consists of an optical block that measures the scattering signal at an angle of 90 degrees; and then bins the number concentration data in six size channels. For the concentration ranges of 0 ~ 100 μg m−3 and 100 ~ 500 μg m−3 uncertainties are ±10 μg m−3 and ±10%, respectively. Furthermore, the operating temperature and relative humidity (RH) ranges of the sensors are −10°C to 40°C and 0% to 99%, respectively. APT-MAXIMA sensors accomplish a stable laboratory performance as compared to EPA approved monitors (GRIMM and SidePak) at controlled temperature and humidity in a chamber study using three different types of aerosols-Arizona Road Dust [ARD], sea salt, and incense particles (Li et al., Citation2020b). The APT-Maxima has reported good linearity for these sources (R2 ranging between 0.94 and 0.98).
Sensor network and instrumentation
Twenty-four APT-MAXIMA cloud-based low-cost PM-sensors were distributed over Delhi at co-located beta-attenuation monitor (BAM, Ecotech, AECOM group, Australia) CAAQM stations of DPCC (). CAAQM stations were fully conditioned with temperature and RH, and BAM instruments were equipped with a heated tube to setting temperature and RH prior to PM sampling. All APT-MAXIMA sensors were mounted at a height of 10 m (~rooftop of CAAQMS) from the ground. The site characteristics features and location (latitude and longitude) are described in Table S1 in the supplementary information (SI). Twenty-four (24) APT-PM sensors were initially deployed starting May 2019, and two sensors, namely as MM and CL were not operated during field evaluation and data excluded from these sensors due to the unavailability of a co-located reference BAM instrument.
Figure 1. Locations of the APT low-cost sensor nodes co-located with reference BAM instruments (as indicated by the solid dots) in Delhi. For location abbreviation: refer to Table S1 in the supplementary information
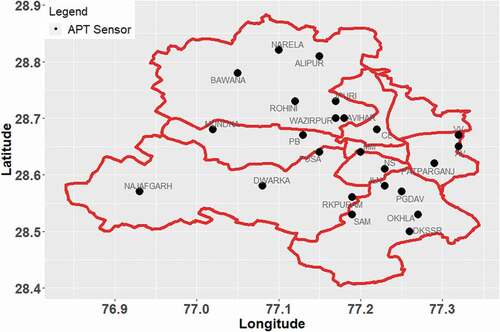
It is noteworthy that the Delhi-mapping sensor network is the third-largest network in Asia after Beijing and Hong Kong, and a first of its kind in India. While this is the first such study of a networked system, more of these need to be deployed and conducted in India. A typical urban site of Delhi, the Major Dhyan Chand National Stadium (onwards referred to as NS), New Delhi, was used for obtaining high-resolution PM2.5 chemical speciation data. The urban site is situated at the central part of Delhi, and it is 200 m away from ring-road toward India Gate and national highway (NH-44; Mathura road), and the site has an influence on local emission such as light-duty/heavy-duty vehicle activities. At the urban site, a real-time ambient multi-metals monitoring (Xact-625i; Cooper Environmental Services, Oregon, USA), a seven wavelengths Aethalometer (AE-33-7, Magee Scientific, USA), and a total carbon analyzer [TCA 08, Magee Scientific, Berkeley, USA] were installed to provide real-time elemental composition data, and EC/OC and TC data, respectively.
Cloud-based data storage and calibration & dashboard
The APT-sensor uses a local wi-fi signal to connect to the cloud-based data storage system. The units and firmware were operated with data collection every 30 seconds. Long-term evaluation of the APT-MAXIMA has also been carried out by the US Environmental Protection Agency showing consistent data quality (Barkjohn et al. Citation2020). For the calibration factors used in the current study, field calibration of APT-MAXIMA was done over a certain time of period at US Embassy in Delhi in 2018 (Chadha, Fang, and Biswas Citation2019), and based on a calibration scheme (Li et al., Citation2020b), values of PM mass concentration (PM1.0, PM2.5, and PM10) are reported. In this current study, an advanced algorithm for data inversion and calibration is hosted on the cloud. This algorithm incorporates the field calibration factor to compute PM2.5 which is further validated in this study. The cloud is accessible via the internet, and a dashboard displays the data for the user in a seamless manner. It should be noted that sensors are deployed at fixed location, therefore, static calibration factor is sufficient for complete datasets.
An interactive dashboard for real-time air quality data display and visualization for the NCT-Delhi region was developed and is under the purview of DPCC. The APT PM sensors data (PM10, PM2.5, and PM1.0) of 22 location site, the real-time chemical speciation instruments (Aethalometer, TCA analyzer, and Xact-625i) data can be viewed.
Study plan
Three different aspects a) inter-comparison of BAM and APT-MAXIMA data at three different sites; b) APT-MAXIMA data variation over seasons; and c) trend of PM2.5 concentrations in real-time at the urban site (NS, ) were studied. presents a summary of the tests conducted in chronological order.
Table 1. Summary of the test plan in the chronological order
The first part of the test plan focuses on the field comparison of APT-PM2.5 low-cost sensors and reference BAM-PM2.5 data at three different sites. The three different sites, Urban-National Stadium (NS); Industrial-Bawana; and Background-Najafgarh, were selected for the detailed assessment. These locations are also DPCC CAAQM stations and have an FRM BAM instrument (for PM2.5 and PM10) and weather station for meteorological parameter monitoring. The urban site [National Stadium] is influenced by local traffic sources, such as light-and heavy-duty vehicles. The industrial site (BAWANA) is close (~500 m) to industries, and there are about 700 small/medium scale facilities that are manufacturing rubber, plastic, and engineering items. The background site [NAJAFGRAH] has characteristics of low pollution and no highways or major roads within 1000 m of the sampling location.
The next set of tests evaluated the variation of APT sensor data over different seasons, and examining trends with meteorological parameters such as relative humidity, temperature, wind speed wind direction, and PM2.5/PM10 ratio. The last section of the test plan discusses the time-series, diurnal variation of APT PM2.5, and particle number count (PNC) at an urban site in Delhi for different seasons.
For the pre-analysis of PM2.5 data, a traditional method such as NAs, negative values, unceasing zero value, and outliers were considered. Outliers were removed based on summary statistics, and boxplot analysis. Some data points, such as PM2.5 > PM10, were also removed from consideration. The data points were averaged over 1-hr and harmonized by date and time to the hourly-resolved BAM PM2.5 data. The average hourly-resolved data points reduce the noise related to instrument/sensor error at 1-min or 30 s resolution data (Feenstra et al. Citation2019).
The linearity of response of the APT low-cost sensor data was assessed with reference to the BAM monitor data based on a regression analysis, where PM2.5 data from the BAM monitor and the APT MAXIMA low-cost sensor was considered as the independent and dependent variable, respectively. The root mean square error (RMSE) is used for observing measurement error, which is calculated with the similar manner of mean bias error (MBE) and mean absolute error (MAE). Additionally, accuracy is defined as the degree of confidence between the sensor and reference data points (Polidori, Papapostolou, and Zhang Citation2016):
where X is the mean concentration examined by the APT low-cost sensor, and R is the mean concentration monitored by the reference BAM monitors.
The temporal variation of APT PM2.5, BAM PM2.5, and particle number count (PNC) at the urban site (National Stadium, NS) of Delhi during summer, monsoon, autumn, and winter seasons of 2019–20 are compared and discussed. Diurnal variation and bivariate polar plot of PM2.5 are discussed. All statistical tests were conducted using R-3.5.1, with the packages ‘openair’, ‘ggplot2ʹ, ‘dplyr’, and ‘tidyverse.’
Results and discussion
Results for the development of the dashboard to display real-time data, inter-sensor-variability, descriptive statistics of PM2.5 monitored from APT low-cost sensors and BAM at three sites, linearity, and accuracy APT-PM sensors with BAM, and other influencing factors in the linearity of low-cost sensor, and trend of PM mass and number concentration in Delhi-NCT are presented.
Dashboard development for real-time data
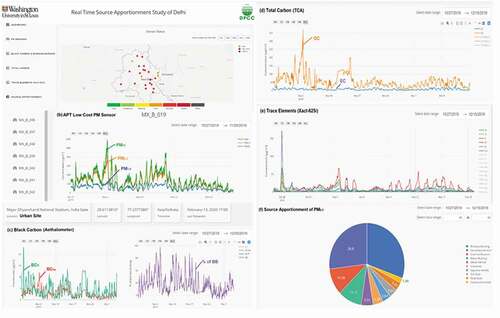
The objective of this paper is to demonstrate the setting up of a cloud-based networked PM sensor system, operating via a dashboard (Dashboard Citation2020). We illustrate the comparison of PM data from three representative sites in this paper, with data from 22 other sites available on the dashboard. The newly developed dashboard displays five kinds of real-time data containing (a) locations of all sensors/monitors; (b) APT MAXIMA PM sensors; (c) Black carbon; (d) Total carbon; (e) Trace elements. A screen capture of the dashboard link (http://delhi.appliedparticle.io/) is shown in ) illustrating the real-time AQI in the NCT-Delhi region. The AQI value is computed based on the low-cost sensor PM2.5 mass concentration following Central Pollution Control Board (CPCB Citation2010) guidelines. The real-time trend of PM1.0, PM2.5, and PM10 of APT MAXIMA data at 24-locations is shown in ) (clickable on the online dashboard site). The screen-shot ()) displays real-time data of black carbon (BC) from the aethalometer; real-time data of total carbon (TC) ()) from the TCA-analyzer, and ) illustrates the real-time trace element concentration. The dashboard is a one-stop online location where comprehensive air quality sensor data is displayed, allowing the identification of hot-spot regions in Delhi. Trends of PM2.5 and their chemical constituents (BC, OC, and trace elements) are also reported in real-time for the first time for the NCT-Delhi region. The ultimate goal is to use the cloud-based system to perform real-time source apportionment analysis to help policymakers identify major contributing sources and allow for robust action to help remediate air pollution scenarios (see )).
Figure 2. Newly developed dashboard for real-time online for data transmission and data visualization. (a) Main dashboard, (b) APT Low-cost PM sensor data (c) Black Carbon concentrations, (d) Total carbon concentrations, (e) Trace Elemental concentrations, and (f) Source apportionment of PM2.5.
Inter-sensor-variability by co-location studies
The inter-sensor variability of two different APT-MAXIMA units at the same location (NS) was established. The PM sensor collects data every 30 s for mass concentration (PM1.0, PM2.5, and PM10) and number concentrations in six channels. This data (PM1.0, PM2.5, PM10, and particle number count (PNC) was averaged over a 1-min period for the two sensors (referred to as S1-APT and S2-APT) (). A scatter plot of the data from the two co-located sensors (S1 and S2) for the PM mass and PNC are shown in . There was a good degree of high correlation (R2 = 0.96–0.98, with a slope of 0.94), with a high inter-sensor variability of about 3.2%, with a standard error of ±1.0.
Figure 3. Inter-sensor variability for two co-located APT MAXIMA low-cost PM sensors (S1 and S2) deployed at the urban site (NS, National Stadium) of Delhi. Scatter plot of 1-min resolution (a) PM1.0; (b) PM2.5; (c) PM10; and (d) particle number count (PNC). R2 and slope were estimated by linear regression
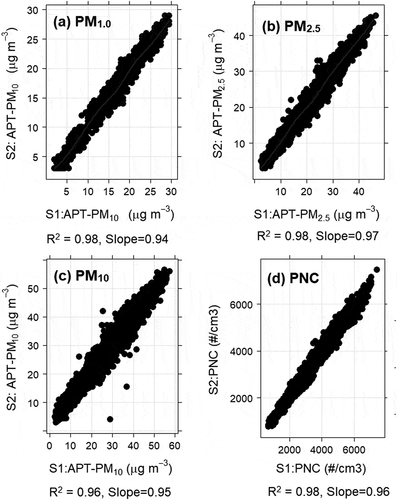
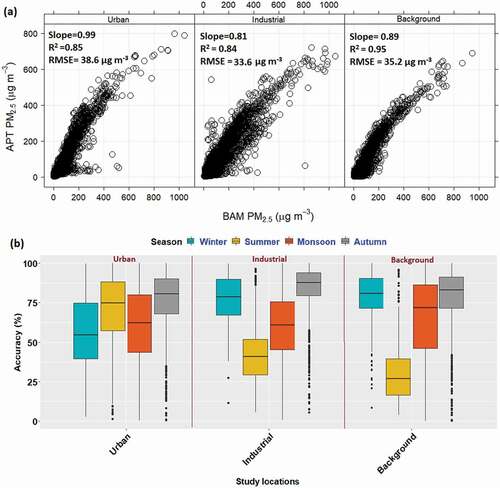
Figure 4. (a) Linearity or regression analysis for 1-hour average of data from APT sensor and BAM PM2.5 values at three different sites of Delhi city: urban site, NS (n = 5199); industrial site, BAWANA (n = 5268); background site, NAJAFGARH (n = 3475) during the year 2019, (b) accuracy analysis of the APT PM2.5 concentrations at urban, industrial, background site with BAM PM2.5 concentrations during four different seasons
Comparison of PM2.5 from APT sensor and BAM monitors
PM concentration data at three different locations – urban, industrial, and background sites of Delhi, over four-different seasons (Summer, Monsoon, Autumn, and Winter) were compared. A summary statistics of APT sensor PM2.5, BAM PM2.5, meteorological parameters (temperature, relative humidity, wind speed, solar radiation), and seasonal wind roses are shown in Table S2 and Figure S2 in the SI. Discrepancies in meteorological parameters, such as temperature, relative humidity, wind speed, and solar radiation, have impacts on physical and chemical processes in the atmosphere, which impacts the resultant particulate mass and number concentrations.
The linearity of the response between APT low-cost sensors and co-located reference BAM monitors at three different sites was performed using regression analysis, and determination of the Pearson correlation coefficients. Data points were taken over the ten-month period (01 May 2019–15 February 2020). Linear regression was performed between hourly APT-PM2.5 and BAM-PM2.5 data, and the results are presented in . The results illustrated that a high degree of association between APT-sensor and BAM-monitor data for the urban, industrial, and background sites, respectively. At the urban site, the APT low-cost sensor revealed statistically significant (p < .05) good association between APT-PM2.5 and BAM-PM2.5 with a slope = 0.99 and root mean square error (RMSE) of 38.6 µg m−3. At the industrial site, the two methods demonstrated a good correlation with slope = 0.81 and RMSE = 53.9 µg m−3. At the background site, the APT low-cost sensors had a high correlation (R2 = 0.99, slope = 0.95, and RMSE = 35.3 µg m−3) with the BAM during the sampling period. APT-PM2.5 and BAM-PM2.5 data accuracy at the three sites harmonized over the various seasons is shown in . The box plot demonstrates moderate to satisfactory data accuracy (58% to 85%) in the autumn and winter seasons, while 30% to 75% data were harmonized between APT-PM2.5 and BAM-PM2.5 values during the summer and monsoon seasons. Among the three sites, the urban site was found to have good data accuracy as compared to the industrial and background locations. The APT low-cost sensors showed high fidelity to local environments during autumn and winter when many significant episodical events such as Diwali and high smog occurred. It should be noted that the sensor calibration is impacted by varying relative humidity, temperature, and variability of characteristics of PM2.5 (coming from different sources). The impact of these co-founding factors was evaluated for impacting the performance of the APT MAXIMA low-cost sensors and discussed in the next section.
Co-founding factors influencing the linearity of APT sensor data
In order to evaluate the influence of other co-founding factors, the PM2.5 concentrations of low-cost sensors and BAM monitors were compared over various seasons, RH, temperature, wind speed, wind direction values. The PM2.5/PM10 ratio was calculated, and trends were discussed. depicts the whisker box plots of the Pearson correlation coefficients between the low-cost sensors and the BAM monitors at the urban, industrial, and background sites, with varying months, meteorological parameters, and PM2.5/PM10 ratio.
Figure 5. Factors influencing the correlation of APT low-cost sensor and reference BAM monitors at urban, industrial, and background sites during the sampling period of 01 May 2019 to 15 February 2020. Figures illustrates Pearson coefficient for PM2.5 between sensors and reference BAM monitors at the sites with (a) seasons, (b) quartile range of relative humidity (RH), (c) wind direction, (d) quartile range of temperature, (e) quartile range of wind speed, (f) range of PM2.5/PM10 ratio. Box-plot represents mean (red dash line), median (solid black), 25th percentile, 75th percentile, minimum, and maximum of Pearson coefficient
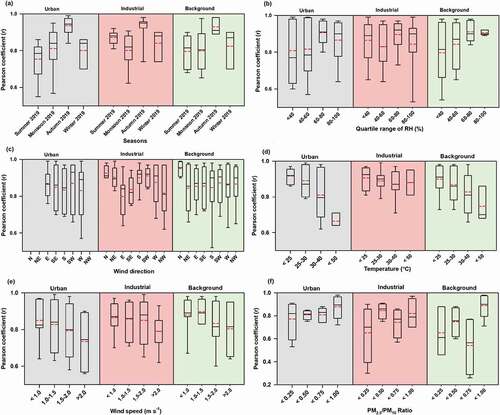
Seasons: APT MAXIMA sensors revealed good linearity (r = >0.8 for all sites) with BAM during the autumn and winter seasons compared to the summer and monsoon seasons (r = ~0.72). However, during the monsoon season, a substantial drop in correlation (~0.68–0.70) was observed due to other environmental factors such as RH, and possibly due to rainfall.
Relative humidity: To examine the effects of relative humidity (RH), box-plots of the Pearson correlation coefficient by varying quartile range of RH (in % <40, 40–60, 60–80, and 80–100) were analyzed. Among sites, there was no significant difference in the Pearson coefficient between first quartile (Q1) and second quartile (Q2) range of RH (<40 and 40–60%), while correlation enriched in the third quartile (Q3) and upper quartile (Q4). Interestingly, the APT sensor favored high variabilities in the Pearson coefficient at urban, industrial, and background sites after varying third quartile (Q3) of RH. It was noted that high RH (80–100%) resulted in a high correlation (r = 0.90) at the urban, industrial, and background sites. Overall, the linearity of APT sensors is strongly dependent on RH, as also reported in previous studies (Crilley et al. Citation2019; Feinberg et al. Citation2019; Sayahi, Butterfield, and Kelly Citation2019; Wang et al. Citation2015a). However, Jiao et al. (Citation2016) observed minimal effect of RH on the linearity of the low-cost sensors, while Jayaratne et al. (Citation2018) explained that the sensor over estimated PM2.5 concentrations at high RH. Bulot et al. (Citation2019) recommended that deviation of sensor performance can depend on the variation of RH due to following reasons: a) sensor has no system for drying the particles, (b) growth of particles in high RH, (c) change of the optical properties of particles. Therefore, the advance correction algorithm should be anticipated based on ambient data (temperature, RH, wind speed, and particle composition) during the field calibration, not only to correct RH using regression model or machine learning technique for sensor data points (Di Antonio et al. Citation2018; Feenstra et al. Citation2019), While this was not done in this study, the cloud-based data analytics system set up in this network can readily alter and use appropriate calibration factors for varying conditions.
Wind direction: The Pearson coefficients between APT-sensor and BAM with varying different wind directions are shown in . For the sites, the wind is blowing mostly from the east (E), north-east (NE), south-east (SE), south-west (SW), west (W), and south (S) direction. The APT-sensor showed no significant variations (p < .05) in the Pearson correlation coefficient at the urban site, while the other two sites (industrial and background) showed variation of the correlation coefficient with wind direction. In autumn and winter season, the dominant wind direction was south-west (SW), and north-west (NW) for urban, industrial, and background sites, and the Pearson coefficient was found to be rurban = 0.87; rindustrial = 0.82; and rbackground = 0.87, respectively.
Temperature: The correlation between APT sensors and BAM was higher at first and second quartile of temperature, while the third and fourth quartile of temperature showed a drop-in correlation with more variability [see ]. Remarkably, no significant difference in mean association with varying quartile range of temperature was observed at the industrial site.
Wind speed: For examining the impact of wind speed on sensor linearity, Pearson correlations against BAM are shown in ) for all the sites. At low wind speed, a good association was seen at urban, industrial, and background sites, while urban and background sites dropped in association at high winds. The possible reason could be more dispersion of the air pollutants resulting in high variability observed within BAM and APT sensor PM2.5 data points at high wind speed.
PM2.5/PM10 ratio: The objective was to show the variation of the PM2.5/PM10 ratio for identifying dominant sources of coarse and fine particles. At the urban site, good correlation (r = 0.82) was observed when the PM2.5/PM10 ratio is less than 0.25, with a substantial increase in the association for PM2.5/PM10 ratios between 0.5 and 1. This indicates that urban site has mixed sources such as soil/road dust and combustion emission. Insignificant variation in the correlation was observed for varying PM2.5/PM10 ratios at the industrial and background site, confirming that fine particle and dust source do not affect the linearity of the APT sensor-BAM data. Other factors such as degradation of the electronic components and altering fan speeds due to dust accumulation are not studied in this work. However, these factors could be very important and need to be evaluated for long-term studies, especially during the summer due to higher concentrations of dust particles. It was found that routine maintenance was necessary, and this helped in the accurate performance of the APT-MAXIMA sensors.
Trend of PM2.5 and particle number concentration (PNC) in Delhi
summarizes the time-series of APT sensor PM2.5, BAM PM2.5, and particle number concentration (PNC) (top panel), diurnal variation of PM2.5 (middle panel), and bi-variate plot of PM2.5 (bottom panel) at the urban (NS) site. The highest APT sensor PM2.5 mean concentration was observed in winter 205.2 (48.6–396) µg m−3, followed by autumn 171.7 (18.6–796.2) µg m−3, and summer 52.1 (3.3–443.6) and monsoon 44.2 (1.7–148.9) µg m−3, respectively. All reference BAM monitors measured higher concentrations of PM2.5 compared to the APT-MAXIMA sensors (, middle panel). However, the higher time resolution of 30 s of the APT-MAXIMA sensors was averaged and compared to the hourly values of the BAM are to be noted. The high episodic peaks of PM2.5 were observed on 27–28 October (during Diwali fireworks), 03 November (high pollution), 12–15 November (during odd/even trials) compared to winter (1–15 December 2019). Additionally, the mean PM2.5/PM10 ratios were found to be 0.35 ± 0.10 in summer season at the urban site, which indicates that coarse particles are more prevalent in the summer season, possibly due to enhanced soil resuspension dust. However, the high pollution level of PM2.5 in the autumn/winter season and high PM2.5/PM10 ratio (0.80 ± 0.11) clear indicates the sources are combustion type sources with fresh new particle formation. A similar PM2.5 and episodic particle number concentration (PNC) trend was observed. The average PNC for winter and autumn was found 34.4 × 10³ # cm−3 and 28.7 × 10³ # cm−3, respectively, and significantly (p < .05) higher (3 to 4 times) compared to the monsoon and summer seasons. This clearly indicates that these high PNC emitted from freshly emitted or aged particles in the local atmosphere during winter and autumn season.
Figure 6. Trend of PM in Delhi: (a) top panel: time series plot of APT sensor PM2.5, BAM PM2.5, and PNC at the urban site of Delhi during sampling period from May 2019 to February 2020, (b) middle panel: diurnal variation of PM2.5 in different season at urban site, (c) bottom panel: Bi-variate plots of wind speed, wind direction compared to PM2.5 in different seasons at the urban site
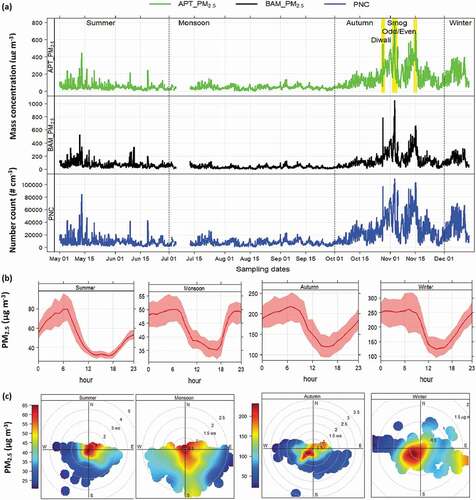
Among seasons, the diurnal variation of PM2.5 indicated that highest values were observed before and after 6 AM and 6 PM, and typically declined in the afternoon (12 PM to 6 PM). Interestingly, during the winter season, the minimum PM2.5 level was 130.4 µg m−3, which reached a maximum level of 250.2 µg m−3 during the nighttime (probably due to biomass combustion by people to stay warm). The autumn season resulted in the lowest concentration of PM2.5 (125.2 µg m−3) during the day-time and reached 226.2 µg m−3 during the nighttime (). It should be noted that during summer and monsoon, the nighttime peak concentrations of PM2.5 were 80.1 and 50.0 µg m−3, and the day-time peak concentration was in the range of 30.0 to 35.0 µg m−3. The increasing trend in PM2.5 levels between late night and early morning (00:00 to 06:00 IST) was observed, and it is probably due to increased heavy-duty diesel vehicle traffic use, and also due to low wind speed and dispersion. In contrast, during the autumn and winter seasons, nighttime PM2.5 concentrations most likely originated from biomass burning and local burning.
Meteorological factors can influence PM concentrations and their physical, chemical, and optical properties (S. Kumar and Sunder Raman Citation2016). Therefore, to examine the influence of local sources near the sampled locations, the conditional bivariate probability function (CBPF) or bivariate plots were prepared using the R package in R-studio (version 3.1.1; R Core Team, 2014) statistical software (Carslaw and Ropkins Citation2012). The threshold criterion value of PM2.5 concentrations was chosen as the 75th percentile, similar to that reported by Carslaw and Ropkins (Citation2012). The CPBF represents relative information of species concentration as a function of wind speed and direction. This approach is used to identify the location of the sources and also distinguish between two sources from the same wind direction. The highest PM2.5 values are associated with moderate to low wind speeds (<1 m s−1) from north-east (NE), south (S), south-west (SW) directions for the summer, monsoon, autumn, and winter seasons. This indicates a clear dominance of soil/road dust or coarse dust during the summer season, and local combustion sources near the sites also influence the sampling locations.
Conclusions
A first of its kind – a cloud-based low-cost sensor network system with chemical speciation monitors in Delhi city was set up. A dashboard was designed to display in real-time the data from 22 APT-MAXIMA PM sensors and PM2.5 chemical speciation monitors. The cloud-based system and dashboard provide the potential to conduct real-time source apportionment in the region and precisely identify hot-spot locations of high air pollution. The availability of this system will help local authorities and the government to help remediate air pollution episodes. It is also an effective tool to inform the public of spatio-temporal variations of air pollutants in the region. While the PM sensors were collocated with the BAM instruments in this study, due to its lower cost and ease of use, a much larger number of sensors (such as the APT-MAXIMA) could be deployed in an urban region to obtain better estimates of air pollution episodes and source detection. While not discussed in this study, wearable sensors (such as APT-MINIMA) could also be deployed for a better estimation of exposure (Do et al. Citation2020).
Three sites (urban, industrial, and background site) were used for field evaluation of the APT-MAXIMA low-cost sensors with reference BAM monitors. Overall, inter-sensor comparisons indicated high R2 values (greater than 0.97). A high degree of linearity of APT sensors with BAM PM2.5 was observed (0.84–0.95) over the different seasons, with the lowest accuracy found during the monsoon season. The other co-founding factors such as temperature, wind speed, season, and PM sources were discussed relative to the linearity of the APT and BAM data, and the results indicate the importance of the use of field calibration algorithms. Further, long-term field evaluation with co-located sensors is needed to resolve the variability with temperature and RH. Overall, the APT-MAXIMA low-cost sensors are relevant for low and high pollution conditions in a large urban city like Delhi, and they provide beneficial information on trends of spatial-temporal PM mass and number concentrations. The proposed network with cloud data storage and analytics can be used with the chemical speciation data to do real-time source apportionment, and help in robust policy application for improving the local air quality.
Supplemental Material
Download MS Word (1.5 MB)Acknowledgments
This work is supported by a grant from the Delhi Pollution Control Committee (DPCC) Government of Delhi-NCT (Delhi Air Quality Project 365-295620). The authors would like to acknowledge Hon’ble, Chief Minister: Sh. Arvind Kejriwal and Deputy Chief Minister: Manish Sisodia, for their help and support in the execution of this project. The authors would like to thank other members of DPCC for help in the deployment of the sensors, installation of chemical speciation monitors, and providing access to the data from the BAM monitors.
Supplementary material
Supplemental data for this paper can be accessed on the publisher’s website.
Additional information
Funding
Notes on contributors
Jai Prakash
Jai Prakash, is a visiting research scientist in Aerosol and Air Quality Research Laboratory at the Department of Energy, Environmental and Chemical Engineering, Washington University in St. Louis, St Louis, MO, USA. He received his PhD in Civil Engineering from the Indian Institute of Technology, Delhi.
Shruti Choudhary
Shruti Choudhary, is a graduate student within the Aerosol and Air Quality Research Laboratory at the Department of Energy, Environmental and Chemical Engineering, Washington University in St. Louis, St Louis, MO, USA. Choudhary’s research concentrates on development of low-cost sensors.
Ramesh Raliya
Ramesh Raliya, is a research scientist in Aerosol and Air Quality Research Laboratory at the Department of Energy, Environmental and Chemical Engineering.Washington University in St. Louis, St Louis, MO, USA. Ramesh Raliya’s research expertise is in the product and technology development with the aim of reducing fertilizer runoff while improving sustainable agriculture.
Tandeep S. Chadha
Tandeep S. Chadha, is a Co-founder and CTO of Applied Particle Technology Inc. St. Louis, USA. He received his Ph.D. from the Department of Energy, Environmental and Chemical Engineering, from Washington University in St. Louis, St Louis, MO, USA.
Jiaxi Fang
Jiaxi Fang, is a Co-founder and CEO of Applied Particle Technology Inc. St. Louis, USA. He received his Ph.D. from the Department of Energy, Environmental and Chemical Engineering, from Washington University in St. Louis, St Louis, MO, USA.
M.P. George
M.P. George, is a scientist in Delhi Pollution Control Committee, Delhi, India.
Pratim Biswas
Pratim Biswas, is currently the Dean of Engineering, University of Miami, since 2021. Prior to this he was the Lucy and Stanley Lopata Professor and Assistant Vice Chancellor for International Programs, and Chair of the Department of Energy, Environmental and Chemical Engineering at Washington University in St. Louis. He was elected to the United States National Academy of Engineering in 2019.
References
- Apte, J. S., J. D. Marshall, A. J. Cohen, and M. Brauer. 2015. Addressing global mortality from ambient PM 2.5. Environ. Sci. Technol. 49:8057–8066. doi:https://doi.org/10.1021/acs.est.5b01236.
- Arroyo, P., J. L. Herrero, J. I. Suárez, and J. Lozano. 2019. Wireless sensor network combined with cloud computing for air quality monitoring. Sensors (Switzerland) 19 (3):3. doi:https://doi.org/10.3390/s19030691.
- Barkjohn, K., C. Johnson, S. Frederick, R. Yaga, B. Thomas, W. Schoppman, and A. Clements. 2020. Yearlong performance of six PM air sensor models across seven U.S. sites. In American Association of Aerosol Research.
- Bond, T. C., S. J. Doherty, D. W. Fahey, P. M. Forster, T. Berntsen, B. J. Deangelo, M. G. Flanner, M. G., Ghan, S., Kärcher, B., Koch, et al. 2013. Bounding the role of black carbon in the climate system: A scientific assessment. J. Geophys. Res. Atmos. 118 (11):5380–552. doi:https://doi.org/10.1002/jgrd.50171.
- Bulot, F. M. J., S. J. Johnston, P. J. Basford, N. H. C. Easton, M. Apetroaie-Cristea, G. L. Foster, A. K. R. Morris, S. J. Cox, and M. Loxham. 2019. Long-term field comparison of multiple low-cost particulate matter sensors in an outdoor urban environment. Sci. Rep. 9(1):1–13. Springer US. doi:https://doi.org/10.1038/s41598-019-43716-3.
- Carslaw, D., and K. Ropkins. 2012. The openair manual - an R package for air quality data analysis. Environ. Model. Softw. 27-28:52–61. doi:https://doi.org/10.1016/j.envsoft.2011.09.008.
- Chadha, T., J. Fang, and P. Biswas. 2019. Preliminary report low cost, high quality sensor deployment and comparison.
- Chowdhury, S., S. Dey, L. Di Girolamo, K. R. Smith, A. Pillarisetti, and A. Lyapustin. 2019a. Tracking ambient PM 2.5 build-up in Delhi National Capital Region during the dry season over 15 years using a high-resolution (1 km) satellite aerosol dataset. Atmos. Environ. 204:142–50. Elsevier Ltd. doi:https://doi.org/10.1016/j.atmosenv.2019.02.029.
- Chowdhury, S., S. Dey, S. Guttikunda, A. Pillarisetti, K. R. Smith, and L. Di Girolamo. 2019b. Indian annual ambient air quality standard is achievable by completely mitigating emissions from household sources. PNAS 116 (22):10711–16. doi:https://doi.org/10.1073/pnas.1900888116.
- CPCB. 2010. Central pollution control board, air quality monitoring, emission inventory and source apportionment study for Indian cities, national summary report the central pollution control board, New Delhi, India.
- Crilley, L. R., A. Singh, L. J. Kramer, M. D. Shaw, M. S. Alam, J. S. Apte, W. J. Bloss, W. J., Ruiz, L. H., Fu, P., Fu, et al. 2019. Effect of aerosol composition on the performance of low-cost optical particle counter correction factors. Atmos. Chem. Phys. Discuss. (October): 1–21. doi:https://doi.org/10.5194/amt-2019-370.
- Dashboard. 2020. Applied particle technology Delhi data system. http://delhi.appliedparticle.io/; User name: user1; password: Brookings#63130
- David, L. M., A. R. Ravishankara, J. K. Kodros, J. R. Pierce, C. Venkataraman, and P. Sadavarte. 2019. Premature mortality due to PM 2.5 over India: Effect of atmospheric transport and anthropogenic emissions. GeoHealth 3(1):2–10. John Wiley and Sons Inc. doi:https://doi.org/10.1029/2018GH000169.
- Di Antonio, A., O. Popoola, B. Ouyang, J. Saffell, and R. Jones. 2018. Developing a relative humidity correction for low-cost sensors measuring ambient particulate matter. Sensors 18 (9):2790. doi:https://doi.org/10.3390/s18092790.
- Do, K., H. Yu, J. Velasquez, M. Grell-Brisk, H. Smith, and C. E. Ivey. 2020. A data-driven approach for characterizing community scale air pollution exposure disparities in Inland Southern California. J. Aerosol Sci. (August):105704. Elsevier Ltd. doi:https://doi.org/10.1016/j.jaerosci.2020.105704.
- Feenstra, B., V. Papapostolou, S. Hasheminassab, H. Zhang, B. Der Boghossian, D. Cocker, and A. Polidori. 2019. Performance evaluation of twelve low-cost PM2.5 sensors at an ambient air monitoring site. Atmos. Environ. 216(November):116946. Elsevier Ltd. doi:https://doi.org/10.1016/j.atmosenv.2019.116946.
- Feinberg, S. N., R. Williams, G. Hagler, J. Low, L. Smith, R. Brown, D. Garver, M. Davis, M. Morton, J. Schaefer, et al. 2019. Examining spatiotemporal variability of urban particulate matter and application of high-time resolution data from a network of low-cost air pollution sensors. Atmos. Environ. 213(May):579–84. Elsevier. doi:https://doi.org/10.1016/j.atmosenv.2019.06.026.
- HEI. 2019. A special report on global exposure to air pollution and its disease burden.
- Jayaratne, R., X. Liu, P. Thai, M. Dunbabin, and L. Morawska. 2018. The influence of humidity on the performance of a low-cost air particle mass sensor and the effect of atmospheric fog. Atmos. Meas. Tech. 11 (8):4883–90. doi:https://doi.org/10.5194/amt-11-4883-2018.
- Jiao, W., G. Hagler, R. Williams, R. Sharpe, R. Brown, D. Garver, R. Judge, M. Caudill, J. Rickard, M. Davis, et al. 2016. Community Air Sensor Network (CAIRSENSE) project: Evaluation of low-cost sensor performance in a suburban environment in the southeastern United States. Atmos. Meas. Tech. 9 (11):5281–92. doi:https://doi.org/10.5194/amt-9-5281-2016.
- Kelly, K. E., J. Whitaker, A. Petty, C. Widmer, A. Dybwad, D. Sleeth, R. Martin, and A. Butterfield. 2017. Ambient and laboratory evaluation of a low-cost particulate matter sensor. Environ. Pollut. 221:491–500. doi:https://doi.org/10.1016/j.envpol.2016.12.039.
- Kumar, P., L. Morawska, C. Martani, G. Biskos, M. Neophytou, S. Di Sabatino, M. Bell, L. Norford, and R. Britter. 2015. The rise of low-cost sensing for managing air pollution in cities. Environ. Int. 75:199–205. Elsevier Ltd. doi:https://doi.org/10.1016/j.envint.2014.11.019.
- Kumar, S., and R. Sunder Raman. 2016. Inorganic ions in ambient fine particles over a National Park in Central India: Seasonality, dependencies between SO42−, NO3−, and NH4+, and neutralization of aerosol acidity. Atmos. Environ. 143:152–63. doi:https://doi.org/10.1016/j.atmosenv.2016.08.037.
- Li, J., H. Li, Y. Ma, Y. Wang, A. A. Abokifa, C. Lu, and P. Biswas. 2018. Spatiotemporal distribution of indoor particulate matter concentration with a low-cost sensor network. Build. Environ. 127 (January):138–47. doi:https://doi.org/10.1016/j.buildenv.2017.11.001.
- Li, J., H. Zhang, C.-Y. Chao, C.-H. Chien, C.-Y. Wu, C. H. Luo, L.-J. Chen, and P. Biswas. 2020a. Integrating Low-cost air quality sensor networks with fixed and satellite monitoring systems to study ground-level PM2.5. Atmos. Environ. 223(January):117293. Elsevier Ltd. doi:https://doi.org/10.1016/j.atmosenv.2020.117293.
- Li, J., and P. Biswas. 2017. Optical characterization studies of a low-cost particle sensor. Aerosol Air Qual. Res. 17 (7):1691–704. doi:https://doi.org/10.4209/aaqr.2017.02.0085.
- Li, J., S. K. Mattewal, S. Patel, and P. Biswas. 2020b. Evaluation of nine low-cost-sensor-based particulate matter monitors. Aerosol Air Qual. Res. 20 (2):254–70. doi:https://doi.org/10.4209/aaqr.2018.12.0485.
- Liu, D., Q. Zhang, J. Jiang, and D.-R. Chen. 2017. Performance calibration of low-cost and portable particular matter (PM) sensors. J. Aerosol Sci. 112(October):1–10. Pergamon. doi:https://doi.org/10.1016/j.jaerosci.2017.05.011.
- NCAP. 2018. National clean air programme,ministry of environment, forest & climate change.
- Pant, P., A. Shukla, S. D. Kohl, J. C. Chow, J. G. Watson, and R. M. Harrison. 2015. Characterization of ambient PM 2. 5 at a pollution hotspot in New Delhi, India and inference of sources. Atmos. Environ. 109:178–89. Elsevier Ltd. doi:https://doi.org/10.1016/j.atmosenv.2015.02.074.
- Polidori, A., V. Papapostolou, and H. Zhang. 2016. Laboratory evaluation of low-cost air quality sensors, no. August.
- Rai, A. C., P. Kumar, F. Pilla, A. N. Skouloudis, S. Di Sabatino, C. Ratti, A. Yasar, and D. Rickerby. 2017. End-user perspective of low-cost sensors for outdoor air pollution monitoring. Sci. Total Environ. 607–608(December):691–705. Elsevier. doi:https://doi.org/10.1016/j.scitotenv.2017.06.266.
- Sayahi, T., A. Butterfield, and K. Kelly. 2019, February. Long-term field evaluation of the plantower PMS low-cost particulate matter sensors. Environ. Pollut. 245:932–40. Elsevier Ltd. doi: https://doi.org/10.1016/j.envpol.2018.11.065.
- Sousan, S., K. Koehler, L. Hallett, and T. M. Peters. 2016. Evaluation of the Alphasense Optical Particle Counter (OPC-N2) and the Grimm Portable Aerosol Spectrometer (PAS-1.108). Aerosol Sci. Technol. 50(12):1352–65. Taylor & Francis. doi:https://doi.org/10.1080/02786826.2016.1232859.
- Srivastava, P., S. Dey, P. Agarwal, and G. Basil. 2014. Aerosol characteristics over Delhi national capital region: A satellite view. Int. J. Remote Sens. 35 (13):5036–52. doi:https://doi.org/10.1080/01431161.2014.934404.
- Tiwari, S., U. C. Dumka, D. G. Kaskaoutis, K. Ram, A. S. Panicker, M. K. Srivastava, S. Tiwari, S. D. Attri, V. K. Soni, and A. K. Pandey. 2016. Aerosol chemical characterization and role of carbonaceous aerosol on radiative effect over Varanasi in Central Indo-Gangetic Plain. Atmospehric Environ. 125:437–49.
- Venkataraman, C., G. Habib, A. Eiguren-Fernandez, A. H. Miguel, and S. K. Friedlander. 2005. Residential Biofuels in South Asia: Carbonaceous aerosol emissions and climate impacts. Science (80-.). 307 (5714):1454–56. doi:https://doi.org/10.1126/science.1104359.
- Venkataraman, C., M. Brauer, K. Tibrewal, P. Sadavarte, Q. Ma, A. Cohen, S. Chaliyakunnel, J. Frostad, Z. Klimont, R. V. Martin, et al. 2018. Source influence on emission pathways and ambient PM2.5 pollution over India (2015–2050). Atmos. Chem. Phys. 18(11):8017–39. Copernicus GmbH. doi:https://doi.org/10.5194/acp-18-8017-2018.
- Wang, Y., J. Li, H. Jing, Q. Zhang, J. Jiang, and P. Biswas. 2015. Laboratory evaluation and calibration of three low-cost particle sensors for particulate matter measurement. Aerosol Sci. Technol. 49 (11):1063–77. doi:https://doi.org/10.1080/02786826.2015.1100710.
- Zhang, J., J. P. Marto, and J. J. Schwab. 2018. Exploring the applicability and limitations of selected optical scattering instruments for PM mass measurement. Atmos. Meas. Tech. 11 (5):2995–3005. doi:https://doi.org/10.5194/amt-11-2995-2018.
- Zhou, S., P. K. Davy, M. Huang, J. Duan, X. Wang, Q. Fan, M. Chang, Y. Liu, W. Chen, S. Xie, et al. 2018. High-resolution sampling and analysis of ambient particulate matter in the Pearl River Delta Region of Southern China: Source apportionment and health risk implications. Atmos. Chem. Phys. 18 (3):2049–64. doi:https://doi.org/10.5194/acp-18-2049-2018.
- Zikova, N., M. Masiol, D. C. Chalupa, D. Q. Rich, A. R. Ferro, and P. K. Hopke. 2017. Estimating hourly concentrations of PM 2.5 across a metropolitan area using low-cost particle monitors. Sensors 17 (8):1–19. doi:https://doi.org/10.3390/s17081922.