
 ?Mathematical formulae have been encoded as MathML and are displayed in this HTML version using MathJax in order to improve their display. Uncheck the box to turn MathJax off. This feature requires Javascript. Click on a formula to zoom.
ABSTRACT
This study aims to assess the status of solid waste management (SWM) practice and to characterize and quantify the municipal solid waste as a measure toward effective management in Dilla town Southern Ethiopia. Formal surveys of household residents and SWM operators using a structured questionnaire were conducted to gather data on the current waste management practices of the inhabitants. Repeated field investigations, on-site waste segregation, characterizations, and quantification were conducted. The average per-capita waste generation rate of residential households was found to be 0.475 kg/capita.day. The majority of the waste was organic (68.40% by weight). The recyclable waste accounts 1.90% plastics and 1.50% paper by weight. Whereas, other wastes account 0.30% metals, 0.30% glass, 0.50% leather and rubber, 19.60% inert, 0.96% textiles, and 6.90% miscellaneous by weight. The awareness of inhabitants on solid waste management, poor household waste segregation practice, and disposing of an unsanitary landfill are revealing the main solid waste management problems faced. Other SWM barriers include ineffective solid waste fee system, lack of trained manpower, inappropriate collection routes; unavailability of collection vehicles, illegal solid waste disposal, and inappropriate setting of community containers. From the results of this study, it can be concluded that organic waste constituted a lion share of the solid wastes generated in the town. Hence, the municipality can recover this waste by introducing integrated urban agriculture that might convert this waste to organic fertilizer through composting. To boost SWM, creating public awareness, providing equipment, provision of incentives and other financial policies, and other supplies currently lacking and inappropriate must be provided. The municipal authorities of the town may use this work as a benchmark and might push environmental protection authorities to reexamine the implementation of their policies and strategies with relation to the human and environmental health of the town.
Implications: Nowadays, urban population is increasing in developing countries; led to generate an enormous amount of municipal waste in the areas which make more complicate its management pose environmental pollution and threat public health. Thus, to curve these problems this study finding will be important for various policymakers and town municipality. This study may also serve as a benchmark for the municipal authorities of Dilla town for whom the problem is still unseen and negligible, and can push environmental protection authorities to re-examine the implementation of their policies and strategies with regard to the wider issues of human and environmental health conditions of town inhabitants.
Introduction
Municipal solid waste generation is greatly accelerated in quantity and altered in composition throughout the world, particularly in developing countries (Erasu et al. Citation2018) as a result of population increase, rapid urbanization, industrialization, a booming economy, and the rise in the standard of living (Abdel-Shafy and Mansour Citation2018; Azam et al. Citation2020). According to the United Nations Environmental Programme (UNEP) report, the estimated quantity of municipal solid waste (MSW) generated worldwide is 1.7–1.9 billion metric tons in 2010 (UNEP Citation2010a). Future predictions showed that the present waste generation rate could dramatically increase and will reach up to 3.4 billion tons by 2050 (Kaza Silpa et al. Citation2018). For instance, in 2008, Indian cities generate eight times more MSW than they did in 1947 due to increasing urbanization and changing lifestyles (Sharholy et al. Citation2008). Thus, the increase in solid waste generation rate put immense pressure on municipal services (Ma and Hipel Citation2016; Odonkor S.T. et al. Citation2020).
The implementation of solid waste collection and disposal systems, as well as solid waste management practices in developing countries, is ineffective (Erasu et al. Citation2018; Nigatu, Rajan, and Bizunesh Citation2011; Tewodros, Arjan, and Fitsum Citation2008). For instance, the report of UNIDO in 2002, shows that in Abidjan, Ibadan, Bujumbura, and Lome only 70%, 40%, 41%, and 37% of solid waste were collected respectively (United Nations Industrail Development Organization (UNIDO) Citation2002). More than 50% of the collected waste is usually disposed of through unsanitary landfills, and about 15% is processed through unsafe and informal recycling (Chalmin and Gaillochet Citation2009). A house-to-house collection system of solid waste is very common, particularly in most developed nations. This phenomenon is very low in developing nations due to several challenges including urban population expansion, financial and other economic difficulties (Awuah Citation2018; Bezama and Agamuthu Citation2019; Odonkor S.T. et al. Citation2020). In low-income countries, collection alone drains 80–90% of total waste management budget. Thus, in most developing countries including Ethiopia, open dumping and open burning continue to be the primary method of MSW disposal (Chandak Citation2010).
In many Sub-Saharan African nations, waste collection systems are communal container collection methods that appear most dominant (Awuah Citation2018; Lagerkvist, A. and Dahlen, L. Citation2019; Lloyd Citation2019). In this kind of system, common containers are provided at dedicated points within neighborhoods for households to drop off their solid waste. And then the trash pickup vehicles acquire these containers and empty off the trash at the designated disposal site and return the containers to their original locations. However, this waste pickup method is faced with several difficulties, resulting in uncollected. Thus, there is an overflow of waste ground dumping at collection sites (Atkinson, Davila, and Mattingly Citation2019). Therefore, siting of communal containers could pose threats to the environment and health of the inhabitants.
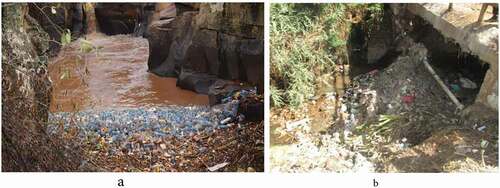
In many towns here in Ethiopia, waste management is poor and is dumped along roadsides and within the open areas, which could be a potential to create a serious public health problem and wellbeing of the peoples (Tewodros, Arjan, and Fitsum Citation2008). A similar phenomenon is happening in Dilla Town, Ethiopia. Improper waste management in Ethiopia is a major environmental concern in urban areas (Fereja, Tagesse, and Benti Citation2020). There are many initiatives taking place in Ethiopia to improve the environmental health of the town. Thus, Dilla town started its solid waste management about one decade back but the service cannot meet changing demands. As a result, the estimate of the municipality shows the waste generated in the town is not well collected, having carelessly disposed of. The residents of the town to some extent are mobilized from time to time to clean their immediate neighborhoods. Nevertheless, all these efforts ended up with limited success. The scattered solid wastes are common in most parts of Dilla town. The piles of waste are dumped illegally in open places, roadsides, sewerage courses, and drainage channels and end up in the nearby river (). The solid wastes left uncollected everywhere are creating odors and make areas filthy and ugly for living. This threatens the environment and spread of disease, which creates risk to public health through attracting insects and rodents (Francis-Xavier et al. Citation2018; Odonkor S.T. et al. Citation2020).
Figure 1. Illegal waste dumping practices in Wallame River, Dilla town, Southern Ethiopia.
In Dilla town, besides the existing inefficiency in SWM, the rise in solid waste generation and alteration in the composition is the most challenging issue that creates a serious burden on the town municipal services. This waste is not being adequately managed, creating a significant environmental and public health problem particularly in the slum areas, where the residents have less capacity to get hold of better services and are often ignored by the official agencies (Onibokun et al. Citation1999; UNEP Citation2009; World Bank Citation2011). To the best of our knowledge, there is no report on the status of the inhabitants on solid waste management practice, characterization, and quantification of solid waste in Dilla town, Ethiopia. Hence, to curve the above-mentioned problems and their adverse effects need urgent attention. Therefore, this study aimed to assess the status of municipal solid waste management practices and to characterize and quantify solid waste as a measure toward effective solid waste management: In the case of Dilla town, Southern Ethiopia.
Materials and methods
A solid waste source sorting and separation was conducted at the household level in selected Kebeles (smallest administrative unit in Ethiopia) of Dilla town of Ethiopia from November 2019 to July 2020 for the collection of data on solid waste composition and generation rate and compliance level of separation of the waste.
Study area
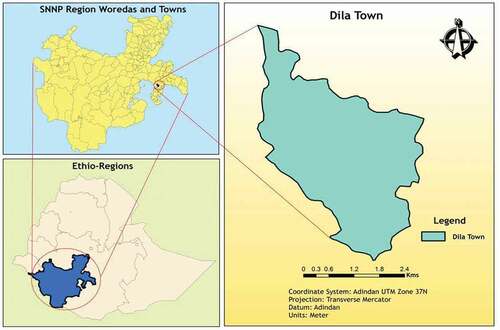
Dilla town is located in Southern Ethiopia at a distance of 359 km from the capital city of Ethiopia, Addis Ababa, on the way from Addis Ababa to Moyale, Kenya. It is located at 6° 22´ to 6° 42´ N and 38° 21´ to 38° 41´ E longitude with an altitude of about 1476 m a.s.l (). The mean annual daily maximum and minimum air temperatures are 28.4 and 12.8°C, respectively. According to the Dilla Town Administration Population Affairs – DTAPA, Citation2016, the town has an estimated total population of 130,000 (Dilla Town Administration Population Affairs – DTAPA, Citation2016).
Figure 2. Location of the study area.
Determination of sample size
Sample size determination is an important step in any sample study. The number of samples depends primarily on the cost versus its utility and by considering resource constraints and representativeness of the sample. There are different statistical procedures to calculate the number of sample at each confidence level. Usually, for solid waste data, the confidence level is set at 80% or 90% (Cacadia Consulting Group Citation2003). Hence, for this assessment, a 95% confidence level is considered with a 0.05 allowable error. According to the information obtained from Dilla town administration socioeconomic profile (2015) and Dilla town municipality, there are about 11,285 housing units (N). Out of those, 90% (p) are residential houses and the rest 10% (Q) is nonresidential houses such as commercial activities, offices, and institutions.
For the public survey, a sample size (n) of households to participate in the study was determined using the sampling formula, which was developed by Cochran (Citation1977), which has been widely applied by other researchers (Bartlett, Kotrlik, and Higgins Citation2001; Mesfin Assefa and Muktar Mohammed Citation2017;; Tassie Wegedie K. Citation2018) with the desired degree of precision for the general population. In this case, the population variable (p) is the house unit variable and is calculated using Equation 1.
Where n = sample size of housing units
p = Housing unit variable (residential houses),
Q = nonresidential houses (offices, schools, etc.) = 1 – p
N = Total number of housing units
Z = Standard normal variable and its value that corresponds to a 95% confidence interval equals 1.96
d = Allowable error (0.05)
Using Equation 1, the sample size of 138 households was obtained. According to Aderajew et al. (Citation2019), 10% nonresponse rate has been added. The total sample size considered for this study was 152 samples, which are quite sufficient to obey the minimum sample size for the standard scientific study. For those waste generators other than residential households, such as commercial centers, public and private institutions, and street sweeping were considered as 20% of the total population (Matt Crowe and Gerry Carty 1996).
Sampling technique
Regarding the sampling approach, a purposive random sampling technique was administered. The town comprises 3 kefle ketema (containing more than 2 kebeles with a medium level administrative unit of the town in Ethiopia) and 9 kebeles. By employing a simple random sampling approach, 3 kebeles were selected, one kebele from each kefle ketema. The sample size was distributed based on proportional allocation to the size of total households in the respective kebele. Finally, a stratified, purposive, and direct sampling technique was employed to select the households. The 80/20 approach was used, the first stratification of waste generators where 80% of the total waste could be generated by 20% of the generators. Hence, 80% of the total samples were selected from those who generate a large proportion of waste. This approach was followed to identify representative samples from the entire commercial centers, institutions, and street sweepings. Accordingly, the total sample selected was 108 commercial buildings; 24 public and private institutions, and 10 street sweepings.
Kebeles and households included in the study
To gather primary data from Dilla town, the three kefle ketema, namely Badcha, Sessa, and Hasedela were included in the study. To reduce the cost of time and energy, three kebeles were randomly selected; one kebele from each kefle ketema (Weldina kebele from Badcha kefle ketema, Haroke kebele from Sessa kefle ketema and Hasedela kebele from Haro Wollabu kefle ketema) and their household number are based on the population size of each kebeles as presented in . These households were selected using proportional simple random sampling. Accordingly, the specified 60 sample households were selected from Weldina kebele (Badcha kefle ketema), 47 from Haroke kebele (Sessa kefle ketema), and 45 from Hasedela kebele (Haro Wollabu kefle ketema).
Table 1. Kebele’s and the number of households (HHs) included in the study
Data collection, sorting, and measurement
The individual householders of the study location were visited to inform inhabitants about the survey and to receive feedback on their willingness to participate in the study. A formal survey for household residents and SWM operators using a structured questionnaire was conducted to gather data on the current waste management practices of the inhabitants. A house-to-house interview was carried out by the investigators and data collectors that had earlier been trained on how to solicit responses on the designed questionnaire. Questionnaires were administered to obtain data on waste management knowledge and reasons for willingness to participate. For the sake of simplicity, we divide the team into three; each contained 1 supervisor, 2 household interviewers, 4 waste sorters, and one cart transporting the wastes to the sorting site. The chosen households were earlier trained for 2 days on waste collection, sorting, and separation. The coding of plastic bags was done using permanent markers with the same code given to the respective households. The number of persons living in each selected household, the floor area, and the number of customers of commercial buildings and institutions were recorded on the datasheet. Solid waste samples were taken from all interviewed households and transported to selected sorting stations for waste segregation. Initial sorting of the waste was carried out by the members of the households and further sorting was done by the research team. 24 m2 hard plastic sheets were placed on the floor to ease sorting.
Wastes collected from 152 households having a total population of 851 were mixed to keep its homogeneity, and finally sorting, characterization and weight measurement for consecutive 8 days, as the first-day waste was not considered. Care has been exercised to avoid the collection of large-sized particles to reduce sampling bias. To this effect, large items and bags containing waste category like khat waste (Catha edulis), leftover locally known as geraba or leaves, and glass were removed from the sample and set aside for weighing, bypassing the sorting box. The fine particles were sieved from the waste to assist ease sorting and reduce the fractions which could otherwise be identified as inert. The sorted wastes were further segregated into 9 major categories and analyzed by their weight as well as the percentage composition as described by Miezah K. et al. (Citation2015).
These include:
Organics – Food and fruits waste, vegetables and plants, yard waste (grass trimmings), wood, and animal droppings,
Plastics – Polyethylene terephthalate (PET), high-density polyethylene (HDPE), polyvinyl chloride (PVC), low-density polyethylene (LDPE), polypropylene (PP), polystyrene (PS), other plastics,
Paper – Cardboards, newspapers, office papers, tissue papers, magazines, etc
Metals – All kinds of metals such as scrap, cans/Tins,
Glass (Colored, Plain), every type of glass, etc
Textiles- All kinds of textile wastes
Rubber and leather – All kinds of rubber and leather wastes
Inert – (Sand, fine organics, ash, and dust).
Miscellaneous – (Construction and demolishing waste, batteries, paints, and any other waste fraction is not fit in other categories).
After sorting operations, the categorized waste has been reweighted according to the waste category. All weight measurements were done after regular calibration and presented in gram (g) or kilogram (kg). The sorted wastes were weighed using a weighing balance (1–100 kg) and a Top Pan balance (China P090008, Hot pan) of varied capacities: 1 g, 2 g, 5 g, 10 g, 20 g, 50 g, 0.1 kg, 0.2 kg, 0.5 kg, 1 kg and 2 kg (Labotrix Group Limited, China). The percentage of waste composition was calculated by using Equation 2.
The per capita per day generation rate was determined as per the total waste collected in a day and the separated fractions using EquationEquation 3(3)
(3) .
Assessment of solid waste management practice of inhabitants
The empirical data upon which the authors draw is gathered through repeated (four times with in the study period) periods of fieldwork were carried out. Studies were conducted in January, February, June, and July months. Employing a descriptive cross-sectional research design, the study has adopted a mixed research approach to assess the current solid waste management practices in the study town since the intention was to assess the practice of inhabitants on solid waste management in Dilla town; the authors selected all (three) kefle ketemas for the study.
Data were gathered from randomly selected individuals through oral interviews and questioners to obtain data on waste management knowledge and to assess the solid waste management practice of inhabitants. The 152 householders from whom the solid waste sample was collected for characterization and quantification purposes were included for the oral interview and questioner. Key informant interviews, focus group discussions, and field observations were employed to collect the required primary data. For household surveys, well-structured questionnaires were employed which had both open and close-ended questions. Eight key informants include from head departments, staff members from the municipality of the town, Environmental Protection, and Land Administration Bureau, micro and small enterprise leaders, and community representatives were incorporated as key informant interviewees to generate better data regarding solid waste management practices, and their challenges. Those individuals were selected based on their length of experience in solid waste management and their life experience.
Four focus group discussions were made, each having 8–10 homogeneous members, to solicit the desired data regarding the solid waste management system of Dilla town as well as inhabitants experience regarding waste disposal practices. Field observations, regarding the method of solid waste accumulation sites (open spaces, roadsides, drainage channels, and collection containers) were conducted too and photos were taken.
Data analysis
The data were coded employing a standard template and then analyzed using SPSS version 20 statistical software. Data cleaning and analysis were carried out accordingly. The collected data were analyzed using descriptive statistics and presented in frequency, percentages, and graphs. Mean and standard deviation were calculated from the obtained data. The per capita waste generation rate in the town was determined using descriptive analysis and waste characteristics were displayed using charts, and tables.
Results and discussion
The solid waste generation rate of households
As shown in , the rate of waste generation was in the range of 1.15–2.41 kg/household for the investigated households. The average per-capita waste generation rate among residential households was found to be 0.475 kg/capita.day and 1.290 L/capita.day, making the average density of un-compacted waste (waste as collected) is 317 kg/m3. Out of the three kebele’s included in this study, the solid waste generation rate from Woldena kebele households was the highest producing 0.610 kg/capita.day followed by Haroke kebele that generates 0.559 kg/capita.day. The least generation rate recorded was in Hasedela kebele with a per-capita waste generation rate of 0.255 kg/capita.day, however, with a relatively dense waste (347 kg/m3). The average household solid waste generation rate of the town, when the waste generated from commercial sources is taken into account is 0.613 kg/capita.day.
Table 2. Average waste generation rate among residential households in Dilla town (n = 152)
Thus, the solid waste generation rate (0.475 kg/capita.day) of Dilla town is high as compared with other data from towns in Ethiopia having almost similar status, 0.35 kg/capita.day from Bonga town (Mulu and Legesse Citation2005); 0.18 kg/capita.day from Bishoftu town (Mebrate Citation2005); 0.43 kg/capita.day from Gondar town (Sharma et al. Citation2011) of Ethiopia and 0.233 Kg/capita.day for East African cities developed by WHO (Birke Citation1999; Gebrie Citation2009) but, lower than Debre Berhan town, Ethiopia (0.55 kg/capita.day) (Vikrant Tyagi et al. Citation2014). Almost similar quantity of solid waste generation rate was reported 0.46 kg/cap.day of LagaTafo Laga Dadi town, Ethiopia (Assefa and Mohammed Citation2017).
The solid waste generation rate of commercial sources
Results from commercial sources reveal that the solid waste generation rate varies in a different category of commercial type studied. The largest generators among the commercial sources were hotels, restaurants, and cafeterias accounted 0.35 kg/customer.day, whereas other commercial sources generated within the range of 0.007(Commercial complex) to 0.035 kg/sq.m.day (supermarkets). The average solid waste density of the commercial sources found was 211.03 kg/m3. However, their density considerably varies from 57.67 kg/m3 among shopping complexes to 834.60 kg/m3 within juice houses.
In this study, the solid waste generation rate of the hotel is comparable with the study reported in Phnom Penh city, Cambodia, whose generation rate was 0.33 kg/customer.day (Mongtoeun Y. et al. 2014), and the city center of Kuala Lumpur, Malaysia, 0.45 kg/customer.day (Mohamed et al. Citation2009). However, lower than the study done in Chittagong city of Bangladesh where the hotel generation rate was 0.70 kg/customer.day (Hossain M. L. et al. 2013). The solid waste generation rate of a commercial complex is significantly lower than the study reported in Kuala Lumpur, Malaysia (0.013 kg/sq.m.day) but, a higher generation rate was reported in supermarkets (0.013 kg/sq.m.day) (Osman Saeed, Hassan, and Mujeebu Citation2009).
According to the Dilla town tourism office, the town accommodates about 287 service delivery units (hotels, restaurants, and cafeterias/juice houses). In this study, it is found that a single service delivery sector on average serves 190.9 customers per day. Hence, from this service delivery sector per day 106.73 kg of solid waste is generated in the town. The waste stream in hotels is also characterized by the diversified type of waste items (9 major categories): organic (more of vegetable peelings, yard waste, and a small quantity of wood), paper (normal, coated, tissue, carton), Plastics (LDPE, PET, PVC, PP, PS, and other plastic), rubber and leather, textile, glass, metal, inert, and miscellaneous. However, all 9 types of waste categories were already mixed at the source without any practice of waste segregation. Among the solid waste items generated in hotels, the dominant waste fraction is organic, where hotels and restaurants account for 76%; cafeterias/juice houses account for 97% of the generated wastes are organic waste. Almost a similar finding was reported by Mongtoeun Y. et al. (2014) in Phnom Penh city, Cambodia, that restaurants and hotels produce 60%–70% organic waste. Based on this finding, hotels, restaurants, and cafeterias/juice houses in Dilla town generate 25.33 tons of organic solid waste per day. The other abundantly generated waste items among service delivery sectors, particularly hotels, were plastics waste items. Hotels alone in Dilla town on average generate 0.99 tons of plastic waste daily where LDPE (plastic bags) and PET (plastic bottles) were the two dominant plastic polymers found in hotel waste streams.
The other sources of solid waste generators in the commercial sector are supermarkets, boutiques, ladies’ beauty salons, and barbers, and other related shops. According to the Dilla town investment and tourism office, there are 457 retails in the town. It is found that the average retail generates 0.021 kg of solid waste per square meter per day. This sector, therefore, generates nearly 3.35 tons of solid waste daily. Paper and carton are the dominant waste category in the retail of commercial complex, whereas hair is dominant in beauty salons and barbers, reflecting the large amounts of packaging used in the retails.
Household solid waste characterization and quantification
The generated solid waste was segregated to its composition and then quantified. The result of the study shows that household waste is an aggregate of all materials or a heterogeneous mass of discarded materials ready for disposal. A characteristic of solid wastes generated in Dilla town was given in . The solid waste generated from households in Dilla town was found to be dominated by organics (68.4%) is easily biodegradable and can be managed at the household or community level by introducing integrated urban agriculture that might convert this waste to organic fertilizer through compositing. This was followed by the following order, inert material (19.6%), miscellaneous (6.9%), plastic materials (1.9%), papers (1.4%), textiles (0.96%), rubber and leather (0.5%), glass (0.3%), and metals (0.3%). It is found that glass and metals are accounted the least amount. Ashes are common types of waste, due to excessive use of biomass fuels in Dilla town. In the waste aggregate sticks and leaves were observed more frequently, this might be due to Dilla town being a cash crop area, and the younger peoples are frequently using the leaf of khat as a stimulant. A similar observation was reported by Regassa, Sundaraa, and Bogale (Citation2011). This indicates that the waste composition is geography-specific. Beside this, the waste composition is also influenced by the economic context of the households. “‘Greater wealth results in higher consumption levels, thus generating more waste amidst changes in waste composition’” (UNEP 2007).
Figure 3. Average household waste composition of Dilla town (a) (W/W%) and (b) (V/V) .
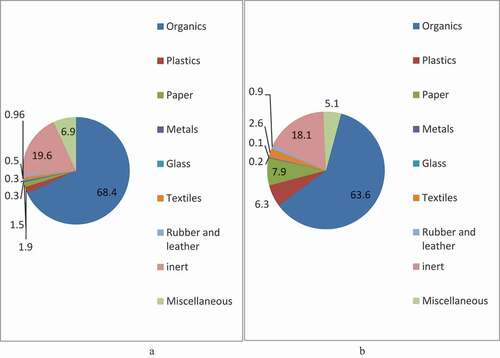
As observed during the fieldwork, households having low income have a high percentage of organic matter in the household waste stream like food leftover, vegetable and fruit peelings, onion seed coats. However, other component wastes show a reverse trend. Paper, plastic, glass, and metal fractions increase in the waste stream of middle- and high-income households. This pattern in the waste composition is attributed to high spending among better-off people on packaging materials and much disposed. While low-income households spend most of their disposable income on the purchase of food items, most of which are consumed (less wasteful in consumption) and a relatively high level of recovery of valuable components such as scrap metals, plastics, card boxes, and bottles for sale. As there is no legal waste recycling company in the town, some of the recovered wastes are either reutilized at the source or sold to itinerant buyers, locally known as quraleos (persons who practice the exchange of recycled waste for other goods). The composition of MSW varies from one municipality to another and from country to country significantly. Hence, such variation depends mainly on the lifestyle, economic situation, waste management regulations, and industrial structure (Hussein I. et al. Citation2018).
Status of solid waste management practice of Dilla town
Solid waste sorting
Sorting of solid waste into different elements at the source is an important part of solid waste management. This can be to create waste management easy and simple. Besides waste management, waste sorting is an activity that aims to get benefits out of waste. An attempt was made to assess to what extent household waste segregation (sorting) practice is. In Dilla town, solid waste sorting at the source is a relatively new activity, which has not become a common practice yet. The data shows that the majority (94.1%) of the households covered by the study do not separate waste at the household level and stored their waste without segregation. Only 5.9% of the households were practiced sorting at household level into different categories (). Study shows that in Ethiopia having almost similar towns, a high percentage of solid waste is not sorted at a household level. For instance, a study conducted in Jigjiga town 65.5% (Tewodros Manyazewal and Tesfaye Walelgn Citation2019), in Asella town 72.8% (Gorfnesh Lema et al. Citation2019), and in Dassie town 76% (Alie in 2015) did not segregate solid waste at source. Similarly, research conducted by Bizatu and Negga (Citation2010), revealed that about 66% of solid waste in Kersa town, Ethiopia, is dumped in open space. Sorting of solid waste mainly depends on public awareness. For instance, Nigatu, Rajan, and Bizunesh (Citation2011) found in their study of the challenges and opportunities of solid waste management in Addis Ababa City, about 70% of households’ segregate their waste into different elements because the awareness is relatively high. This implies that creating public awareness is a key issue to enhance solid waste segregation at source.
Table 3. Waste sorting practice of Dilla town
In Dilla town, waste sorting is comparatively set to extend. However, the practice is extremely far below the expected by Dilla town administration. The households gave the explanation why they did not practice sorting at source, including lack of awareness regarding the importance of waste sorting (44.1%), lack of sensitivity (23.0%), difficult and time-taking activity (17.1%), and little practical value (15.8%). The interviews and individuals who participated in a focal group discussion disclose most households are not familiar with waste sorting. They mentioned that some of the households are aware of the importance of segregation, but they are careless and mix every type of wastes as one. This implies that there is an attitudinal problem that exists among the households. Hence, the community leader pointed out “there are factors that shape the willingness to separate waste at source: (1) it consumes an excessive amount of time, (2) it needs more containers and this has a cost implication, and (3) it requires more space in households. Nigatu, Rajan, and Bizunesh (Citation2011) reported that the above reasons hinder waste sorting at the household level.
As there is no formal waste recycling activity in Dilla town, informal slightly solid waste sorting activities were made unknowingly mainly by poor peoples, since some waste materials required/recovered for different purposes. As the interviewers disclose, cans and scrap metals are stored and sold by weight to people as quraleos, and sold to factories for recycling. Organic wastes like plant origin are sorted for reuse in gardens and as fuel after the waste gets dried. Some households give the waste away to their neighbors who use it for animal feed. The manure is used on plaster walls and floors, and for fuel when dried up, whereas the grass is fed to livestock. In some households, vegetable and fruit peelings are used as manure within back yard gardens or used for animal feed. As indicated by participants during focus group discussions, metals, plastic materials, worn-out clothes, and shoes are potentially reusable materials. It was observed that reusable materials are removed by some households and by waste pickers during the collection process and at the disposal site.
Solid waste storage
The waste should normally be stored at the source of waste generation until collected for its disposal. , shows that 46.7% of the total 152 respondent households store their solid waste in sacks, 34.9% deposited in plastic bags locally known as Madaberia. During the focus group discussions, they disclose households use sacks and plastic bags to store solid waste because of the cost-effectiveness, availability, and suitability for holding and transporting a large volume of solid waste. As shows, 13.2% of the households store their solid wastes in homestead yards, open spaces, near roadsides, and vacant areas, in open sewers, banks of rivers, and around buildings near their homes. Others use carton boxes (3.9%) and metallic barrel (1.3%) to store the solid waste they generate. This makes the waste collection system difficult. The study shows the households dispose 79.8% of solid waste in an uncontrolled and unplanned dump sites (along the roadside near residential buildings), which sprawls over an outsized area and this affects the encompassing scenery which makes the environment filthy. There is no habit of waste storage; instead, the wastes are thrown on the streets, treating the streets as a receptacle of waste. The inefficiency of the open transfer stations creates major problems to the environment; this puts the health of the inhabitants at risk. And pollute the air by releasing greenhouse gases and water runoff that ends up in the water supply system.
Table 4. Materials used for storing household waste of Dilla town
Solid waste collection and transportation
As shown in , only 20.1% use communal collection systems where waste generators bring their waste to collection points which could be containers or open places including roadsides. Block collection accounts 13.8% where waste generators are responsible for bringing their waste to collection vehicles, and 9.9% of the households use formal door–to–door collection service. The highest proportion 55.9% of the solid waste from households thrown away on the roadside and part of it can be collected by the town municipality. In the town, there are two basic types (human power and animal power) solid waste collection systems are used. Concerning the collection using human power, transportation of waste to the collection points (transfer stations) or collection vehicles is made using human labor. This is common among residents who cannot afford to acquire door-to-door collection services. Additionally, for communal and block collection, households use door-to-door service provided by two-wheeler carts. Workers inform households to urge their solid waste ready for the collection service so they collect the waste using wheeled carts, with a donkey in front pulling the cart. Since municipality collection vehicles cannot reach all areas, households living around roadsides were the sole beneficiaries of the block collection service. As shows, the waste collection method of the town is usually delivered through the waste generators delivering their waste directly to collection points.
Table 5. Types of the solid waste collection system in Dilla town
As one community representative disclosed, “the municipal waste collection system has just one route and the truck makes one trip per day to the ultimate disposal site. It is also unable to stick to its collection schedule”. The carts provide door-to-door solid waste collection services to the households, but it is not as they want. As one of the solid waste workers disclosed, ‘most of the carts are old and can’t travel at the expected speed, as a result, delay in collection and disposal process is common. Since, most of the streets did not design to permit such collection vehicles to pass. Some streets are narrow, sloppy, and slippery during the rainy season. In such areas, the amount of waste increases and is rarely collected particularly during the rainy season. During the interview, some respondents have been stated that there is no door-to-door collection service in their area due to inaccessibility (awkward road surfaces and topography). As observed during fieldwork, high-income residential areas have more access to collection services than low–income residential areas. In areas where motorized collection service does not reach, an animal-powered collection system is commonly used. However, as the study households indicated, “there remains lack of support in low-income residential areas as animal-driven carts do not reach and collect wastes as needed, in that case, peoples are forced to use human labor”. Variability in waste collection frequency reduces confidence on waste collection service (Coffey and Coad Citation2010). As observed during fieldwork, the number of waste containers is not enough, and they are obliged to throw their garbage in open areas.
The current solid waste collection and transportation system of the town is not as expected by the municipality of the town. The study revealed that in Dilla town 58.3%.of the households surveyed do not have access to the regular collection of solid waste. Collection services are more active and limited to mainly the open areas within the town and the business area where they are able to pay for the services. The situation is similar to the findings of the African Development Bank (Citation2002) which were reported as the rate of waste collection across the African continent varies from 20 to 80%. In conclusion, in Dilla town, all generated wastes are not collected as planned and required.
Solid waste transfer station
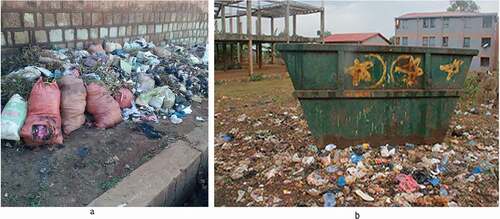
The availability of waste transfer stations is vital in the solid waste management system. There are communal containers in Dilla town but very limited areas. In areas where there are no communal containers, inhabitants use open places as transfer stations. Surprisingly, as one of the key informants disclosed, “disposing of solid wastes in open places and drainage systems is a common practice in the town”. There is punishment on individuals who get rid of waste in unauthorized areas but there is lack of implementation. As a result, regulations do not seem to be obeyed by the households as desired. Some transfer stations are often overflowing with uncollected waste (, ). There is improper use of transfer stations because the stinky smell of the waste has forced inhabitants not to reach transfer places to dispose of waste properly. Some households are choosing to burn solid waste at precollection sites. This burning of waste produces toxic gases as well as smoke which have been led to pose serious effects on the health of peoples (UN-HABITAT Citation2012) and it has a contribution to climate change through enhancing the concentration of greenhouse gas in the atmosphere. Households burn even biodegradable organic wastes (that should be composted). However, as municipal solid waste workers indicated, “the problem with compost in the town is that there is low demand for the product”.
Figure 4. Current solid waste transfer station of Dilla town, Southern Ethiopia.
During the focus group discussion, the discussants indicated that “the frequency of the solid waste collection service provided by the municipality is very low as a result of the limited number and existing vehicles getting old”. This creates a large volume of solid waste on the road. As one of the key informants indicated, “parts of the household wastes are carelessly dumped in open places before it reaches to transfer stations”. On the other hand, even wastes that are collected in different containers are not timely transported to the disposal sites. The issues associated with the limited carrying capacity of the municipality tracks and downtime frequently caused by vehicle problems. There is a limited number of communal containers and a low frequency of waste collection creates heaping of waste in open space, sewers, and other places particularly near residential areas. These conditions create problems for the households, calling for the more efficient and urgent arrangement of transfer stations’. The long-distance covered or time spent to dispose of waste goes to add up the dumping of waste in an illegal place. The uncollected solid waste has often the common cause of blocked sewerages which increases the chance of flooding and vector-borne diseases (Achankeng Citation2003; Amy Krystosik et al. Citation2020; Kumar M. and Prakash V. Citation2020; Faiza M.T et al. Citation2019; Shaoli De and Biswajit Debnath. Citation2016) and reduces the esthetic value of green areas.
Solid waste final disposal
The solid waste disposal in Dilla town is through unsanitary landfills. Like in many developing countries, little focus is given to the municipal solid waste collection and management since there is lack of attention for waste disposal. The current situation of Dilla town solid waste transport system and final disposal was shown in respectively. While collection would help to remove waste from the generators, the collected waste is often disposed of in open dumps without concern for its environmental and public health impacts. The common transport mode in the study town is open and general-purpose trucks that transport and dump all types of wastes together. Besides, the trucks are not convenient for workers during loading, lifting of wastes are done manually. As one community representative put it, “most often workers are not provided with protective materials which expose workers to various diseases.” Wastes on transit are commonly uncovered causing littering, odor, and esthetics problems. The municipality is responsible for transporting wastes to the final dump site, locally known as Wallame dumpsite. According to the interview held with one of the key informants, “the main challenge in the transportation of solid waste includes few trucks, trucks that are very old, maintenance difficulties, and negligence of drivers.” Wallame dumpsite is located in an environmentally sensitive area; close to a valley. As observed, Wallame dumpsite receives mixed wastes of various origins (). The waste dumps pose a real effect on workers, waste pickers, and stray animals that visit the sites. Most of the waste workers and scavengers do not wear proper protective gear exposing them to serious health problems.
Figure 5. Current Dilla town solid waste transport system.
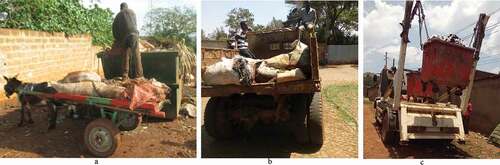
Figure 6. Current Dilla town solid waste dumpsite.
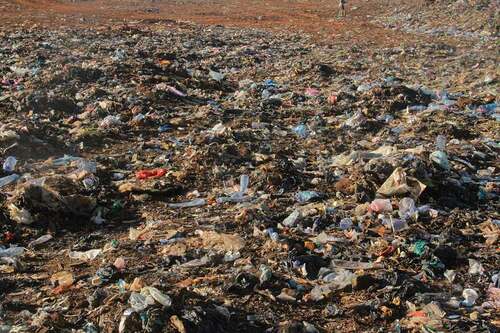
Urban areas are supposed to have designated landfill sites. However, in Dilla town, such landfill sites are absent. Dilla dump site is a natural valley, and the roads are poorly maintained brings significant risk to waste transport. The trouble with this dumpsite is that there is not protected from the surrounding environment and then the hazardous chemicals and leachates that are released from the dumpsite pollute downstream. Leachates from this dumpsite can flow into river and drainage channels as runoff water and threats human health. Presently, waste management disposal is very weak. This dumpsite operates beyond its maximum capacity. The existence of plastic waste in the upper layer reduces the biological degradation of organic waste, which reduces the life span of the dumpsite and increases the decomposition time of the waste. Valleys are often the worst places for waste disposal operations, because of difficulties in preventing the long-term contamination of water resources from wastes that are tipped down slopes into valleys, tend to pollute and offer little opportunity for rehabilitation (UN-HABITAT Citation2012). Residents that were interviewed blamed the inappropriate disposal of MSW in path, riverside, and road reserves on the failure of the town municipality to provide appropriate collection services. In general, there is no sanitary landfill or controlled disposal site in Dilla town for waste disposal. Solid waste even from the formal collection system is transported to an open dumpsite which is located at a distance of 5 km from Dilla town. Piles of solid wastes are often found along roads, underneath bridges, in drainage channels, and other open spaces.
A challenge to solid waste management
Certain deficiencies have been identified in the existing solid waste management system of the town. This includes in Dilla town, well–trained human resources for solid waste management are scarce. People without or with limited technical training in waste management are simply assigned to handle it. There are limited numbers of service providers. The solid waste management department uses different types of equipment (vehicles, waste containers, and dust bins) for solid waste management services. However, the problem is associated with inadequacy and improper use of this equipment. One serious problem that affects the solid waste management system is the problem of vehicles. The town has a limited number of municipal trucks and some of these trucks served for many years. Because of this, most of the vehicles are currently inefficient. The demand does not be timely addressed, resulting in the growing problem of waste management in the town. People are unable to use the existing containers as they wish. Containers are few and not evenly distributed. Besides, some of the containers are placed very close to residential houses, and those residents living near the containers complain about the stinking smell. As a result, the filthy areas where the containers are placed continue to affect the public health and the beauty of the town. As one of the key informants put it, “‘people continue to use containers improperly because of the stinky smell of the wastes that are left uncollected for a long period.’”
One serious problem that affects the solid waste management system of the town is the absence of waste segregation at the source. There are also other problems such as: increasing the amount of dumping of waste into open space and littering on the roadside finally end up to the rivers, lack of standard transfer stations, solid waste collection service provided does not cover all solid waste generators. Collection services are limited to mainly business areas and households that are willing to pay for the services. Only a small fraction of wastes are collected through formal and informal collection system, street–sweepers and waste collectors are not provided with personal protective equipment, emptying of community containers are irregular (no fixed programme), waste collection is considered as the tax of children and poor peoples. Households particularly from slums, low-income areas, and local shopkeepers frequently throw waste onto streets, and any available open spaces causing excessive littering and clogging of drainage systems. There is no treatment facility for municipal solid waste, there exists no leachate or emission control of the dumping site and the dumping site has no excavator or compactor. The absence of an environmentally acceptable landfill site that fulfills the standards provided in the environmental policies and laws concerning SWM in contemporary Ethiopia.
Some common causes for poor waste management services in Dilla town are linked to lack of appropriate government policy and legislation and its enforcement, lack of strategic planning, lack of public awareness and commitment, inadequate technical expertise, and failure to develop the necessary human resources, and insufficient financial resources or inappropriate allocation of available resources. The constitution of the Federal Democratic Republic of Ethiopia (Article 92.2) indicates that “Government and citizens shall have the duty to protect the environment.” However, in Dilla town, there is no continuous education on solid waste management and the legal system that governs the residents. Even those who know the law, never act accordingly. This affected the management system and created a negative impact on the performance of waste management. There is a problem with vehicles to dump the waste in due course and this problem is serious, especially during the rainy season. Carts and municipal trucks cannot move as they want because the carts are old and road surfaces are not reasonable. Hence, the waste that is expected to be disposed of is not taken to the dumping site at the fixed time frame. There is improper use of transfer stations by some households. There is a lack of will from the beneficiaries’ side to pay the fee the collection service deserves. The absence of community participation is also a challenge for proper SWM.
Conclusion
The current study showed that the average per-capita per day waste generation rate of Dilla town households was 0.475 kg/capita.day. The organic fraction was the highest in the waste stream by weight followed by inert materials. The solid waste generation found in the decreasing order of organic > inert > miscellaneous > plastics > papers > textiles > leather and rubber > metals = glass by weight were obtained. Poor solid waste management has remained one amongst the issues Dilla town continues to face. The findings in this study showed that households have low levels of awareness toward solid waste management and associated problems, do not have adequate access to door-to-door solid waste collection, and low solid waste collection frequency, illegal waste dumping and disposing of in unsuitable landfill could have contributed to the reported improper solid waste management practice. Thus, enhancing the awareness of solid waste management at the community level, providing door-to-door solid waste collection service, and providing the appropriate sanitary landfill are found to be potential strategies to avoid the problems associated with waste disposal in the nearby environment. Providing equipment and facilities, provision of incentives and other financial policies currently lacking and inappropriate must be provided. In addition, it is highly advisable to employ waste reduction measures like reducing, reusing, and recycling. The work in this study shows a promising strategy to obtain a comprehensive image of SWM practice in the district and to convince policymakers to give emphasis to the issue.
Supplemental Material
Download MS Word (39.9 KB)Acknowledgment
The authors are very thankful to the office of the Vice president for Research and Technology Transfer of Dilla University for financial support.
Disclosure statement
No potential conflict of interest was reported by the author(s).
Supplemental Material
Supplemental data for this paper can be accessed on the publisher’s website.
Additional information
Funding
Notes on contributors
Workineh Mengesha Fereja
Workineh Mengesha Fereja, is currently a staff member of Chemistry Department and Vice Director of Energy and Environment Research Center at Dilla University, Ethiopia. His specialization is in Environmental Sanitation. He worked on environmental analysis, the physical-chemical behavior and partitioning of organic micro-pollutants in/between the different environmental matrices. Mr. Fereja has been working research on the application of the current technologies for the quantification, prevention and remediation of environmental pollution where the focus area is waste/wastewater treatment technology. Part of his research results have been published in international journal, 1. Journal of Applied Chemical Science International K.K.Sivakumer, Workineh M. Fereja, & S.Mohalakshmi (2017). Prosopisnjuliflora carbon and commercial activated carbon in the pollutant reduction technology. 8(1): 1-5. 2. Journal of Cogent Food & Agriculture Workineh Mengesha Fereja, Wondimagegn Tagesse, and Girmaye Benti (2020). Treatment of coffee processing wastewater using Moringa stenopetala seed powder: Removal of turbidity and chemical oxygen demand. 6(1): 1816420, DOI:10.1080/23311932.2020.1816420. The experience of the applicant is ranging from environmental analysis combine preventive and remediation technology. So the manuscript submitted for publication is one of the projects among the research activities in our lab group.
Dereje Diriba Chemeda
Dereje Diriba Chemeda, is currently a staff member of Chemistry Department and coordinator of Energy and Environment Research Center at Dilla University, Ethiopia. His specialization is in Analytical Chemistry and Environmental Science. He worked on environmental analysis, water and wastewater treatment. Mr. Chemeda has been working research on the application of the current technologies for the quantification, prevention and remediation of environmental contaminants where the focus area is waste/wastewater characterization and treatment technology.
Related Research Data
References
- Abdel-Shafy, H. I., and M. S. M. Mansour. 2018. Solid waste issue: Sources, composition, disposal, recycling, and valorization. Review Egyptian J. Petroleum 27 (2018):1275–90. doi:https://doi.org/10.1016/j.ejpe.2018.07.003.
- Achankeng, E. 2003. Globalization, urbanization, and municipal solid waste management in Africa, African Studies Association of Australasia and the pacific. Conference Proceedings, African on a Global Stage, University of Adelaide, Australia.
- Aderajew, M., R. Martin, R. Sirak, G. Azage, and T. Mulumebet. 2019. Urban health extension service utilization and associated factors in the community of Gullele sub-city administration, Addis Ababa, Ethiopia. Int. J. Community Med. Public Health 6 (3):976–85. doi:https://doi.org/10.18203/2394-6040.ijcmph20190580.
- African Development Bank. 2002. Study on solid waste management options for Africa. Canada.
- Amy, K., G. Njoroge, L. Odhiambo, J. E. Forsyth, F. Mutuku, and A. Desiree Labeaud. 2020. Solid wastes provide breeding sites, burrows, and food for biological disease vectors, and urban zoonotic reservoirs: A call to action for solutions-based research. Front. Public Health. 7:405. doi:https://doi.org/10.3389/fpubh.2019.00405.
- Assefa, M., and M. Mohammed. 2017. Solid waste Generation Rate and Characterization Study for Laga Tafo Laga Dadi Town, Oromia, Ethiopia. Int. J. Environ. Protect. Policy 5 (6):84–93. doi:https://doi.org/10.11648/j.ijepp.20170506.11.
- Atkinson, A., J. D. Davila, and M. Mattingly. 2019. The challenge of environmental management in urban areas. London: Routledge. doi:https://doi.org/10.4324/9780429439094.
- Awuah, K. G. B. 2018. The role of urban planning in sub-saharan Africa urban pollution management. Urban Pollut: Sci. Manage. 385–95. doi:https://doi.org/10.1002/9781119260493.ch29.
- Azam, M., S. S. Jahromy, W. Raza, N. Raza, S. S. Lee, K. Kime, and F. Winter. 2020. Status, characterization, and potential utilization of municipal solid waste as renewable energy source: Lahore case study in Pakistan. Environ Int 134:105291. doi:https://doi.org/10.1016/j.envint.2019.105291.
- Bartlett, J. E., J. W. Kotrlik, and C. C. Higgins. 2001. Organizational research: Determining appropriate sample size in survey research. Inform. Techno. Learning. Perform. J. 19 (1):43–50.
- Bezama, A., and P. Agamuthu. 2019. Addressing the big issues in waste management. London, Englan: SAGE Publications Sage UK.
- Birke, Y. 1999. Solid waste management in Ethiopia. Paper presented on 25th WEDC conference in the Integrated Development for Water Supply and Sanitation, Addis Ababa, Ethiopia.
- Bizatu, M., and Negga, B. 2010. Community based assessment on household management of waste and hygiene practices in Kersa Woreda, Eastern Ethiopia. Ethiop. J. Health Dev. 24(2).
- Cacadia Consulting Group. 2003. Guidelines for waste characterization studies in the State of Washington. Washington: Washington State Department of Ecology.
- Chalmin, P., and C. Gaillochet. 2009. From waste to resource, an abstract of world waste survey, Cyclope, Veolia Environmental Services, Edition Economica, France.
- Chandak, S. P. 2010. Trends in solid waste management – Issues, challenges, and opportunities presented at the International Consultative Meeting on Expanding Waste Management Services in Developing Countries, Tokyo, Japan. 18–19.
- Cochran, W. 1977. Sampling techniques. 3rd ed. New York, USA: Wiley series in productivity and Applied mathematical statistics.
- Coffey, M., and A. Coad. 2010. Collection of municipal solid waste in developing countries. Nairobi-Kenya: UN-HABITAT.
- Dilla Town Administration Population Affairs. 2016. Coordination and implementation core work process report. unpublished. Dilla, Ethiopia.
- Erasu, D., Feye, T., Kiros, A., and Balew, A., 2018. Municipal solid waste generation and disposal in Robe town, Ethiopia. Journal of the Air & Waste Management Association. 68(12): 1391–1397.
- Fereja, W. M., W. Tagesse, and G. Benti. 2020. Treatment of coffee processing wastewater using Moringa stenopetala seed powder: Removal of turbidity and chemical oxygen demand. Cogent Food Agric. 6 (1):1816420. doi:https://doi.org/10.1080/23311932.2020.1816420.
- Francis Xavier, M. K., D. Millar, and J. Tanguo. 2018. An effective solid waste management and environmental sanitation diseases reduction module of Ghana-A case of thetechiman municipal area, brong ahafo region. Ghana. J. Environ. Toxicol. Stud. 3 (1). doi: https://doi.org/10.16966/2576-6430.110.
- Kassa, G. 2009. Management of domestic solid waste in Bahirdar town: Operational analysis and assessment of constraints that affect solid waste management. Addis Ababa, Ethiopia: VDM Verlag.
- Kassahun Tassie Wegedie. 2018. Households solid waste generation and management behavior in case of Bahir Dar City, Amhara National Regional State, Ethiopia. Cogent Environ. Sci. 4:1471025. doi:https://doi.org/10.1080/23311843.2018.1471025.
- Kaza, S., L. C. Yao, P. Bhada-Tata, and F. Van Woerden. 2018. What a waste 2.0: A global snapshot of solid waste management to 2050. Urban development. Washington, DC: World Bank. © World Bank. https://openknowledge.worldbank.org/handle/10986/30317License:CCBY3.0IGO.
- Kumar, M., and V. Prakash. 2020. A review on solid waste: Its impact on air and water quality. J. Pollut. Eff. Cont. 8:252. doi:https://doi.org/10.35248/2375-4397.20.8.252.
- Lagerkvist, A., and L. Dahlen. 2019. Solid waste generation and characterization. In: Recovery of Materials and Energy from urban wastes: A volume in the encyclopedia of sustainability science and technology. 2nd ed., 7–20. New York, NY: Springer.
- Lema, G., M. G. Mesfun, A. Eshete, and G. Abdeta. 2019. Assessment of status of solid waste management in Asella town, Ethiopia. BMC Public Health 19 (1):1261. doi:https://doi.org/10.1186/s12889-019-7551-1.
- Lloyd, J. S. 2019. Expanding safe waste management to public health systems. Lancet 393 (10168):225. doi:https://doi.org/10.1016/S0140-6736(18)32622–9.
- Ma, J., and K. W. Hipel. 2016. Exploring social dimensions of municipal solid waste management around the globe: A systematic literature review. Elsevier Publishing Ltd: Waste Management. doi:https://doi.org/10.1186/s12889-019-7551-1.
- Manyazewal, T., and T. Walelgn. 2019. Solid waste management practice and level of satisfaction from related services among commercials and institutions in Jigjiga City, Ethiopia. Int. J. Environ. Sci. Nat. Res. 21 (2). doi: https://doi.org/10.19080/IJESNR.2019.21.556057.
- Mebrate, G. 2005. Analysis of types and quantity of solid waste generated and of management methods practiced by the households of Debre-Ziet town, East Shoa, Abstract of all students research projects, 83–84. Ethiopia: Jimma University.
- Miezah, K., K. Obiri-Danso, Z. Kádár, B. Fei-Baffoe, and M. Y. Mensah. 2015. Municipal solid waste characterization and quantification as a measure towards effective waste management in Ghana. Waste Manage. 46:15–27. doi:https://doi.org/10.1016/j.wasman.2015.09.009.
- Mulu, T., and W. Legesse. 2005. Analysis of the type and amount of Solid Waste generated and adopted Disposal Methods by the Residents of Bonga City. Ethiop. J. Health Sci. 15 (2):157–65.
- Nor Faiza, M. T., N. A. Hassan, R. Mohammad Farhan, M. A. Edre, and R. M. Rus. 2019. Solid waste: Its implication for health and risk of vector borne diseases. J. Waste Biomass Manage. 1 (2):14–17. doi:https://doi.org/10.26480/jwbm.02.2019.14.17.
- Odonkor, S. T., K. Frimpong, and N. Kurantin. 2020. An assessment of house-hold solid waste management in a large Ghanaian district. Heliyon 6. doi:https://doi.org/10.1016/j.heliyon.2019.e03040.
- Onibokun, A. G. 1999. Managing the monsters: Urban waste and governance in Africa. Ottawa, Canada: International Development Research Centre Ottawa.
- Osman Saeed, M., M. N. Hassan, and M. A. Mujeebu. 2009. Assessment of municipal solid waste generation and recyclable materials potential in Kuala Lumpur, Malaysia. Waste Manage. 29 (7):2209–13. doi:https://doi.org/10.1016/j.wasman.2009.02.017.
- Regassa, N., R. D. Sundaraa, and B. Bogale. 2011. Challenges and opportunities in municipal solid waste management: The case of Addis Ababa city, central Ethiopia. J. Human Ecol. 33 (3):179–90. doi:https://doi.org/10.1080/09709274.2011.11906358.
- Shaoli, D., and B. Debnath. 2016. Prevalence of health hazards associated with solid waste disposal- A case study of Kolkata, India. Procedia Environ. Sci. 35 (2016):201–08. doi:https://doi.org/10.1016/j.proenv.2016.07.081.
- Sharholy, M., K. Ahmad, G. Mahmood, and P. C. Trivedi. 2008. Municipal solid waste management in Indian cities- A review, waste management. 28(2):459–67. doi:https://doi.org/10.1016/j.wasman.2007.02.008.
- Sharma, H. R., T. Abebe, M. Admassu, T. Teshaye, T. Aseffa, and M. Emana. 2011. Municipal solid waste management and community awareness and involvement in management and practice: An overview and a case study from Gondar town of Ethiopia. Int. J. Environ. Waste Manage. 7 (3/4):294–304. doi:https://doi.org/10.1504/IJEWM.2011.039470.
- Tewodros, T., R. Arjan, and H. Fitsum. 2008. Household waste disposal in Mekele city, Northern Ethiopia. Waste Manage. 28 (10):2003–212. doi:https://doi.org/10.1016/j.wasman.2007.08.015.
- UN-HABITAT. 2012. Collection of municipal solid waste, key issues for decision- makers in developing countries.
- United Nations Environmental Programme (UNEP). 2009. Developing integrated solid waste management plan training manual, 2: Assessment of current waste management systems and gaps therein. Osaka/Shiga, Japan.
- United Nations Environmental Programme (UNEP). 2010a. Framework of global partnership on waste management, Note by Secretariat, UNEP. http://www.unep.or.jp/Ietc/SPC/news-nov10/3FrameworkOfGPWM.
- United Nations Environmental Programme (UNEP). 2010b. Waste and climate change - Global trends and strategy framework. http://hdl.handle.net/20.500.11822/8648.
- United Nations Industrial Development Organization (UNIDO). 2002. Annual report.
- Vikrant, T., S. Fantaw, and H. R. Sharma. 2014. Municipal solid waste management in Debre Berhan City of Ethiopia. J. Environ. Earth Sci. 4 (5):2225–948.
- World Bank. 2011. Urban environmental sanitation project, staff appraisal report. Republic of Ghana: Africa Regional Office.