
 ?Mathematical formulae have been encoded as MathML and are displayed in this HTML version using MathJax in order to improve their display. Uncheck the box to turn MathJax off. This feature requires Javascript. Click on a formula to zoom.
ABSTRACT
Modeling and prediction of H2S emission from wastewater are important since gaseous H2S will induce significant corrosion and odor problems. Most previous studies focused on H2S emission of wastewater in pipeline systems, which may not be fit for H2S emission in wastewater treatment plants (WWTPs). This study provided a two-phase mass transfer model for prediction of H2S emission concentrations. The model is based on the mass transfer rate equation of the mass transfer impetus, expressed by the concentration difference. The main parameters of the model are the mass transfer coefficient, the carrier gas flow rate and the concentration of H2S in liquid phase. The results showed that the model can simulate and predict H2S emission concentrations of various processes in WWTPs. Moreover, the model can analyze and predict the influences of different pH values, mass transfer coefficients and carrier gas flow rates on H2S emission concentrations and loads. Therefore, the model provides theoretical guidance for design of WWTPs regarding H2S emissions.
Implications: Modeling and prediction of H2S emission from wastewater are quite important since gaseous H2S will induce significant corrosion and odor problems. Most of previous studies are focused on H2S emission from wastewater in pipeline system, which may not be fit for H2S emission in wastewater treatment plants (WWTPs). Thus in this study, a model for predicting H2S emission from typical units of WWTPs is established and verified. Moreover, the influences of pH values, mass transfer coefficients and carrier gas flow rates on H2S emission are analyzed. The model can be a useful tool to predict the H2S concentration in odor gas collection system of WWTP and understand the behaviors of H2S emission under different WWTPs operating conditions.
Introduction
While improving the water environment, urban wastewater treatment plants (WWTPs) are also associated with malodorous pollution, which is one of the most typical environmental problems in WWTPs (Pang et al. Citation2016). Eight types of compounds, ammonia, hydrogen sulfide, methyl mercaptan, methyl sulfide, dimethyl disulfide, carbon disulfide, styrene and xylene used by WWTPs can produce malodors (Yanji Citation1992). Hydrogen sulfide (H2S) is considered to be a dominant contributor to odorous compound emissions in WWTPs (Li, Yang, and Li Citation2018). In addition, H2S volatilized from water surfaces is the main component of sulfide odor pollution. H2S concentrations above 1 mg/L can not only seriously affect the surrounding living environment but can also harm human health (Wu et al. Citation2006). Therefore, odor contamination in WWTPs has recently become a significant global environmental problem (He et al. Citation2018).
Over the past few years, capping and other malodorous treatment techniques, such as biodegradation, adsorption and photocatalysis, have been used to control H2S emissions in WWTPs (Estrada et al. Citation2011; Xi and Hu Citation2006). Each method has different characteristics regarding the processes and the scope of its applications. Thus, research into the emission characteristics of odorous substances can act as a basis for the selection and design of deodorization schemes for WWTPs. However, many factors affect the emissions of odorous substances (Jung et al. Citation2017), and it is difficult to control the site conditions of WWTPs. Therefore, it is important to predict H2S emissions using structural parameters and sewage conditions, which are combined to simulate H2S emissions.
Both wastewater quality and turbulence can affect the release of H2S (Beghi et al. Citation2012). Thus, it is necessary to create a model of the H2S emission concentrations of wastewater to evaluate the pollution levels of H2S under different circumstances (Sharma et al. Citation2008). Lahav et al. (Citation2004), Lahav, Sagiv, and Frisdler (Citation2006) built a model of H2S released from wastewater in pipes based on the two-film theory. In this model, the effects of the wastewater temperature, average flow velocity and sectional area on the release of H2S were analyzed in terms of the mass transfer coefficient. Yongsiri, Vollertsen, and Hvitved-Jacobsen (Citation2005) established a similar model of H2S released from wastewater in pipes; this model was also based on the two-film theory. However, in the study by Yongsiri et al., the calculation of the mass transfer coefficient was connected to the aeration rate of wastewater. Santos et al. (Citation2012) constructed a model of H2S release in WWTPs based on the two-film theory and used a sodium sulfide solution instead of wastewater. However, the discussion focused on the effect of the air flow rate above the wastewater on the mass transfer coefficient of H2S, and the effect was not clear. Generally, H2S release models are based on the two-film theory, and they simulate the mass transfer coefficient of H2S in different ways.
At present, the WATER9 model, compiled by the US Environmental Protection Agency, is the dominant model used for gas emissions from sewage (Calvo et al. Citation2018). This model relies on parameters related to the structure of WWTPs, wastewater properties and theoretical models, such as gas volatilization, biodegradation, chemisorption, photochemical reactions and hydrolysis (Dai Xiaobo et al. Citation2012). In the model, the volatilization rates of volatile organic compounds (VOCs) in structures are calculated to estimate exhaust emissions in the wastewater treatment process. The WATER9 model provides a database of more than 100,000 organic compounds. The model only calculates the emissions of organic compounds and not those of inorganic substances.
Currently, most studies are focused on wastewater in pipes (Liang et al. Citation2019), which is not suitable for WWTPs. In addition, the WATER9 model is used to calculate the emissions of VOCs. Few studies have focused on H2S emissions in WWTPs, and the analysis of the influencing factors is insufficient. Therefore, H2S emissions in a WWTP in Suzhou were analyzed and studied here. An H2S emission concentration model was established and combined with a two-phase mass transfer process. The results showed that the model can accurately and quickly predict H2S emissions from wastewater.
Model development
Model assumptions
To simplify the model analysis and resolution, the following assumptions are made (Wei et al. Citation2018; Xi et al. Citation2015):
H2S volatilization on a water surface conforms to the two-mode theory of mass transfer from a liquid phase to a gas phase (Jin and Kim Citation2018).
The absorption rate of the liquid-to-gas mass transfer process is mainly controlled by the absorption resistance of the liquid film.
This is a steady-state model.
Conceptual model and equations
Under these assumptions, the H2S emission concentration model can be simplified to a conceptual model, as shown in .
Figure 1. Conceptual model of the H2S emission process
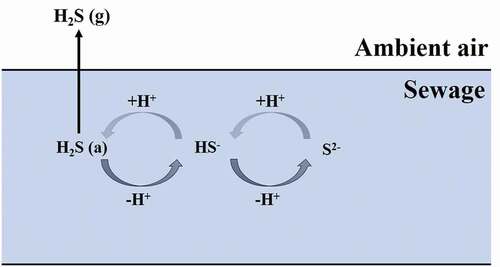
The difference in H2S concentration between the gas-liquid two-phase flow is used to indicate the mass transfer driving force (Jeanmairet et al. Citation2015; Jin and Kim Citation2018). According to the mass transfer rate equation, the following equation can be defined (Seader, Henley, and Roper Citation1998):
where KL is the mass transfer coefficient with the liquid phase concentration difference as the mass transfer power (m/min), N is the emission flux of H2S (mg/(m2·min)), CH2S is the concentration of H2S in the liquid phase (mg/m3) and C*H2S is the H2S concentration in the liquid phase equilibrated with the gas phase (mg/m3).
The emission flux can be defined using the following equation (Seader, Henley, and Roper Citation1998):
where C is the H2S concentration in the gas phase (ppm), M is the molar mass of H2S (34 g/mol), v is the carrier gas flow (m3/min), L is the molar volume of the gas (22.4 L/mol) and A is the water area (m2).
The H2S concentration in the liquid phase is related to the pH value and sulfide content of the sewage, and the correlation can be derived as follow (Tian et al. Citation2020):
where KS1 and KS2 are the primary and secondary ionization equilibrium constants of H2S, respectively, CH2S is the H2S concentration in the liquid phase and ST is the concentration of total dissolved sulfide in the wastewater (mg/m3).
The H2S concentration in the liquid phase when equilibrated with the gas phase is expressed as C*H2S. According to Henry’s law (Skinner Citation1975), the following equation can be drawn:
where P is the standard atmospheric pressure (101.3 kPa), ρ is the density of water (1.0 × 10³ kg/m3), E is the Henry coefficient (kPa) and MS is the molar mass of water (18 g/mol).
The H2S emission concentration model is obtained by substituting EquationEquations (2)(2)
(2) and (Equation4
(4)
(4) ) into EquationEquation (1)
(1)
(1) :
Materials & methods
Overview of the WWTP
The validation experiments were carried out in a WWTP located in Suzhou. The first-stage treatment scale of the WWTP was 8 × 10⁴ m3/d, and the second-stage treatment scale was 10 × 104 m3/d. The sewage was first pumped into the grid and the primary sedimentation tank for primary treatment and subsequently entered the UNITANK process for secondary treatment. The secondary effluent was discharged after flocculation, precipitation and ultraviolet disinfection. The sludge was passed through concentration and mud storage tanks, dewatered by a belt filter press and then transported.
Pilot test equipment
In November 2015, a pilot plant test was conducted to continuously monitor the emission concentrations of H2S. The pilot plant was located near the water intake area of the WWTP, in an area including the intake pump, sewage regulating tank, sewage tank, pipeline and air pump. The sewage was pumped up to the sewage regulating tank and then flowed into the sewage tank. Air was injected above the liquid level of the sewage tank, and the H2S concentration in the gas was continuously measured at the outlet of the whole sewage tank after the gas had through the tank. The pilot device was completely closed, and a schematic diagram of the device is shown in .
Figure 2. Schematic diagram of the pilot experiment
Monitoring index and method
The dissolved sulfide concentration, pH, water temperature, H2S concentration, carrier gas flow and other indicators were monitored. The dissolved sulfide was filtered through 0.45-μm filter membranes and the sulfide concentration was determined using the methylene blue spectrophotometric method. The water temperature and pH were measured using a portable water quality analyzer (KRK KP-5Z, Beijing Jing Ke Weiye Experimental Equipment Co., Ltd.). The H2S concentration was measured with a H2S sensor (CairClip, Cairpol France). The carrier gas flow was controlled by opening and closing the valve and was measured by an impeller anemometer (TESTO 416, German Instrument International Trading (Shanghai) Co., Ltd.).
Parameter estimation and sensitivity analysis
Mass transfer coefficient
In EquationEquation (5)(5)
(5) , KL, which represents the mass transfer coefficient with the liquid phase concentration difference as the mass transfer power, was determined using a pilot test. The results and parameters of the pilot test are shown in .
Table 1. Experimental results and parameter values
According to the H2S emission concentration model, the following equation relating to the mass transfer coefficient (KL) can be drawn:
By setting X as 22.4AECH2S-4.3 × 10⁻⁶AC and Y as 34vEC, the linear equation can be expressed as Y = KL X. The results of the pilot test in are substituted into EquationEquation (6)(6)
(6) , and the following graph in can be drawn.
Figure 3. Linear regression equation of KL
The calculation results shown in indicate that the mass transfer coefficient (KL) value is relatively stable at 0.02 m/min.
Parameter values
Based on the experimental conditions, the parameter values selected for the model are shown in .
Table 2. Values of model parameters
Model verification
To verify the accuracy of the model, the concentration of H2S in the gas phase near the intake area was investigated and compared with the closed WWTP structures. Indexes, including the H2S emission concentration, pH value, water temperature and carrier gas flow, were continuously monitored from the pump house and the primary sedimentation tank in the WWTP. The predicted concentrations of H2S were obtained after the relevant parameters were inputted into the model. The correlation between the predicted concentrations and the measured concentrations was analyzed, and the graph in was plotted. The calculation results shown in demonstrated that the predicted concentrations were well-correlated with the measured concentrations, with an R2 of 0.8714. This suggested that the above H2S emission concentration model is reliable.
Figure 4. Correlation analysis between the predicted concentrations and actual concentrations of H2S
Model application
The H2S emission concentration model established in this study can predict the emission concentrations of structures in WWTPs. Different factors affecting H2S emission concentrations can be analyzed and predicted in this model. Assuming that the water area of a WWTP was 100 m2, the water temperature was 20°C, and the concentration of total dissolved sulfide in the sewage was 0.5 mg/L, the effects of the pH value, mass transfer coefficient (KL) and carrier gas flow (v) on H2S emission concentrations were investigated.
Effects of pH value on H2S emission concentrations
Based on a mass transfer coefficient of 0.02 m/min and carrier gas flow of 20 m3/min, the results in show the changes in H2S emission concentrations under different pH levels (0–14).
Figure 5. Changes in H2S emission concentrations and emission loads under different pH values predicted by the model
The results in show that the variation trend of H2S emission concentrations with varying pH values is similar to that of the equivalent emission loads. With a pH value less than or equal to 6, the H2S emission concentrations and emission loads were both very high. When the pH value was greater than 6 but less than or equal to 9, the H2S emission concentrations and emission loads decreased as the pH value increased. When the sewage was highly alkaline, the H2S emission concentrations and emission loads were at their lowest and could almost be ignored. Yan, Ye, and Zhang (Citation2018) revealed the effect of pH on H2S emissions from sewage sludge. The results indicated that H2S volatile concentrations at the surface increased with decreasing pH values, and the amount of released H2S varied depending on the pH range. A similar conclusion was obtained by Chen et al. (Citation2017), whereby the H2S emission concentrations of treatment units in the inlet area were negatively correlated with the pH of the sewage, and the H2S concentrations dropped below 5 mg/m3 when the pH value of sewage was higher than 7.2.
Effects of the mass transfer coefficient parameter on H2S emission concentrations
Based on a pH equal to 7 and carrier gas flow equal to 20 m3/min, the results in show the changes in H2S emission concentrations under different mass transfer coefficients (0.02, 0.04, 0.06, 0.08, 0.1, 0.2, 0.3, 0.4 and 0.5 m/min).
Figure 6. Changes in H2S emission concentrations and emission loads under different mass transfer coefficients predicted by the model
The results in show that the variation trend of H2S emission concentrations with varying mass transfer coefficients was similar to that of emission loads. The emission concentrations and loads of H2S increased with increasing KL. In particular, this increase was rapid when KL was less than 0.1 m/min, and the increase was slow and then stable when KL was greater than 0.1 m/min. It has been reported that a low mass transfer coefficient affects the removal efficiency of H2S (Liu et al. Citation2015). This may be related to the lower H2S volatile concentration at the surface when the mass transfer coefficient is low.
Effects of the carrier gas flow parameter on H2S emission concentrations
Based on a pH equal to 7 and a mass transfer coefficient of 0.02 m/min, the results in show the changes in H2S emission concentrations under different carrier gas flows (0, 20, 40, 60, 80, 100, 120, 140, 160, 180 and 200 m3/min).
Figure 7. Changes in H2S emission concentrations and emission loads under different carrier predicted by the model
The results in suggest that the H2S emission concentrations decreased and the H2S emission loads increased with increasing carrier gas flow. When the carrier gas flow increased from 0 to 20 m3/min, the changes in H2S emission concentrations and emission loads were rapid. When the carrier gas flow was more than 20 m3/min, the changes were first slow and then stable.
Conclusion
A theoretical model of H2S emission is constructed in this study. and is verified with a WWTP in Suzhou, China. Main conclusions are as follow: H2S emission concentration and H2s emission load is unaffected in extremities of the pH range, but greatly decreases between 5–8. Gradient of H2S emission concentration gradually flatten with the increase in mass transfer coefficient. Dramatic increase in H2S emission load is evident with the increase in carrier gas flow from 0–20 m3/min, while the inverse was seen in H2S emission concentration. Although additional verification would further corroborate the accuracy of the model, evidence gathered hitherto confirmed the relevance and efficacy of the model presented in this study, and would provide theoretical ground for estimations of H2S emissions in WWTPs in general.
Supplemental Material
Download MS Word (24.9 KB)Acknowledgment
The Major Science and Technology Program for Water Pollution Control and Treatment of China (Grant No. 2011ZX07301-003).
Disclosure statement
The authors declare no conflicts of interest. The funding sponsors had no role in the design of the study; in the collection, analyses, or interpretation of data; in the writing of the manuscript; or in the decision to publish the results.
Supplementary material
Supplemental data for this paper can be accessed on the publisher’s website.
Additional information
Funding
Notes on contributors
Lan Tian
Lan Tian is a ph.D. student in School of Environment, Tsinghua University majoring in Environmental Science.
Caiyun Han
Caiyun Han was a research fellow in Research Institute for Environmental Innovation (Suzhou) Tsinghua.
Jingyu Zhang
Jingyu Zhang was a research fellow in School of Environment, Tsinghua University.
Yun Ouyang
Yun Ouyang was a master student in School of Environment, Tsinghua University.
Jinying Xi
Jinying Xi is an associate professor in School of Environment in Tsinghua University.
References
- Beghi, S. P., A. C. Rodrigues, L. M. De-Sá, and J. Santos. 2012. Estimating hydrogen sulphide emissions from anaerobic Lagoon[J]. Chem. Eng. 30:91–96.
- Calvo, M. J., A. J. Prata, L. Hoinaski, J. M. Santos, and R. M. Stuetz. 2018. Sensitivity analysis of the WATER9 model: Emissions of odorous compounds from passive liquid surfaces present in wastewater treatment plants[J]. Water Sci. Technol. 77:903–12. doi:https://doi.org/10.2166/wst.2018.271.
- Chen, M., R. Chen, Y. Shi, J. Wang, Y. Cheng, Y. Li, and B. Z. Tang. 2017. Malonitrile-functionalized tetraphenylpyrazine: aggregation-induced emission, ratiometric detection of hydrogen sulfide, and mechanochromism[J]. Adv. Funct. Mater. 28(6):903–912.
- Dai Xiaobo, Q. X., H. Jinping, W. Wenchen, and C. Xuanwen. 2012. Quantitative estimate of unorganized emission of VOCs from petroleum refinery wastwater treatment. Journal of Shanghai Ship and Shipping Research Institute 1.
- Estrada, J. M., N. J. R. B. Kraakman, R. Muñoz, and R. Lebrero. 2011. A comparative analysis of odour treatment technologies in wastewater treatment plants[J]. Environ. Sci. Technol. 45 (3):1100–06. doi:https://doi.org/10.1021/es103478j.
- He, K., S. Echigo, Y. Asada, and S. Itoh. 2018. Determination of caffeine and its metabolites in wastewater treatment plants using solid-phase extraction and liquid chromatography–tandem mass spectrometry[J]. Anal. Sci. (34). doi:https://doi.org/10.2116/analsci.34.349.
- Jeanmairet, G., M. Levesque, V. Sergiievskyi, and D. Borgis. 2015. Molecular density functional theory for water with liquid-gas coexistence and correct pressure[J]. J. Chem. Phys. 142 (15):1930–37. doi:https://doi.org/10.1063/1.4917485.
- Jin, H. K., and W. T. Kim. 2018. Numerical investigation of gas-liquid two-phase flow inside PEMFC gas channels with rectangular and trapezoidal cross sections[J]. Energies 11 (6):1403. doi:https://doi.org/10.3390/en11061403.
- Jung, D., L. Hatrait, J. Gouello, A. Ponthieux, V. Parez, and C. Renner. 2017. Emission of hydrogen sulfide (H2S) at a waterfall in a sewer: Study of main factors affecting H2S emission and modeling approaches[J]. Water Sci. Technol. 76 (9–10):2753. doi:https://doi.org/10.2166/wst.2017.428.
- Lahav, O., A. Sagiv, and E. Frisdler. 2006. A different approach for predicting H2S(g) emission rates in ravity sewers[J]. Water Res. 40 (2):259–66. doi:https://doi.org/10.1016/j.watres.2005.10.026.
- Lahav, O., Y. Lu, U. Shavit, and R. E. Loewenthal. 2004. Modeling hydrogen sulfide emission rates in gravity sewage collection systems[J]. J. Environ. Eng. 130 (11):1382–89. doi:https://doi.org/10.1061/(ASCE)0733-9372(2004)130:11(1382).
- Li, W. F., W. H. Yang, and J. Y. Li. 2018. Characterization and prediction of odours from municipal sewage treatment plant[J]. Water Sci. Technol. 77 (3):762–69. doi:https://doi.org/10.2166/wst.2018.233.
- Liang, Z. S., L. Zhang, D. Wu, G.-H. Chen, and F. Jiang. 2019. Systematic evaluation of a dynamic sewer process model for prediction of odor formation and mitigation in large-scale pressurized sewers in 17[J]. Water Res. 154:94–103. doi:https://doi.org/10.1016/j.watres.2019.01.033.
- Liu, D., R. R. Andreasen, T. G. Poulsen, and A. Feilberg. 2015. A comparative study of mass transfer coefficients of reduced volatile sulfur compounds for biotrickling filter packing materials[J]. Chem. Eng. J. 260:209–21. doi:https://doi.org/10.1016/j.cej.2014.08.070.
- Pang, B. W., C. H. Jiang, M. Yeung, Y. Ouyang, and J. Xi. 2016. Removal of dissolved sulfides in aqueous solution by activated sludge: Mechanism and characteristics[J]. J. Hazard. Mater. 324 (PtB):732–38. doi:https://doi.org/10.1016/j.jhazmat.2016.11.048.
- Santos, J. M., V. Kreim, J. Guillot, N. C. Reis Jr, L. M. de Sá, and N. J. Horan 2012. An experimental determination of the H2S overall mass transfer coefficient from quiescent surfaces at wastewater treatment plants[J]. Atmos. Environ. 60:18–24. doi:https://doi.org/10.1016/j.atmosenv.2012.06.014.
- Seader, J. D., E. J. Henley, and D. K. Roper. 1998. Separation process principles[M]. Atmospheric Environment 25:123–24.
- Sharma, K. R., Z. Yuan, D. De-Haas, G. Hamilton, S. Corrie, and J. Keller. 2008. Dynamics and dynamic modelling of H2S production in sewer system[J]. Water Res. 42 (10–11):2527–38. doi:https://doi.org/10.1016/j.watres.2008.02.013.
- Skinner, G. B. 1975. Fundamentals of physical chemistry[M].
- Tian, G., J. Xi, M. Yeung, and G. Ren. 2020. Characteristics and mechanisms of H2S production in anaerobic digestion of food waste[J]. Sci. Total Environ. 724:137977. doi:https://doi.org/10.1016/j.scitotenv.2020.137977.
- Wei, N., C. Xu, Y. Meng, G. Li, X. Ma, and A. Liu. 2018. Numerical simulation of gas-liquid two-phase flow in wellbore based on drift flux model[J]. Appl. Math. Comput. 338:175–91. doi:https://doi.org/10.1016/j.amc.2018.03.067.
- Wu, B. Z., T. Z. Feng, U. Sree, K. H. Chiu, and J. G. Lo. 2006. Sampling and analysis of volatile organics emitted from wastewater treatment plant and drain system of an industrial science park[J]. Anal. Chim. Acta. 576 (1):100–11. doi:https://doi.org/10.1016/j.aca.2006.03.057.
- Xi, J. Y., and H. Y. Hu. 2006. Performance of biofilters for the removal of VOCs[J]. Environ. Sci. Technol. 29 (10):106–08.
- Xi, J., I. Kang, H. Hu, and X. Zhang. 2015. A biofilter model for simultaneous simulation of toluene removal and bed pressure drop under varied inlet loadings[J]. Front. Env. Sci. Eng. 9 (3):554–62. doi:https://doi.org/10.1007/s11783-014-0671-z.
- Yan, L., J. Ye, and P. Zhang. 2018. Hydrogen sulfide formation control and microbial competition in batch anaerobic digestion of slaughterhouse wastewater sludge effect of initial sludge pH[J]. Bioresour. Technol. 259:67–74. doi:https://doi.org/10.1016/j.biortech.2018.03.011.
- Yanji, W. 1992. On the technical line for formulation of concentration control standard value in unorganized discharge of odor substance[J]. Res. J. Environ. Sci. 1.
- Yongsiri, C., J. Vollertsen, and T. Hvitved-Jacobsen. 2005. Influence of wastewater constituents on hydrogen sulfide emission in sewer network[J]. J. Environ. Eng. 131 (12). doi:https://doi.org/10.1061/(ASCE)0733-9372(2005)131:12(1676).