
 ?Mathematical formulae have been encoded as MathML and are displayed in this HTML version using MathJax in order to improve their display. Uncheck the box to turn MathJax off. This feature requires Javascript. Click on a formula to zoom.
ABSTRACT
Plastics have multiple applications in disposable products, high-end technology parts, etc., owing to their functionality and manufacturing flexibility. However, their increased use has increased the global proportion of plastic wastes, which creates a serious environmental issue, thereby, creating a demand for plastic waste management techniques. Improving the efficiency of resource recovery by appropriate sorting and collection systems is necessary for successful plastic recycling. Therefore, this study proposed a three-step optimization process of a reverse vending machine (RVM), a small automatic recyclable waste sorter/collector system, for acquiring an optimal design and enhanced efficiency. The RVM system categorized recyclable wastes as plastics, glass, and cans using barcode, vision, and near infrared sensors. The average sorting efficiency of the designed RVM system was 94%, 95% for polyethylene terephthalate, and 98% for glass bottles. Therefore, the RVM system, with the average sorting efficiency of 95%, is suitable for application in on-site sorting in small-sized areas, such as convenience stores, which generate wastes on a small scale.
Implications: This study proposed a three-step optimization process of a reverse vending machine (RVM), a small automatic recyclable waste sorter/collector system, for acquiring an optimal design and enhanced efficiency. The RVM system is suitable for application in on-site sorting in small-sized areas, such as convenience stores, which generate wastes on a small scale.
Introduction
Due to their multi-functionality and manufacturing flexibility, plastics have wide applications in disposable products, high-end technology parts, etc (Issifu and Sumaila Citation2020; Rajmohan et al. Citation2019). However, increased use of plastics generates plastic waste, which is a leading global problem. The total amount of plastics produced since 1950, which witnessed the beginning of plastic use, to 2015 was approximately 8.3 billion tons, which generated approximately 6.3 billion tons of plastic waste (Thompson et al. Citation2009), out of which 79% plastic wastes were landfilled, abandoned, or directly discarded on mountains and in the sea (Wagner Citation2017). If this trend continues, approximately 12 billion tons of plastic waste, which is equivalent to the combined weight of 25 000 Empire State Buildings, has been estimated to reach landfills or enter in the environment by 2050 (National Geographic Citation2018). Despite the long natural degrading time of plastics, plastic products are produced daily on a large scale to meet the growing demands (Andrady Citation2015; Nanda and Berruti Citation2020). Therefore, technologically advanced countries worldwide are establishing and implementing various industrial strategies and policies to promote the transition to a resource-recycling society by facilitating the use of recyclable resources (Zaman and Ahsan Citation2019). Among the regularly used resources, plastic has multiple industrial applications in electricity, automobiles, packaging materials, electronics, and construction. Thus, until plastic alternatives that have increased usability and functionality are developed, solving the problem of plastic waste is difficult.
Furthermore, the amount of plastic wastes generated in Japan was 9.3 million tons in 2012, which decreased marginally to 9 million tons in 2016 because of the implementation of the 3 R policy (reduce, reuse, and recycle) (Bom, Belbase, and Bibriven Lila Citation2017). Consequently, plastic waste disposal through landfills and incineration (excluding energy recovery) decreased from 19.9% in 2012 to 15.6% in 2016, while incineration, including energy recovery and recycling, increased significantly from 80.1% in 2012 to 84.4% in 2016 (Chow et al. Citation2017; Huysman et al. Citation2017). Moreover, the amount of plastic waste generated in the EU increased significantly from 24.9 million tons in 2008 to 27.1 million tons in 2016. However, plastic wastes that were landfilled decreased significantly from 12.1 million tons in 2008 to 7.4 million tons in 2016, while plastic waste disposal, including energy recovery and recycling, increased significantly from 12.6 million tons in 2008 to 19.7 million tons in 2016 (Drzyzga and Prieto Citation2019; Pazienza and De Lucia Citation2020). Furthermore, England generated 3.61 million tons of plastic wastes in 2012, which decreased to 3.25 million tons in 2014 (European Commission Citation2018), out of which the amount of plastic wastes that were landfilled decreased from 1.44 million tons in 2012 to 960 000 tons in 2014, while the wastes disposed using energy recovery and recycling increased from 2.17 million tons in 2012 to 2.29 million tons in 2014 (Wang et al. Citation2020).
In 2018, the Chinese government filed a petition with the World Trade Organization (WTO) to ban the import of 24 waste products belonging to four categories to safeguard the environment of their country (Huang et al. Citation2020, Citation2018). The ban on imports was limited to products having high pollution quotients because imported wastes mixed with hazardous wastes were being illegally imported into the country. In particular, China is a major importer of plastic wastes, accounting for approximately 50% of the total imported plastic waste globally; thus, the import ban is expected to cause a jolt on the worldwide plastic waste recycling (Liang et al. Citation2020).
In South Korea, changes in the consumption patterns of the public have indicated an increased plastic product consumption at convenience stores. The number of franchise convenience stores in South Korea increased rapidly from 11 300 in 2008 to 29 900 in 2015, 37 800 in 2017, and 40 950 in 2018 (Jang et al. Citation2020). Furthermore, according to the data from Statistics Korea, the annual number of convenience stores in South Korea has increased by approximately more than 3000 stores (Yasmin Citation2020). Therefore, developing recycling and recovery systems are urgently required to manage plastic wastes, glass, bottles, and cans generated because of the exponential increase in the number of convenient stores. Furthermore, increased importance of plastic recycling has created a need to improve the efficiency of resource recovery by implementing suitable sorting and collection systems for small-scale generation of recyclable wastes in areas, such as convenience stores (Heidbreder et al. Citation2019). Furthermore, optimizing technology to actively implement reverse vending machines (RVMs) that can be used for automatic sorting and local collection of recyclable waste is required. (Korucu et al. Citation2016).
According to previous studies, spectroscopic/optical technologies are highly accurate for classifying polymers (Gundupalli, Hait, and Thakur Citation2017; Wu et al. Citation2020).
In addition, extensive research has been conducted on designing sorting lines using cameras (Wen and Tao Citation2000); additionally, plastics that are difficult to sort are subjected to technologies with improved sorting efficiency using an imaging technology algorithm (Solis and Silveira Citation2020).
Application of technologies based on near infrared (NIR) sorting using Fourier transform infrared (FTIR) spectroscopy, which accurately identifies plastic polymers, for selective sorting has been increasing (Küppers et al. Citation2019; Wen and Tao Citation2000). Recent developments in various sensors have significantly upgraded their sorting efficiency and enabled sorting of increased specific products (Esmaeilian et al. Citation2018); however, increasing the sorting efficiency in this manner requires specific intervals for data collection to apply these sorting equipment and sensors, thereby increasing issues in the equipment.
This study proposes to optimize the design of the RVM sorting system to enhance the efficiency of installation in areas, such as convenience stores, that generate small-scale wastes. The results suggested that the RVM system could sort plastic wastes through barcode, vision, and near-infrared (NIR) sensing.
Methods
This study applied a sorting system for enhancing the waste sorting efficiency using a small sorter for wastes generated at convenience stores, having a high foot traffic in Seoul, South Korea. A pre-requisite of the small-scale recyclable sorting system was sorting recyclable items from convenience stores.
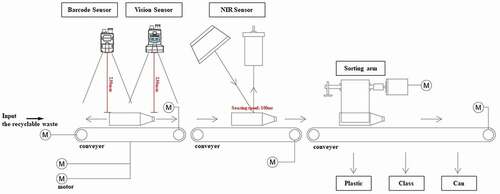
The first step involved primary sorting to separate the wastes as plastics, cans, and glass by scanning the barcode of the waste products using a camera sensor (). In the second step, two types of recyclable products were reviewed using a vision sensor, while the third step included the use of an optical NIR sensor to sort and classify plastic wastes as polyethylene terephthalate (PET), polystyrene (PS), polyethylene (PE), and polypropylene (PP).
Figure 1. Process flowchart of the sorting system
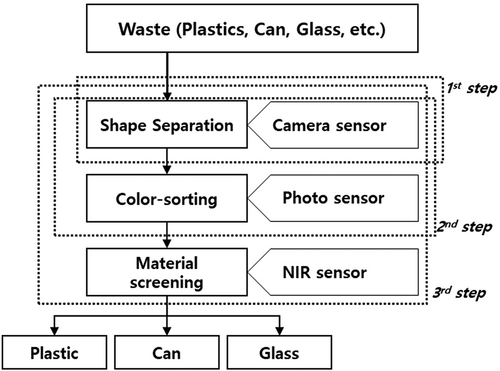
A database for the first sorting using the barcode camera sensor (DATAMAN 262X; Camera: DMR-260X-1110, Lens: 6.2 mm liquid lens, COGNEX) was constructed using the barcodes of plastic, can, and glass items sold at the studied convenience stores. To read the barcodes, a system that can read barcodes circularly and stop reading on inserting a recyclable waste was applied, using a camera positioned at a distance of 180–260 mm from the barcode to identify the minimal distance required to ensure sufficient space to install the sorting sensor in a small area. The second vision sensor (Model: IN-SIGHT 2000–120 C, COGNEX) was used to sort the beer and soju glass bottles that are most commonly used in South Korea. The distance from the vision sensor to the barcode was set at 200–280 mm to optimize the sorting efficiency. Finally, an NIR sensor (Model: SM304, Spectral Products) was used to separate plastic wastes by type. The distance of the barcode to the NIR sensor was fixed, and the sorting efficiency was determined by obscuring the NIR sensor by inserting other wastes types along with large amounts of plastic waste. Subsequently, the sorting efficiency for plastic containers was determined when the sensor was obscured by 80% and 50% of materials other than the target material. Based on these results, the efficiency was improved through a scattering process. Thus, this three-step sorting process was used to test the RVM sorting efficiency of recyclable wastes generated at convenience stores.
To quantify the performance of the proposed RVM system, the sorting efficiency was calculated using EquationEquation (1)(1)
(1) as follows:
where Ews is the Worrell-Stessel efficiency (Yuan et al. Citation2015), X is the target substance, and Y is the excluded substance. Subscripts k 0, 1, and 2, denote the recyclable waste input, recovery, and rejection, respectively. Owing to the sensors in the RVM system, the input amount of recyclable waste was defined as a summation of recovered and rejected waste as shown in EquationEquations (2)(2)
(2) – (Equation3
(3)
(3) ):
Results and discussion
Composition of the wastes generated from the convenience stores
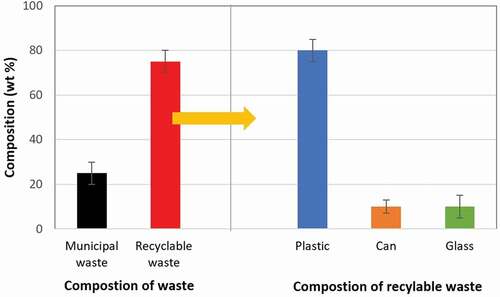
A comparative analysis of the composition of wastes generated from the convenience stores with a high foot traffic in Seoul showed that municipal waste accounted for 20%–30% of the total waste (). The remaining 70% included recyclable wastes, of which plastics, cans, and glass accounted for 75%–85%, 10%, and 5%–10% of the recyclable waste, respectively. Some areas witnessed wastes that were discarded on the ground due to full recycle bins, indicating the need for active recovery of recyclable wastes through a sorting system.
Figure 2. Composition of wastes generated from the convenience stores
Sorting efficiency by barcode sensor
Plastics, cans, and glass were sorted using a barcode sensor. During designing, the sorting efficiency was analyzed by changing the distance between the barcode sensor and the target material. A basic barcode database was established, based on which the composition of the wastes inserted into the sorter was identified and sorted into the three waste types.
Recyclable bottles exhibited different types of barcodes (horizontal or vertical), depending on their type and company. Subsequently, distance analysis was conducted using glass bottles with a barcode (50 mm diameter) attached horizontally and plastic bottles with a bar code (70 mm diameter) attached vertically ().
Figure 3. Sorting efficiency according to the distance from the barcode sensor
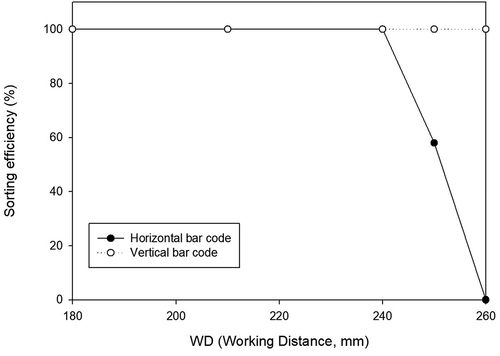
The sorting efficiency for vertical barcodes was 100%, regardless of the distance to the sensor, whereas the sorting efficiency for horizontal barcodes was 58% at a distance of 250 mm; however, the efficiency decreased to 0% when the distance was 260 mm. An error was observed when the sensor attempted to read both ends of the horizontal barcode and the efficiency decreased beyond a certain distance because of the small sensor diameter (50 mm). Thus, 240 mm was established as the optimal distance, which was applicable to the space of the small-scale sorting equipment.
Sorting efficiency by the vision sensor
The vision sensor was used to sort the previously sorted bottles again according to their color. Since most bottles from the convenience stores in South Korea were green-colored soju bottles and dark-colored beer bottles, the vision sensor was used to sort the two bottle types. shows the comparison results of the sorting efficiency of the two bottle types according to their distance from the vision sensor.
Table 1. Sorting efficiency for bottle wastes according to the vision sensor distance
The sorting efficiency of the vision sensor for bottles selectively sorted by color was 100% at a distance of ≤ 270 mm. However, the sensor could not analyze bottles at distances of ≥ 280 mm. Thus, bottle wastes could be sorted with ≥ 95% efficiency at distances of ≤ 270 mm, thereby, resolving the issue of distance-dependent sensor efficiency for small-sized sorter systems.
Sorting efficiency by the NIR sensor
The NIR sensor has been used to identify the composition of plastic bottles and sort them according to their main components (Tachwali, Al-Assaf, and Al-Ali Citation2007). The sensor sorted the wastes as PET, commonly used for plastic beverage bottles, and other plastics, such as PP and PE. Plastic bottles are typically made of PET with PE and PP caps. Assuming that the PET bottles were mixed with other plastics, this study assessed the sorting efficiency based on the plastic bottles that were not analyzed because they were obscured by 0%, 50%, and 80% by other materials. Additionally, the sorting efficiency was analyzed according to the change in the sensing interval of the NIR sensor. shows the results of plastic waste analysis and sorting efficiency according to the sensing interval.
Figure 4. Sorting efficiency according to the NIR sensor sensing interval and percentage of analyzable plastic
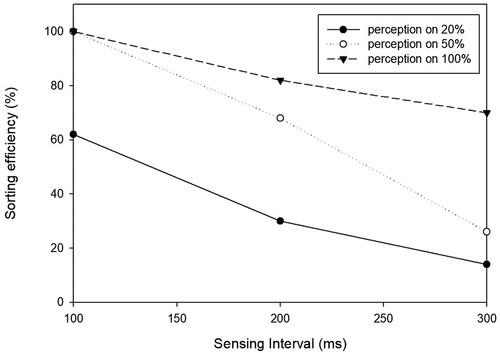
Consequently, the sorting efficiency of different plastic waste types decreased as the interval of the NIR sensor increased. The composition of plastic bottles required comprehensive analysis, but classification for assessing the distribution of the composition of the target materials decreased as the sensing interval of the sensor increased. Long interval decreased the distribution of the properties of the target materials. Moreover, the sorting efficiency was low (62%) when 80% of the plastic bottles were obscured and only 20% could be analyzed, despite conducting a comprehensive analysis. However, the sorting efficiency was 100% when 50% bottles were analyzed at an NIR sensing interval of 100 ms. Furthermore, when 100% materials were analyzed without any other materials, the sorting efficiency was 100% at the same sensing interval, but the efficiency decreased to 82% when the sensing interval was set to 200 ms. Therefore, 100 ms was the optimal sensing interval for analyzing plastic materials.
Optimal sorting efficiency of RVM
Based on the previous results, plastic wastes were sorted by barcode, vision, and NIR sensors (). The distance between the barcode sensor and vision sensor was 230 mm according to the bottle diameter and RVM size. Furthermore, the sensing interval of the NIR sensor was 100 ms. A rotating device was added to read the barcode on the glass bottles, cans, and plastic wastes, which were inserted into the system. Consequently, the sorted glass bottles were separated into beer and soju bottles using vision sorting, while plastics were separated into PET and other plastics. A high specific sorting was difficult because the sorter was placed near the convenience stores.
Figure 5. Schematics of the proposed reverse vending machine framework for convenience stores
shows the results of the application of the system (shown in ) to recyclable wastes generated from convenience stores. The results indicated that the sorting efficiency of the designed system for plastics, glass, and cans was 92%–96% with an average efficiency of 94%, while the sorting efficiency for PET was 93%–98% with an average of 95% using the three sorting steps. Similar to the high sorting efficiency of the vision sensor for glass bottles, the system showed a sorting efficiency of 96%–100% with an average of 98%.
Table 2. Waste sorting efficiency of the small RVM sorter
Existing municipal waste sorting equipment requires large space, and a long sorting interval for high sorting efficiency. However, the proposed RVM system, which provides satisfactory sorting results, requires minimal space and can thus, be used for on-site sorting in innermost city locations, such as convenience stores.
Conclusion
This study proposed a three-step optimal design for an RVM system that can be installed in areas, such as convenience stores, generating small-scale waste. The sorting efficiency of plastics, glass, and cans in the first step using the barcode sensor was 100% up to a distance of 240 mm from the sensor. Moreover, the sorting efficiency was higher for vertical barcodes than for horizontal barcodes. The vision sensor used in the second step showed a sorting efficiency of 100% at a distance of 270 mm of from the sensor for the sorting the bottles by color. In the final third step, the sensing interval of the NIR sensor of 100 ms showed the highest sorting efficiency. Consequently, application of the system designed based on these results in convenience stores showed an average sorting efficiency of the designed RVM system for plastics, glass, and cans as 94%, 95% for PET, and 98% for glass bottles. Therefore, the RVM system, with the average sorting efficiency of 95%, is suitable for application in small-sized areas, such as convenience stores for on-site sorting.
Highlights
► Increasing plastic waste emerging in the world.
► Need to improve the efficiency of resource recovery.
► Optimization of design of small reverse vending machine (RVM) to enhance the sorting.
► The system designed to apply for sorting recyclable waste from convenience stores.
Additional information
Funding
Notes on contributors
Daegi Kim
Daegi Kim (Ph.D.) is a professor of Department of Environmental Engineering, College of Engineering, Daegu University, Republic of Korea who conducts research using chemical and thermal reactions of waste and biomass to produce the renewable energy and the systems engineering of the waste management.
Sangyub Lee
Sangyub Lee is a director and an engineer of Research & Development division, Machine & Technology CO. LTD., Republic of Korea who is the veteran mechanical engineer of sorting systems of the municipal solid waste.
Minsoo Park
Daegi Kim (Ph.D.) is a professor of Department of Environmental Engineering, College of Engineering, Daegu University, Republic of Korea who conducts research using chemical and thermal reactions of waste and biomass to produce the renewable energy and the systems engineering of the waste management.
Minsoo Park is an engineer of Research & Development division, Machine & Technology CO. LTD., Republic of Korea who is the mechanical engineer of sorting systems.
Kwanyong Lee
Kwanyong Lee (Ph.D.) is a professor of Department of Environment & Health, Jangan University, Republic of Korea who focuses on the waste management and biological technology to generate the renewable energy.
Do-Yong Kim
Do-Yong Kim (Ph.D.) is a professor of Department of Environmental Engineering, Mokpo National University, Republic of Korea who conducts research using atmospheric models addressing air pollution and climate change and the environmental policy.
References
- Andrady, A. L. 2015. Plastics and environmental sustainability. Hoboken: Wiley. doi:https://doi.org/10.1002/9781119009405.
- Bom, U. B., S. Belbase, and R. Bibriven Lila. 2017. Public perceptions and practices of solid waste recycling in the city of laramie in Wyoming, USA. Recycling 2 (3):11. doi:https://doi.org/10.3390/recycling2030011.
- Chow, C. F., W. M. W. So, T. Y. Cheung, and S. K. D. Yeung. 2017. Plastic waste problem and education for plastic waste management. In Emerging practices in scholarship of learning and teaching in a digital era, edited by S. C. Kong, T. L. Wong, M. Yang, C. F. Chow, K. H. Tse, 125–40. Singapore: Springer.
- Drzyzga, O., and A. Prieto. 2019. Plastic waste management, a matter for the ‘community.’ Microb. Biotechnol. 12 (1):66–68. doi:https://doi.org/10.1111/1751-7915.13328.
- Esmaeilian, B., B. Wang, K. Lewis, F. Duarte, C. Ratti, and S. Behdad. 2018. The future of waste management in smart and sustainable cities: A review and concept paper. Waste Manag. 81:177–95. doi:https://doi.org/10.1016/j.wasman.2018.09.047.
- European Commission. 2018. A European strategy for plastics in a circular economy. https://eur-lex.europa.eu/legal-content/EN/TXT/?qid=1516265440535&uri=COM:2018:28:FIN .
- Gundupalli, S. P., S. Hait, and A. Thakur. 2017. A review on automated sorting of source-separated municipal solid waste for recycling. Waste Manag. 60:56–74. doi:https://doi.org/10.1016/j.wasman.2016.09.015.
- Heidbreder, L. M., I. Bablok, S. Drews, and C. Menzel. 2019. Tackling the plastic problem: A review on perceptions, behaviors, and interventions. Sci. Total Environ. 668:1077–93. doi:https://doi.org/10.1016/j.scitotenv.2019.02.437.
- Huang, B., X. Wang, H. Kua, Y. Geng, R. Bleischwitz, and J. Ren. 2018. Construction and demolition waste management in China through the 3R principle. Resour. Conserv. Recycl. 129:36–44. doi:https://doi.org/10.1016/j.resconrec.2017.09.029.
- Huang, Q., G. Chen, Y. Wang, S. Chen, L. Xu, and R. Wang. 2020. Modelling the global impact of China’s ban on plastic waste imports. Resour. Conserv. Recycl. 154:104607. doi:https://doi.org/10.1016/j.resconrec.2019.104607.
- Huysman, S., J. De Schaepmeester, K. Ragaert, J. Dewulf, and S. De Meester. 2017. Performance indicators for a circular economy: A case study on post-industrial plastic waste. Resour. Conserv. Recycl. 120:46–54. doi:https://doi.org/10.1016/j.resconrec.2017.01.013.
- Issifu, I., and U. R. Sumaila. 2020. A review of the production, recycling and management of marine plastic pollution. J. Mar. Sci. Eng. 8 (11):945. doi:https://doi.org/10.3390/jmse8110945.
- Jang, Y. C., G. Lee, Y. Kwon, J. H. Lim, and J. H. Jeong. 2020. Recycling and management practices of plastic packaging waste towards a circular economy in South Korea. Resour. Conserv. Recycl. 158:104798. doi:https://doi.org/10.1016/j.resconrec.2020.104798.
- Korucu, M. K., Ö. Kaplan, O. Büyük, and M. K. Güllü. 2016. An investigation of the usability of sound recognition for source separation of packaging wastes in reverse vending machines. Waste Manag. 56:46–52. doi:https://doi.org/10.1016/j.wasman.2016.06.030.
- Küppers, B., S. Schloegl, G. Oreski, R. Pomberger, and D. Vollprecht. 2019. Influence of surface roughness and surface moisture of plastics on sensor-based sorting in the near infrared range. Waste Manag. Res. 37 (8):843–50. doi:https://doi.org/10.1177/0734242X19855433.
- Liang, Y., Q. Tan, Q. Song, and J. Li. 2020. An analysis of the plastic waste trade and management in Asia. Waste Manag. 119:242–53. doi:https://doi.org/10.1016/j.wasman.2020.09.049.
- Nanda, S., and F. Berruti. 2020. Thermochemical conversion of plastic waste to fuels: A review. Environ. Chem. Lett. 19 (1):123–48. doi:https://doi.org/10.1007/s10311-020-01094-7.
- National Geographic. 2018. Here’s how much plastic trash is littering the earth. Accessed December 20, 2018. https://www.nationalgeographic.com/news/2017/07/plastic-produced-recycling-waste-ocean-trash-debris-environment//
- Pazienza, P., and C. De Lucia. 2020. The EU policy for a plastic economy: Reflections on a sectoral implementation strategy. Bus Strategy Environ. 29 (2):779–88. doi:https://doi.org/10.1002/bse.2445.
- Rajmohan, K. V. S., C. Ramya, M. R. Viswanathan, and S. Varjani. 2019. Plastic pollutants: Effective waste management for pollution control and abatement. Curr. Opin. Environ. Sci. Health 12:72–84. doi:https://doi.org/10.1016/j.coesh.2019.08.006.
- Solis, M., and S. Silveira. 2020. Technologies for chemical recycling of household plastics–A technical review and TRL assessment. Waste Manag. 105:128–38. doi:https://doi.org/10.1016/j.wasman.2020.01.038.
- Tachwali, Y., Y. Al-Assaf, and A. R. Al-Ali. 2007. Automatic multistage classification system for plastic bottles recycling. Resour. Conserv. Recycl. 52 (2):266–85. doi:https://doi.org/10.1016/j.resconrec.2007.03.008.
- Thompson, R. C., C. J. Moore, F. S. Vom Saal, and S. H. Swan. 2009. Plastics, the environment and human health: Current consensus and future trends. Philos. Trans. Royal Soc. B 364 (1526):2153–66. doi:https://doi.org/10.1098/rstb.2009.0053.
- Wagner, T. P. 2017. Reducing single-use plastic shopping bags in the USA. Waste Manag. 70:3–12. doi:https://doi.org/10.1016/j.wasman.2017.09.003.
- Wang, D., Y. T. Tang, G. Long, D. Higgitt, J. He, and D. Robinson. 2020. Future improvements on performance of an EU landfill directive driven municipal solid waste management for a city in England. Waste Manag. 102:452–63. doi:https://doi.org/10.1016/j.wasman.2019.11.009.
- Wen, Z., and Y. Tao. 2000. Dual-camera NIR/MIR imaging for stem-end/calyx identification in apple defect sorting. Trans. ASABE 43 (2):449. doi:https://doi.org/10.13031/2013.2724.
- Wu, X., J. Li, L. Yao, and Z. Xu. 2020. Auto-sorting commonly recovered plastics from waste household appliances and electronics using near-infrared spectroscopy. J. Clean. Prod. 246:118732. doi:https://doi.org/10.1016/j.jclepro.2019.118732.
- Yasmin, W. 2020. Sales revenue of convenience stores in South Korea 2013-2019. Accessed June 5, 2020. https://www.statista.com/statistics/710991/south-korea-sales-revenue-of-convenience-stores/ .
- Yuan, H., S. Fu, W. Tan, J. He, and K. Wu. 2015. Study on the hydrocyclonic separation of waste plastics with different density. Waste Manag. 45:108–11. doi:https://doi.org/10.1016/j.wasman.2015.01.037.
- Zaman, A., and T. Ahsan. 2019. Zero-waste: Reconsidering Waste Management for the Future. New York, Routledge.