
ABSTRACT
Ambient ozone measurements are often used as surrogates for personal exposures. Due to the limited number of central ozone monitors and varying personal behavioral patterns, some level of variability between ambient and personal exposures is expected. Low-cost sensors and different ways to capture personal activity patterns are being developed as an effort to improve the accuracy of exposure assessment. However, it is still most common to use the traditional approach of using unadjusted ambient concentrations as surrogates for personal exposures. To our knowledge, there has not been a meta-analysis that summarizes the findings from studies that investigated the differences between personal and ambient ozone. We conducted a literature search in PubMed and Science Direct for peer-reviewed studies reporting at least one of the following in a numeric format: 1) personal-ambient measurements, 2) personal-ambient slopes, or 3) personal-ambient correlations to identify and summarize existing studies that investigated personal and ambient ozone concentrations. Twenty-two articles met inclusion criteria and were included in our review. Ambient concentrations almost always overestimated personal exposures. A meta-analysis of slopes showed an overall personal-ambient slope of 0.21 (95% CI: 0.15, 0.27) with high heterogeneity (97%) across studies. The correlations between personal and ambient ozone varied dramatically across subjects from a strong positive (0.77) to a moderate negative correlation (−0.43). Our study found that ambient measurements are not accurate representations of personal exposure, while the magnitude of exposure measurement error varied across studies. Different sources of ozone and how they contribute to true exposure levels for individuals in complementary ways need to be better addressed. The effort to better understand the impact of traditional exposure assessment on the risk estimates must be emphasized along with efforts to improve the current exposure assessment approaches to provide context for interpreting the results from ozone epidemiological studies.
Implications: The traditional approach of using ambient ozone measurements as surrogates for personal exposures is likely to result in exposure misclassification, which is a well-recognized source of bias in epidemiological studies. There are efforts to characterize the differences between ambient and personal ozone measurements, though, to our knowledge, there has not been a meta-analysis that summarizes the findings of different studies. Better understanding of the pattern and magnitude of exposure error for ambient and personal ozone can provide directions for future studies and context for interpreting the results from ozone epidemiological studies.
Background
Ozone is one of six criteria pollutants regulated by the U.S. Environmental Protection Agency (EPA) National Ambient Air Quality Standards (NAAQS) and known to be associated with an array of adverse health effects, such as asthma and chronic obstructive pulmonary disease (COPD) (Guarnieri and Balmes Citation2014; Kurt, Zhang, and Pinkerton Citation2016; Nuvolone, Petri, and Voller Citation2018; US EPA Citation2020b). Ozone concentrations can be measured outdoors, indoors, or at the personal level. Ambient ozone is primarily created by chemical reactions between nitrogen oxides (NOX) and volatile organic compounds (VOCs) emitted by cars, power plants, industrial boilers, and other sources in the presence of sunlight (US EPA Citation2020d). Indoor ozone concentrations are affected by two main sources: 1) the infiltration of ambient ozone via natural and mechanical ventilation and through building cracks, and 2) indoor sources (e.g., some electrical devices, including some types of air purifiers) (Huang, Yang, and Gao Citation2019). Personal ozone exposure, which is most relevant when investigating the health effects of ozone, is likely to vary widely depending on the ambient concentration, indoor sources, time spent indoors and outdoors, as well as other personal behaviors, such as window opening. Ozone measurements show high spatial heterogeneity across microenvironments, in part due to its chemical reactivity. Therefore, ozone measurements from fixed ambient sites may not accurately capture individual exposure. Ambient, indoor, and personal exposures are interrelated. Ambient concentrations affect both indoor and personal concentrations; indoor sources of ozone affect indoor and personal exposure levels; and personal behaviors (e.g., time spent outside, window opening) can affect indoor concentrations as well as personal exposure levels.
Despite the expected variability between personal and ambient ozone exposures, it is common to use ambient concentrations, whether measured or modeled, as surrogates for personal exposure in epidemiological studies often without any effort to correct the measurement error or examine the potential bias in the calculated effect estimates. The minimum number of ozone monitoring sites required by the EPA is often insufficient to capture the spatial variability observed for ozone (Sadighi et al. Citation2018). In addition, time-activity patterns (e.g., time spent outdoors vs. indoors) and infiltration can have a substantial impact on personal exposure levels (US EPA Citation2020c). Therefore, the traditional exposure assessment approach that uses ambient concentrations from central stationary locations is highly subject to exposure measurement error (Ha et al. Citation2020; Liu, Delfino, and Koutrakis Citation1997), which highlights the importance of examining the potential bias in the study results caused due to the inaccurate characterization of ozone exposure. However, collecting personal level exposure data is often expensive for researchers and inconvenient for participants, making it not practical to adopt in large-scale cohort studies. Low-cost sensors are being developed and other modeling efforts are being made to improve exposure assessment for health studies. However, the characteristics and sensitivity of the newly developed sensors under real-world conditions need further examination (Fan et al. Citation2017).
A systematic assessment of exposure measurement error must be conducted as the use of ambient concentration as surrogates for personal exposure is still the dominant approach that is being used in most epidemiological studies. Although there have been efforts to understand and characterize the differences in personal- and ambient-level ozone concentrations, to our knowledge, there has not been a meta-analysis that summarized the findings from these available studies.
The objective of this review was to identify and summarize the existing studies that investigated personal and ambient ozone concentrations and identify ways to improve exposure assessment for ozone. There are different sources of exposure measurement error that can affect the accuracy of exposure assessment for ozone: spatial error, time-activity error, indoor sources, land-use regression model misspecification, and instrument error (Richmond-Bryant and Long Citation2020). This review is mainly focused on spatial error due to the use of ambient concentrations measured from central sites; we also consider the implications of personal behaviors. Both practical limitations of collecting highly resolved spatiotemporal ozone data and novel ways to address exposure measurement error considering three exposure environments (ambient, indoor, and personal) will need to be considered.
Methods
Literature search and study selection
A literature search was conducted in PubMed and Science Direct for peer-reviewed studies that measured both personal and ambient ozone concentrations up to October 5, 2020. Search terms used were: (ozone or O3) and (personal or individual) and (ambient or outdoor or population). Additional studies were identified from the reviewed articles as well as through a google scholar search. Studies that were not primary research articles as well as those that did not report the results of personal and ambient ozone measurements were excluded from this review. The final 22 studies included in this review reported at least one of the following in a numeric format.
Personal-ambient ozone measurements
Personal-ambient ozone slopes, or
Personal-ambient ozone correlations
Those that did not directly report numeric values were excluded (e.g., reporting the results only in figures).
Data extraction and analysis
Data extraction was conducted by two independent reviewers and any discrepancies were resolved by consensus. Study location, study population characteristics, study period, and monitoring period were extracted from each reviewed study along with personal, indoor (where available), and ambient ozone concentrations. Concentrations reported in μg/m3 or parts per million (ppm) were converted to parts per billion (ppb) to compare the results across the studies.
Three different metrics were examined and analyzed in this review.
Mean personal and ambient ozone measurements: Both aggregated and stratified values were included based on their availability within a given study. Scatterplots were created to understand the overall pattern shown in the reviewed studies. The data were also stratified by location (U.S., non-U.S.), which may indicate differences from potentially varying infiltration rates, personal behaviors, and in-building materials that may affect the observed ozone concentrations. The data were also stratified by the personal monitoring device type to understand the impact of differences in technology on the observed personal vs. ambient ozone concentrations.
Slopes between personal and ambient ozone measurements: Slopes between personal and ambient ozone concentrations were extracted with standard errors or 95% confidence intervals. Slopes of personal vs. ambient concentrations indicate the corresponding personal ozone concentration per unit increase in ambient ozone concentration. Studies providing slopes between personal and ambient concentrations, without controlling for other factors, such as time spent outdoors, were included in the meta-analysis. A random effects model (DerSimonian and Laird) was used for the meta-analysis of slopes using the “meta” package in R-3.6.3. In addition, the impact of air flow on the personal and ambient ozone association was examined with available data.
Correlations between personal and ambient ozone measurements: All reported correlation coefficients along with statistical significance were extracted at both aggregated and individual level in order to understand the variability that may be present across different studies as well as individuals. A relatively strong positive correlation (correlation coefficient close to 1) would indicate that ambient ozone concentrations are highly associated with personal ozone concentrations, while a weak positive correlation (correlation coefficient close to 0) would indicate that ambient ozone concentrations may not be good surrogates for personal exposure levels. A negative correlation would indicate that as one measurement increases the other measurement decreases.
As an additional sub-analysis, personal and indoor concentrations were compared where available.
Results
displays a flowchart of the study selection process. In total, 436 candidate articles were identified from PubMed and Science Direct for screening. In addition, 12 publications were identified from reviewed articles and via additional google scholar search. 22 articles met the inclusion criteria for analysis and were included in our review.
Figure 1. Study selection process for the review of personal and ambient measurements of ozone
summarizes the characteristics of the 22 reviewed studies. Twenty out of 22 studies reported numeric personal and ambient ozone concentrations. Eleven studies reported slopes between personal and ambient ozone. Four studies reported correlations ranging from aggregated to subject-level results.
Table 1. Characteristics of 21 reviewed studies relating personal and ambient ozone concentrations
Four studies (Koutrakis et al. Citation2005; Sarnat et al. Citation2005; Sarnat, Koutrakis, and Suh Citation2000; Te Chang et al. Citation2000) analyzed the data collected from the same monitoring campaigns conducted in Boston and Baltimore. Similarly, three studies (Dimakopoulou et al. Citation2017; Grivas et al. Citation2017; Karakatsani et al. Citation2017) analyzed the data that were collected from the same monitoring campaigns in Athens and Thessaloniki, Greece. However, each study was unique in the way the data were analyzed (e.g., data stratification based on season, monitoring session, location, and population characteristics) and the measures that were reported (e.g., ozone concentrations, slopes, or correlations).
Dimakopoulou et al. (Citation2017) and Karakatsani et al. (Citation2017) reported ozone measurements in μg/m3, which were converted to ppb. One study (Barkjohn et al., Citation2020) measured personal concentration over 48 hours, while the ambient measurements were made over two week-period. A few studies (Niu et al. Citation2018; Sarnat et al. Citation2006; Williams et al. Citation2012) restricted participation to nonsmoking participants.
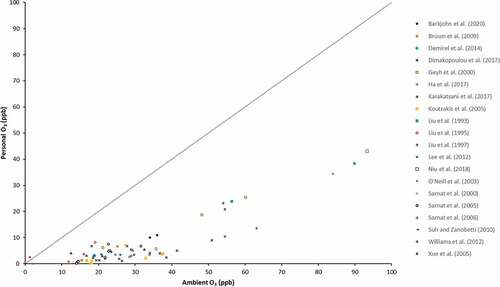
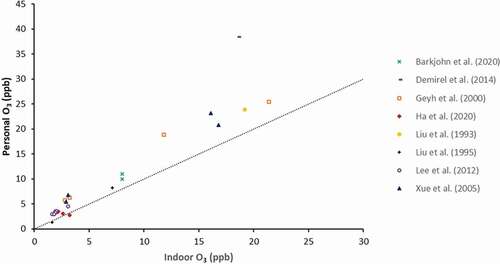
shows the reported personal and ambient (P-A) ozone concentrations from the 20 studies reporting these. All observations fell below the reference 1:1 line indicating that the ambient concentrations overestimated the personal ozone exposures. Personal to ambient ozone ratios ranged from 0 to 0.46, with an average of 0.18. The highest ratio was from the Niu et al. (Citation2018) study that measured personal and ambient ozone concentrations of 43 nonsmoking college students in Shanghai, China. In the Niu et al. (Citation2018) study, the aggregated mean personal concentration (43.1 ppb) was 46% of the mean ambient ozone concentration (93.3 ppb). Sarnat, Koutrakis, and Suh (Citation2000) found a ratio of 0 during their winter monitoring period. The mean personal ozone exposure of 20 seniors during the winter of 1999 was 0 ppb, while the mean ambient ozone concentration was 17.8 ppb. In conclusion, all aggregated personal ozone concentrations were lower than the mean ambient ozone concentrations across the 20 reviewed studies.
Figure 2. Scatter plot of mean personal and ambient ozone concentrations
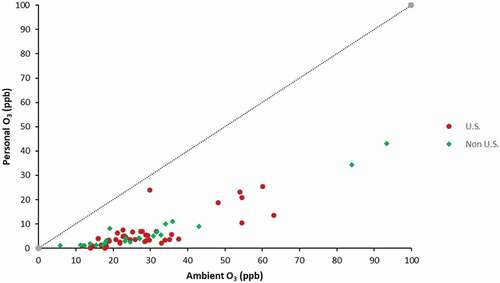
displays the mean personal and ambient ozone concentrations stratified by the location of the study (U.S. vs. non-U.S.). There were no statistically significant differences observed when comparing the results from the U.S. and non-U.S. studies. The average personal-ambient ozone ratios were 0.17 and 0.20 for the U.S. and non-U.S. studies, respectively.
Figure 3. Scatter plot of mean personal and ambient ozone concentrations for U.S and non-U.S. studies
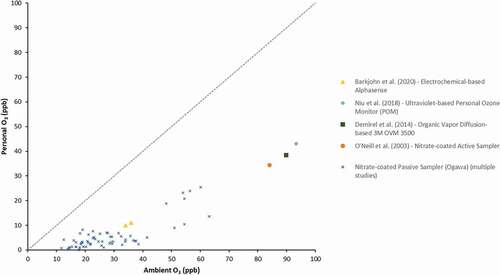
displays the personal and ambient ozone concentrations stratified by the type of device used for personal ozone sampling. 16 studies used nitrate-coated passive samplers (Ogawa) developed by Harvard University. Barkjohn et al. (Citation2020) used the Alphasense O3 device, which is a low-cost electrochemical ozone monitoring device that includes two sensors (one for NO2 and O3 and one for NO2 only). Niu et al. (Citation2018) used a miniaturized ozone monitor that uses ultraviolet absorption to measure ozone. Demirel et al. (Citation2014) employed a 3 M organic vapor diffusion-based ozone monitoring device using charcoal pads. O’neill et al. (Citation2003) used a nitrate-coated active ozone sampler with a small personal pump for sampling. There were no obvious differences between the personal and ambient ozone concentrations as measured by different personal monitoring devices in the reviewed studies. Three studies (Demirel et al. Citation2014; Niu et al. Citation2018; O’neill et al. Citation2003) that used personal monitoring devices other than the most commonly used Ogawa sampler showed both higher ambient and personal ozone concentrations, and those studies were conducted in more highly polluted areas (China, Turkey, and Mexico) than the U.S., where the majority of the other studies were conducted.
Figure 4. Scatter plot of mean personal and ambient ozone concentrations by personal monitoring device type
is a forest plot of slopes of personal and ambient ozone concentrations. Three reported slopes were excluded from the meta-analysis. Dimakopoulou et al. (Citation2017) used log-transformed ozone concentration for the slope calculation and this study was therefore excluded from the meta-analysis. However, Grivas et al. (Citation2017) reported slopes using raw concentrations from the same set of data, which were included in the analysis. Sarnat et al. (Citation2005) and Koutrakis et al. (Citation2005) reported the same slope; therefore, only one was included. Williams et al. (Citation2012) (slope = 0.07) did not report the standard error and was excluded from the analysis. As a result, this meta-analysis included slopes from 8 studies. Overall, high heterogeneity was observed (97%) and the overall slope was 0.21 (95% CI: 0.15, 0.27). In other words, 1 ppb increase in ambient ozone was associated with 0.21 ppb increase in personal ozone concentration. The O’neill et al. (Citation2003) study, which was conducted in Mexico City, reported the highest slope (slope = 0.56) that was statistically significant, followed by the Liu, Delfino, and Koutrakis (Citation1997) study during their spring measurements with a reported slope of 0.52. The lowest slopes were reported by Brown et al. (Citation2009) (slope = −0.01) and Koutrakis et al. (Citation2005) (slope = 0.01) during their winter measurements.
Figure 5. Forest plot of slopes of personal-ambient ozone concentrations
Two studies reported slopes for stratified data based on window opening and ventilation status (). Overall, the slopes from high air flow conditions were higher than those from low air flow conditions. The associations between personal and ambient concentrations were often double under the high air flow conditions compared to the low air flow conditions. A sub-analysis comparing personal and ambient ozone ratio indicated a higher ratio for during summer months compared to non-ozone season, while ranges of the personal and ambient ozone ratio in both seasons were wide (ozone season: 0.06–0.59, non-ozone season: −0.01–0.29).
Table 2. Slopes of personal-ambient ozone under high and low air flow conditions
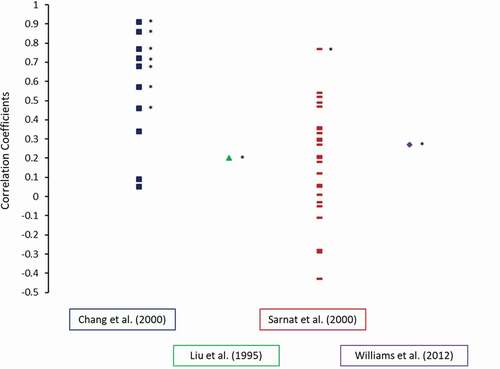
Correlation coefficients between personal and ambient ozone concentrations were reported by four studies, with all studies reporting Spearman’s coefficients, except for Williams et al. (Citation2012) that reported the Pearson correlation coefficient. Te Chang et al. (Citation2000) presented multiple comparisons including summer and winter personal indoor residence, personal indoor, personal outdoor near roadway, personal outdoor away from road, and personal in-vehicle to ambient concentrations. All correlations were positive yet widely varied from 0.05 (winter personal indoor residence) to 0.91 (summer personal outdoor near roadway), and the coefficients were higher for the outdoor personal measurements compared to the indoor personal measurements. Correlation coefficients were 0.2 and 0.22 for both at home and central outdoor monitors in Saliy Liu et al. (Citation1995). Sarnat, Koutrakis, and Suh (Citation2000) reported subject-level correlations along with summer (0.2) and winter (0.06) mean correlations. As shown in , the correlations between personal and ambient ozone varied dramatically across subjects from a strong positive correlation (0.77) to a moderate negative correlation (−0.43). Williams et al. (Citation2012) reported a correlation coefficient of 0.5.
Figure 6. Correlation coefficients of personal-ambient ozone concentrations
A sub-analysis () was conducted with 7 studies that also measured and reported indoor ozone concentrations. Opposite to the pattern shown for personal and ambient concentrations, the indoor measurements often underestimated the personal ozone exposures.
Figure 7. Scatterplot of mean personal and indoor ozone concentrations
Discussion
Conventionally, ambient air pollution concentrations are used as surrogates for personal exposures, mainly due to the challenge of collecting personal-level data, and some level of discrepancy between the ambient and personal exposure levels is expected. Even though the concerns of practicality and feasibility of measuring personal-level data must be acknowledged, there needs to be an effort to understand, examine, and characterize the resultant exposure measurement error and misclassification that could affect the results of epidemiological studies.
Our review focused on characterizing ambient and personal ozone concentrations. In all reviewed studies with numeric reporting of ozone measurements, ambient concentrations almost always overestimated personal concentrations by at least two-fold. Even though ambient ozone concentrations could be a reasonable indicator for personal exposure levels, the magnitude of differences observed between personal and ambient ozone concentrations varied across studies, locations, monitoring periods, seasons, and study subjects. Therefore, the impact of exposure error on epidemiological results is likely to be variable, and individual studies will be differentially impacted from potential bias in effect estimates. We do acknowledge that personal exposure levels were only assessed in a sub-population of a given study; therefore, they do not necessarily represent all the individuals living in proximity to the ambient monitoring sites. However, the variability even between the aggregated personal and ambient ozone concentrations in sub-populations is an indication of individual-level variability, which can be expected for individuals not included in the personal exposure assessment. Of note, most of our analyses were conducted at the aggregate level. Correlations at the subject level, which were reported only by Sarnat, Koutrakis, and Suh (Citation2000) in our reviewed papers, varied widely. For some subjects, correlations were positive and for others they were negative. These differential directions and magnitudes complicate efforts to understand associations between ozone exposures and adverse health outcomes in epidemiological studies. Most of our reviewed studies reported aggregated (ecological) measures of personal and ambient ozone concentrations, which makes it difficult to draw any conclusions about whether spatial or temporal ozone concentrations adequately reflect patterns of variability across different subjects.
Ambient, indoor, and personal environments and subsequent ozone exposures are interrelated. A recommendation would be to use adjusted ambient concentrations in epidemiological studies by utilizing as much relevant information as possible. Many air pollution studies use land-use regression methods to develop highly spatially resolved air pollution data using central ambient concentrations, which addresses the spatial exposure error to a certain extent. There are additional efforts being made to transform personal air pollution exposure assessment and subsequent health research (Larkin and Hystad Citation2017). Advances in personal monitoring equipment, cell phone tracking, as well as efforts to integrate sociological factors into ozone models can further improve exposure assessment of ozone and other air pollutants to provide more accurate information to be used in epidemiological analyses, which can reduce potential bias and allow better characterization of the impact of air pollution on human health. As new technologies and new methods are being considered to improve exposure assessment in health studies, researchers should explore different approaches that can improve the accuracy of exposure assessment with the currently available data.
One example is to try to better characterize personal exposure levels using ambient concentrations along with personal mobility and behavior data. For example, a study conducted in Shenzhen, China used cell phone location data to estimate individual air pollution concentrations and found that using home address alone to estimate air pollution exposure led to substantial misclassification, which was larger for those with higher exposure compared to lower exposure (Yu et al. Citation2018). As mentioned earlier, some of the practical challenges must be accepted, especially in large-scale epidemiological studies where personal-level monitoring is not feasible. Nonetheless, the advancement of technologies that can be widely adopted in large cohort populations (e.g., mobile location tracking system) could improve some components of the exposure assessment process.
There are additional ways to develop further improved adjusted ozone estimates. One approach is to utilize data on additional factors that could affect personal exposure levels. For example, incorporating estimates of air exchange rate based on window opening behaviors or the use of a ventilation system may help to reduce the level of exposure error (). Some studies conducted regression analyses of the interaction between ambient ozone and fraction of time spent outdoors, which showed much higher slopes (Liu et al. Citation1993; Saliy Liu et al. Citation1995) compared to studies that only evaluated the associations between personal and ambient ozone. The limitation of this approach is that this type of data is not always available. However, it is critical that future studies strategize to collect and use additional data to improve the accuracy of ozone exposure metrics. This may not be straightforward as non-time series air pollution epidemiological studies often make opportunistic use of existing cohort data. Nonetheless, cohorts recruited for air pollution health research should always collect additional information on personal behavior, such as window opening, presence of central heating or air conditioning, and time spent indoors vs. outdoors. These data can be collected from questionnaires, and participants’ locations can be shared using mobile phone GPS when possible. These considerations are particularly important since ozone epidemiological studies will likely continue to rely on ambient concentrations to represent personal exposure levels given the limitations and challenges associated with collecting individual-level data. However, it will be challenging to develop adjusted ozone concentrations for time series analyses that often use central monitor ozone concentrations along with available administrative population data. There are some studies that have attempted to adjust for behaviors that influence indoor concentrations, such as air conditioning use (e.g., Bell and Dominici Citation2008), but this is not commonly done.
One comprehensive effort that has been made to incorporate microenvironmental factors into exposure assessment is the Hazardous Air Pollutant Exposure Model (HAPEM). For large-scale cohort studies, HAPEM can be utilized to integrate sociological factors that allow incorporation of microenvironments. This model was developed by EPA and includes a number of calculation routes that incorporate data from census, human activity patterns, ambient air quality levels, climate data, and indoor/outdoor concentration relationships to estimate the inhalation exposure concentrations for groups of individuals (US EPA Citation2020a). HAPEMs have improved over time by introducing more features (e.g., commuting patterns, residential proximity to major roads) in their algorithms to better characterize the inhalation exposure levels for various air pollutants. While this model and approach shows promise, it is not widely adopted in current air pollution epidemiological studies. HAPEM is a useful tool, especially in the context of larger cohort populations where exposure assessment generally relies on central ambient ozone monitors.
The results of analyses examining ventilation stratification as well as personal and ambient ozone ratios during ozone season vs. non-ozone season suggest that infiltration is key in determining indoor concentrations. Our sub-analysis revealed that indoor measurements are likely to underestimate personal exposures, though the differences were smaller than what was shown in the personal-ambient concentrations. This is expected given the efficient removal of ozone through the building envelope as well as the overall limited indoor sources of ozone. The passive ozone monitors tested in the reviewed studies showed a comparable performance to the research-grade active monitors. The technologies of less expensive monitoring equipment continue to advance, which reduces the concern for cost associated with individual-level monitoring. However, the inconvenience and invasiveness of personal monitoring still limits its application. Indoor monitoring is less invasive and inconvenient to participants compared to the personal-level monitoring, and most people spend far more time indoors than outdoors. Although indoor concentrations will not be an accurate assessment of personal exposure, there could be benefits if subject-level indoor data can be collected with minimal inconvenience and cost. Overall, the use of surveys or tracking systems that are targeted to better inform activity patterns to predict personal level exposure based on ambient concentrations should be emphasized.
Another consideration is the varying scales of monitoring for the ambient and personal measurements. Various monitoring devices were used in the studies reviewed. The Ogawa passive ozone sampler was the most commonly used personal ozone monitor. The correlation between the passive Ogawa sampler and a reference UV photometric ozone instrument was tested and found to be high (R2 = 0.9) (Grivas et al. Citation2017). Liu, Delfino, and Koutrakis (Citation1997) used both passive and active ozone monitoring devices at stationary sites and showed similar concentrations (mean ozone for passive vs. active = 45.1 and 44.0 ppb, respectively). Those studies that employed less commonly used ozone samplers reported generally higher personal and ambient ozone concentrations; however, those studies were also conducted in countries with higher air pollution (China and Turkey). The differences are likely due to higher concentrations rather than differences in the monitoring devices. Ozone is highly reactive and thus difficult to measure using passive monitor (Koutrakis et al. Citation1993). Therefore, caution must be taken in comparing personal/indoor ozone concentrations measured by passive ozone monitors and ambient concentrations measured by active monitors. Many studies included in our review used passive monitors for both measurements, thus mitigating this issue.
Exposure measurement error and misclassification of ozone is a concern because it can affect the accuracy and precision of epidemiological risk estimates. One main question is the specific way in which epidemiological studies are affected and the subsequent interpretation of such studies. Only one of the reviewed studies assessed differences in health effect estimates by using personal vs. ambient ozone concentrations. Suh and Zanobetti (Citation2010) found that the % change in various heart rate variability (HRV) measures per unit of personal and ambient ozone concentrations varied widely. For example, HRV was negatively associated with ambient ozone (−6.32), while it showed a positive association with personal ozone (20.84). It should be noted that both were statistically not significant, which could be due to the very small sample size (n = 30). This is only one example, but it demonstrates that associations can differ widely depending on which ozone measure is used.
A comprehensive review of the impact of ozone exposure measurement error on health effect estimates was outside the scope of this review. However, it is clear that more efforts need to be made to understand the direction and magnitude of bias associated with such error. Smaller cohort studies could contribute to the literature by comparing effect estimates using both personal and ambient concentrations. Often, exposure misclassification of this sort is considered to be non-differential as it is not likely to be associated with the outcome of interest. Despite the conventional belief that non-differential exposure misclassification would lead to a reduction in the strength of an association, which could be true in some cases, non-differentiality is insufficient to guarantee the bias toward – and not away from – the null. Other conditions must be considered, such as independence of errors, and even small departures from non-differentiality may result in biasing the results away from the null (Jurek et al. Citation2005). A review study was conducted to understand how different types of exposure measurement error can affect bias and precision of calculated effect estimates for PM2.5, NO2, and SO2 (Richmond-Bryant and Long Citation2020). These authors found, for long-term epidemiological studies, that the median bias in the effect estimate for spatial error was centered around zero, while the range was quite widely spread from −0.6 to 0.6 (Richmond-Bryant and Long Citation2020). In other words, each unique study may be biased differently by exposure measurement error. Even though this review did not include ozone, the results can be applied to ozone considering its spatial variability. This is an important consideration when interpreting results of individual studies as well as meta-analyses.
In conclusion, we found that ambient ozone measurements are not an accurate representation of personal exposure levels. The magnitude of exposure measurement error between the ambient and personal measurements varied widely across studies and depended on various behavioral factors. This is important as inaccurate exposure assessment may bias health effect estimates. Despite this potential, the impact of relying on ambient measurements for the estimation of personal exposure levels in ozone epidemiological studies is under-investigated. An effort to better understand the impact of traditional exposure assessment approaches on risk estimates must be emphasized along with continued efforts to improve exposure assessment approaches and develop new technologies in order to provide context for interpreting results from ozone epidemiological studies.
Disclosure statement
No potential conflict of interest was reported by the author(s).
Additional information
Notes on contributors
Chloe S. Kim
Chloe. S. Kim is a Health Scientist in the Generation sector at EPRI. Her expertise lies in conducting public health research, where she analyzes and reviews epidemiological and exposure assessment data to quantify the health effects associated with various environmental exposures, such as air pollution.
Annette C. Rohr
Annette C. Rohr is a Program Manager in the Electrification and Sustainable Energy Strategy sector at EPRI, where she conducts research on the public and occupational health impacts of a variety of energy-related topics, including air pollution, other environmental exposures, and emerging energy technologies.
References
- Barkjohn, K. K., C. Norris, X. Cui, L. Fang, T. Zheng, J. J. Schauer, Z. Li, Y. Zhang, M. Black, J. Zhang, et al. 2020. Real-time measurements of PM 2.5 and ozone to assess the effectiveness of residential indoor air filtration in Shanghai homes. doi:https://doi.org/10.1111/ina.12716.
- Bell, M. L., and F. Dominici. 2008. Effect Modification by Community Characteristics on the Short-Term Effects of Ozone Exposure and Mortality in 98 US Communities. American Journal of Epidemiology 167(8):986–97. doi:https://doi.org/10.1093/aje/kwm396.
- Brown, K. W., J. A. Sarnat, H. H. Suh, B. A. Coull, and P. Koutrakis. 2009. Factors influencing relationships between personal and ambient concentrations of gaseous and particulate pollutants. Sci. Total Environ. 407 (12):3754–65. doi:https://doi.org/10.1016/j.scitotenv.2009.02.016.
- Demirel, G., Ö. Özden, T. Döğeroğlu, and E. O. Gaga. 2014. Personal exposure of primary school children to BTEX, NO2 and ozone in Eskişehir, Turkey: Relationship with indoor/outdoor concentrations and risk assessment. Science of the total environment 473:537–548. doi:https://doi.org/10.1016/j.scitotenv.2013.12.034.
- Dimakopoulou, K., G. Grivas, E. Samoli, S. Rodopoulou, D. Spyratos, D. Papakosta, A. Karakatsani, A. Chaloulakou, and K. Katsouyanni. 2017. Determinants of personal exposure to ozone in school children. Results from a panel study in Greece. Environ. Res. 154:66–72. doi:https://doi.org/10.1016/j.envres.2016.12.020.
- Fan, D., J. Gong, B. Ghaemmaghami, A. Zhang, J. Lach, and D. B. Peden 2017. Characterizing and calibrating low-cost wearable ozone sensors in dynamic environments. Proceedings - 2017 IEEE 2nd International Conference on Connected Health: Applications, Systems and Engineering Technologies, CHASE 2017, 300–01. doi:https://doi.org/10.1109/CHASE.2017.112.
- Geyh, A. S., J. Xue, H. Özkaynak, and J. D. Spengler. 2000. The Harvard Southern California chronic ozone exposure study: Assessing ozone exposure of grade-school-age children in two southern California communities. Environ. Health Perspect. 108 (3):265–70. doi:https://doi.org/10.1289/ehp.00108265.
- Grivas, G., K. Dimakopoulou, E. Samoli, D. Papakosta, A. Karakatsani, K. Katsouyanni, and A. Chaloulakou. 2017. Ozone exposure assessment for children in Greece - Results from the RESPOZE study. Sci. Total Environ. 581–582:518–29. doi:https://doi.org/10.1016/j.scitotenv.2016.12.159.
- Guarnieri, M., and J. R. Balmes. 2014. Outdoor air pollution and asthma. Lancet 383 (9928):1581–92. Lancet Publishing Group. doi:https://doi.org/10.1016/S0140-6736(14)60617-6.
- Ha, S., C. Nobles, J. Kanner, S. Sherman, S. H. Cho, N. Perkins, A. Williams, W. Grobman, J. Biggio, A. Subramaniam, et al. 2020. Air pollution exposure monitoring among pregnant women with and without Asthma. Int. J. Environ. Res. Public Health 17 (13):4888. doi:https://doi.org/10.3390/ijerph17134888.
- Huang, Y., Z. Yang, and Z. Gao. 2019. Contributions of indoor and outdoor sources to ozone in residential buildings in nanjing. Int. J. Environ. Res. Public Health 16 (14):2587. doi:https://doi.org/10.3390/ijerph16142587.
- Jurek, A. M., S. Greenland, G. Maldonado, and T. R. Church. 2005. Proper interpretation of non-differential misclassification effects: Expectations vs observations. Int. J. Epidemiol. 34 (3):680–87. doi:https://doi.org/10.1093/ije/dyi060.
- Karakatsani, A., E. Samoli, S. Rodopoulou, K. Dimakopoulou, D. Papakosta, D. Spyratos, G. Grivas, S. Tasi, N. Angelis, A. Thirios, et al. 2017. Weekly personal ozone exposure and respiratory health in a panel of Greek schoolchildren. Environ. Health Perspect. 125 (7):77017. doi:https://doi.org/10.1289/EHP635.
- Koutrakis, P., H. H. Suh, J. A. Sarnat, K. W. Brown, B. A. Coull, and J. Schwartz. 2005. Characterization of particulate and gas exposures of sensitive subpopulations living in Baltimore and Boston. www.healtheffects.org
- Koutrakis, P., J. M. Wolfson, A. Bunyaviroch, S. E. Froehlich, K. Hirano, and J. D Mulik. 1993. Measurement of Ambient Ozone Using a Nitrite-Coated Filter. Analytical Chemistry 65 (3):209–14. doi:https://doi.org/10.1021/ac00051a004
- Kurt, O. K., J. Zhang, and K. E. Pinkerton. 2016. Pulmonary health effects of air pollution. Curr. Opin. Pulm. Med. 22 (2):138–43. Lippincott Williams and Wilkins. doi:https://doi.org/10.1097/MCP.0000000000000248.
- Larkin, A., and P. Hystad. 2017. Towards Personal Exposures: How Technology Is Changing Air Pollution and Health Research. Current Environmental Health Reports, 4 (4):463–71. doi:https://doi.org/10.1007/s40572-017-0163-y
- Lee, K., W. J. Parkhurst, J. Xue, H. Özkaynak, D. Neuberg, J. D. Spengler, and A. Halû. 2012. Outdoor/indoor/personal ozone exposures of Children in Nashville, Tennessee. J. Air Waste Manage. Assoc. 54 (3):352–59. doi:https://doi.org/10.1080/10473289.2004.10470904.
- Liu, L. J., R. Delfino, and P. Koutrakis. 1997. Ozone exposure assessment in a southern California community. Environ. Health Perspect. 105 (1):58–65. doi:https://doi.org/10.1289/ehp.9710558.
- Liu, L. J. S., P. Koutrakis, H. H. Suh, J. D. Mulik, and R. M. Burton. 1993. Use of personal measurements for ozone exposure assessment: A pilot study. Environ. Health Perspect. 101 (4):318–24. doi:https://doi.org/10.1289/ehp.93101318.
- Niu, Y., J. Cai, Y. Xia, H. Yu, R. Chen, Z. Lin, C. Liu, C. Chen, W. Wang, L. Peng, et al. 2018. Estimation of personal ozone exposure using ambient concentrations and influencing factors. Environ. Int. 117:237–42. doi:https://doi.org/10.1016/j.envint.2018.05.017.
- Nuvolone, D., D. Petri, and F. Voller. 2018. The effects of ozone on human health. Environ. Sci. Pollut. Res. 25 (9):8074–88. doi:https://doi.org/10.1007/s11356-017-9239-3.
- O’neill, M. S., M. Ramirez-Aguilar, F. Meneses-Gonzalez, M. Hernández-Avila, A. S. Geyh, J. J. Sienra-Monge, and I. Romieu. 2003. Ozone exposure among Mexico city outdoor workers. J. Air Waste Manage. Assoc. 53 (3):339–46. doi:https://doi.org/10.1080/10473289.2003.10466156.
- Richmond-Bryant, J., and T. C. Long. 2020. Influence of exposure measurement errors on results from epidemiologic studies of different designs. J. Expo. Sci. Environ. Epidemiol. 30 (3):420–29. doi:https://doi.org/10.1038/s41370-019-0164-z.
- Sadighi, K., E. Coffey, A. Polidori, B. Feenstra, Q. Lv, D. K. Henze, and M. Hannigan. 2018. Intra-urban spatial variability of surface ozone in Riverside, CA: Viability and validation of low-cost sensors. Atmos. Meas. Tech. 11 (3):1777–92. doi:https://doi.org/10.5194/amt-11-1777-2018.
- Saliy Liu, L. J., P. Koutrakis, J. Leech, and I. Broder. 1995. Assessment of ozone exposures in the greater metropolitan toronto area. J. Air Waste Manage. Assoc. 45 (4):223–34. doi:https://doi.org/10.1080/10473289.1995.10467362.
- Sarnat, J. A., K. W. Brown, J. Schwartz, B. A. Coull, and P. Koutrakis. 2005. Ambient gas concentrations and personal particulate matter exposures: Implications for studying the health effects of particles. Epidemiology 16 (3):385–95. doi:https://doi.org/10.1097/01.ede.0000155505.04775.33.
- Sarnat, J. A., P. Koutrakis, and H. H. Suh. 2000. Assessing the relationship between personal particulate and gaseous exposures of senior citizens living in Baltimore, MD. J. Air Waste Manage. Assoc. 50 (7):1184–98. doi:https://doi.org/10.1080/10473289.2000.10464165.
- Sarnat, S. E., B. A. Coull, J. Schwartz, D. R. Gold, and H. H. Suh. 2006. Factors affecting the association between ambient concentrations and personal exposures to particles and gases. Environ. Health Perspect. 114 (5):649–54. doi:https://doi.org/10.1289/ehp.8422.
- Suh, H. H., and A. Zanobetti. 2010. Exposure error masks the relationship between traffic-related air pollution and heart rate variability. J. Occup. Environ. Med. 52 (7):685–92. doi:https://doi.org/10.1097/JOM.0b013e3181e8071f.
- Te Chang, L., P. Koutrakis, P. J. Catalano, and H. H. Suh. 2000. Hourly personal exposures to fine particles and gaseous pollutants-Results from Baltimore, Maryland. J. Air Waste Manage. Assoc. 50 (7):1223–35. doi:https://doi.org/10.1080/10473289.2000.10464151.
- US EPA. 2020a. Hazardous Air Pollutant Exposure Model (HAPEM) versions. https://www.epa.gov/fera/hazardous-air-pollutant-exposure-model-hapem-versions
- US EPA. 2020b. Health effects of ozone pollution. https://www.epa.gov/ground-level-ozone-pollution/health-effects-ozone-pollution
- US EPA. 2020c. Integrated science assessment for ozone and related photochemical oxidants. https://cfpub.epa.gov/ncea/isa/recordisplay.cfm?deid=348522
- US EPA. 2020d. What is ozone? https://www.epa.gov/ozone-pollution-and-your-patients-health/what-ozone
- Williams, R., A. G. Rappold, M. Case, M. Schmitt, S. Stone, P. Jones, J. Thornburg, and R. B. Devlin. 2012. Multi-pollutant exposures in an asthmatic cohort. Atmos. Environ. 61:244–52. doi:https://doi.org/10.1016/j.atmosenv.2012.07.049.
- Xue, J., S. V. Liu, and J. D. Spengler. 2005. Parameter evaluation and model validation of ozone exposure assessment using harvard southern california chronic ozone exposure study data. J. Air Waste Manage. Assoc. 55 (10):1508–15. doi:https://doi.org/10.1080/10473289.2005.10464754.
- Yu, H., A. Russell, J. Mulholland, and Z. Huang. 2018. Using Cell Phone Location to Assess Misclassification Errors in Air Pollution Exposure Estimation. Environmental Pollution 233:261–66. doi:https://doi.org/10.1016/j.envpol.2017.10.077