
ABSTRACT
The Fourth National Climate Assessment (NCA4) is the most comprehensive report to date assessing climate change science, impacts, risks, and adaptation in the United States. The 1,500 page report covers a breadth of topics, ranging from foundational physical science to climate change response options. Here we present information on indicators and impacts of climate change in the human environment featured in NCA4 Volume II, focusing on: air quality, forest disturbance and wildfire, energy systems, and water resources. Observations, trends, and impacts of these aspects of our changing climate will be discussed, along with implications for the future.
Implications: People of the United States are already being affected by our changing climate. Information on observed changes and impacts that affect human welfare and society, along with projections for the future, is highly valuable for informing decision-makers, including utility managers, emergency planners, and other stakeholders, about climate risk assessment, adaptation, and mitigation options.
Introduction
The National Climate Assessment (NCA) reports released by the U.S. Global Change Research Program (USGCRP) represent the official U.S. Government assessment of climate change and its impacts in the United States. These reports are called for by the Global Change Research Act, which was passed by Congress in 1990. The Fourth NCA (NCA4) was released in two volumes in 2017 and 2018. Volume I, the Climate Science Special Report, focused on scientific understanding of the climate system and observed and projected changes for the United States. Volume II, Impacts, Risks, and Adaptation in the United States, is a larger report providing a sectoral and regional perspective on climate change risks and impacts, as well as options for limiting climate change and adapting to its effects. Another recent USGCRP report, The Impacts of Climate Change on Human Health in the United States: A Scientific Assessment (the “Climate and Health Assessment,” or CHA), assessed the state of knowledge on impacts and risks for human health and well-being.
These reports were written by hundreds of authors, including federal scientists, academic researchers, and other experts from across the country, and underwent an extensive review process, including reviews by the National Academies of Sciences, Engineering, and Medicine and a public comment period. They are intended to inform policy choices and decision-making at all levels but are explicitly required to avoid advocating for or prescribing any particular policy choices.
Climate change in the United States
Over the past century, temperature has been measured on land and sea and in the atmosphere around the globe on a daily basis. These observations tell us with high confidence that the planet is warming at a faster rate than at any point in the history of modern civilization (Jay et al. Citation2018). Temperature is just one indicator of a warming world, however, and observations of many other climate variables support the conclusion that our climate is changing. Although Earth’s climate is influenced by both natural variability and human activities, these changes can be attributed primarily to human influences, in particular the addition of carbon dioxide (CO2) and other heat-trapping greenhouse gases (GHG) to the atmosphere (Hayhoe et al. Citation2018).
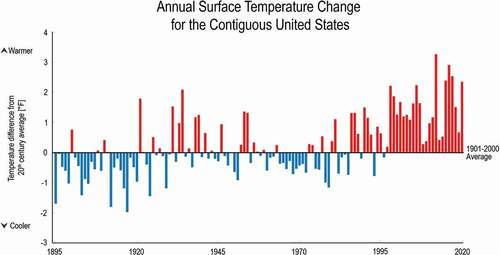
Global annually averaged temperature has increased by about 1.8°F (1°C) since 1880 (USGCRP Citation2021a), and 2011–2020 was the warmest decade on record (NOAA Citation2021). For the contiguous United States (CONUS), temperatures this century have been, on average, 1.5°F (0.8°C) warmer than during the last century (; USGCRP Citation2021c).
Figure 1. Figure shows how annual average temperatures for the contiguous United States differed (in degrees Fahrenheit) from the 20th-century (1901–2000) average. Data are shown for 1895 through 2020. Blue indicates years that were cooler than the 20th-century average, and red indicates years that were warmer than the 20th-century average. Temperatures at the national scale show more year-to-year variability than globally averaged temperatures but still reflect a notable warming trend in recent decades. Every year in the 21st century has been warmer than the 20th-century average. Source: USGCRP Citation2021c
Precipitation exhibits a large amount of variability, but globally, the average amount of precipitation over land has increased slightly over the past century (Wuebbles et al. Citation2017). Annual precipitation averaged across CONUS has also increased, with important regional and seasonal differences (see Easterling et al. Citation2017). Extreme precipitation events typically occur when the atmospheric water vapor content is near its saturated value. The saturated value of atmospheric water vapor increases by about 6% to 7% for each degree Celsius of temperature increase (Easterling et al. Citation2017) as described by the Clausius–Clapeyron relation (Lawrence Citation2005). Hence, extreme precipitation events are generally observed to increase in intensity by about 6% to 7% for each degree Celsius of temperature increase (Kunkel et al. Citation2020). In a warmer world, increased evaporation rates when liquid water is unlimited (e.g., over the oceans or moist soils) can lead to atmospheric water vapor levels approaching saturation, which in turn lead to more frequent and intense precipitation events in many areas (Hayhoe et al. Citation2018). An increase in evaporation, however, can lead to drier soils and often less runoff, increasing the risk of drought in some regions (Wehner et al. Citation2017).
People of the United States are impacted by many other types of extreme events that affect air quality, water quality, and other aspects of the human environment. Such events include heat and cold waves, floods, wildfire, hurricanes, and heavy snowfalls. Some of these events (e.g., heat waves, floods, wildfire) are projected to increase in magnitude and/or frequency in a warming climate, but others (e.g., cold waves) are expected to decrease in intensity (Peterson et al. Citation2014). Other elements are more complex, such as changes in hurricanes and other severe storms. No matter the event type, impacts on both the natural and human environment can vary both temporally and spatially, and complexities can occur when multiple events combine, often amplifying risks and vulnerabilities.
Each U.S. region is experiencing a unique set of challenges resulting from our changing climate. One such concern is coastal flooding. Along many U.S. coastlines, high tide flooding is increasing in frequency due to sea level rise, as is severe flooding associated with coastal storms such as hurricanes and nor’easters (Hayhoe et al. Citation2018). Sea level rise is closely linked to global temperatures (Sweet et al. Citation2017), and global mean sea level has risen by about 8 inches since 1880, with the rate of increase becoming greater in recent years (USGCRP Citation2021b).
The extent to which these changes continue in the future will depend primarily on GHG emissions and the response of Earth’s climate system to this human-induced warming (Hayhoe et al. Citation2018). “With significant reductions in emissions, global temperature increase could be limited to 3.6°F (2°C) or less compared to preindustrial temperatures. Without significant reductions, annual average global temperatures could increase by 9°F (5°C) or more by the end of this century compared to preindustrial temperatures” (Hayhoe et al. Citation2018). These projections of future climate are based on climate model simulations that use various possible futures, or scenarios, “that capture the relationships between human choices, emissions, concentrations, and temperature change” (Hayhoe et al. Citation2017). These scenarios, called Representative Concentration Pathways (RCPs; Moss et al. Citation2010), are numbered according to changes in radiative forcing (a measure of the influence that a factor, such as atmospheric GHG concentrations, has in changing the global balance of incoming and outgoing energy) in 2100 relative to preindustrial conditions (Hayhoe et al. Citation2018). In this paper, we reference both a higher scenario (RCP8.5: +8.5 watts per square meter in 2100) and a lower scenario (RCP4.5: +4.5 watts per square meter in 2100). The higher scenario (RCP8.5) represents a future where annual GHG emissions increase significantly throughout the 21st century before leveling off by 2100, whereas the lower scenario (RCP4.5) represents a substantial mitigation by midcentury, with greater reductions thereafter. Current global trends in annual GHG emissions are consistent with the higher scenario (Jay et al. Citation2018).
For more information on the physical drivers of climate change, future climate scenarios, and the uncertainties associated with these findings, see the Climate Science Special Report: Fourth National Climate Assessment, Volume I (USGCRP Citation2017).
This review article provides an overview of selected findings from NCA4 Volume II, supplemented by information from the literature underpinning that assessment, as well as findings from CHA, with a focus on topics affecting human welfare and society in the United States. These topics, of particular interest to Journal of the Air & Waste Management Association readers, include air quality, forest disturbance and wildfire, energy systems, and water resources. We discuss weather and climate interactions across each of these sectors, as well as observed changes, impacts, and implications for the future. Select regional highlights are also presented. Such information is highly valuable for informing decision-makers, including utility managers, emergency planners, and other stakeholders, about climate risk assessment, adaptation, and mitigation options.
Climate, weather, and air quality
Air quality generally refers to the presence or absence of pollutants and other substances in the air that can adversely affect human health and the ability to work outdoors or enjoy outdoor recreation. These substances can result from human activities, as with the ozone precursors methane, carbon monoxide, and nitrogen oxides (NOx) produced by burning fossil fuels, or they can be of natural origin, including dust, pollen, and volatile organic compounds (VOCs) from trees.
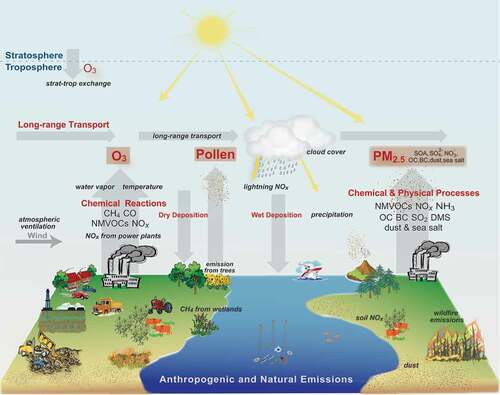
The production, longevity, and geographic distribution of air pollutants and airborne allergens are strongly influenced by weather conditions, including temperature, cloud cover, precipitation, and atmospheric circulation patterns (). For example, ground-level ozone is the result of chemical reactions between NOx and VOCs in the presence of sunlight (Fann et al. Citation2016). Higher temperatures, sunny days, and stagnant air conditions are associated with higher concentrations of ground-level ozone, while higher levels of water vapor or stronger winds can reduce ozone concentrations (Fann et al. Citation2016). Concentrations of small particulate matter (PM) – solid or liquid particles in the atmosphere, including dust and sea salt from natural sources and sulfates, black carbon, and other substances emitted by burning fossil fuels and other human activities – are strongly influenced by both wind speed and precipitation (Nolte et al. Citation2018).
Figure 2. Figure illustrates some of the interactions between climate, weather, human activities, and natural processes that can influence the production, removal, and transport of three key contributors to poor air quality—ground level ozone, PM2.5, and pollen. See Fiore et al. Citation2015 for details on these interactions. Source: Adapted from Fiore et al. Citation2015. © Owned by the Air & Waste Management Association, reprinted by permission of Informa UK Limited, trading as Taylor & Francis Group, www.tandfonline.com on behalf of the Air & Waste Management Association, www.awma.org
Climate change is thus expected to influence air quality through changes in both average weather conditions and in the frequency and severity of extreme events, including heavy rainfall events and drought. These climate influences will act concurrently with changes in the human activities that produce air pollutants. Meanwhile, many air pollutants also have direct or indirect warming or cooling influences on the climate. In addition, some aeroallergens are expected to be directly influenced by increasing CO2 concentrations (Fann et al. Citation2016).
Climate change can have other indirect effects on exposure to air pollution by driving changes in human behaviors and natural processes that in turn affect air quality. As a result, “climate-driven changes in weather, human activity, and natural emissions are all expected to impact future air quality across the United States” (Nolte et al. Citation2018).
Ozone
While ozone in the stratosphere provides protection from harmful ultraviolet radiation, ground-level ozone is a significant health threat and is associated with “premature death, respiratory hospital admissions, cases of aggravated asthma, lost days of school, and reduced productivity among outdoor workers” (Nolte et al. Citation2018). At current levels, ground-level ozone is estimated to cause “tens of thousands of hospital and emergency room visits, millions of cases of acute respiratory symptoms and school absences, and thousands of premature deaths each year in the United States” (Fann et al. Citation2016).
Efforts to reduce air pollution, including the Clean Air Act and its amendments (e.g., Clean Air Act Amendments of Citation1990), resulted in a 22% decrease in ozone concentrations between 1990 and 2016, but as of 2015, almost 1 in 3 Americans still experienced ozone concentrations that exceeded standards set by the U.S. Environmental Protection Agency (EPA Citation2017a; Nolte et al. Citation2018).
Climate change may have already offset some of the reductions in ozone concentrations that would have otherwise been expected from reductions in emissions of ozone precursors (Nolte et al. Citation2018). For example, one study found that reductions in the frequency of summer mid-latitude cyclones in the eastern United States between 1980 and 2006 may have offset half of the improvements in ozone air quality in the Northeast from reductions in air pollutant emissions (Leibensperger, Mickley, and Jacob Citation2008). “Temperature is often the largest single driver” of ozone levels (Camalier, Cox, and Dolwick Citation2007), and there is high confidence that unless offset by additional reductions of ozone precursor emissions, “climate change will increase ozone levels over most of the United States, particularly over already polluted areas” (Nolte et al. Citation2018).
There is some evidence that higher temperatures can exacerbate the risk of ozone-related premature deaths (e.g., Jhun et al. Citation2014; Ren et al. Citation2008), although increases in the use of air conditioning in response to rising temperatures may offset some of the increased risk (Nolte et al. Citation2018).
The Climate and Health Assessment (CHA) concluded that “ozone-related human health impacts attributable to climate change are projected to lead to hundreds to thousands of premature deaths, hospital admissions, and cases of acute respiratory illnesses per year in the United States in 2030” (Fann et al. Citation2016).
Particulate matter
Particulate matter smaller than 2.5 microns (PM2.5) is responsible for “most of the health impacts due to air pollution in the United States” (Fann et al. Citation2012), including “lung cancer, chronic obstructive pulmonary disease, cardiovascular disease, and asthma development and exacerbation” (EPA Citation2009). “More than 100 million people in the United States live in communities where air pollution exceeds health-based air quality standards,” and “exposure to high concentrations can result in serious health impacts, including premature death, nonfatal heart attacks, and adverse birth outcomes” (Nolte et al. Citation2018).
Weather conditions – particularly winds and precipitation – have a strong effect on PM concentrations, and climate change is expected to directly influence PM concentrations in multiple ways, including through increases in both stagnant air conditions and heavy precipitation events and changes in weather fronts, as well was indirectly through changes in emissions from plants (Nolte et al. Citation2018). Due to the complex interactions involved and remaining uncertainties about future changes in weather patterns, CHA reports that “there is no consensus yet on whether meteorological changes will lead to a net increase or decrease in PM2.5 levels in the United States” (Fann et al. Citation2016). Without considering the impacts of climate change, reductions in air pollutant emissions resulting from policies aimed at improving air quality would be expected to decrease concentrations of PM2.5 through 2040 (EPA Citation2016).
Wildfire
Wildfires and prescribed fires (both of which also contribute to ozone) are major sources of PM, particularly in the West and Southeast, and exposure to smoke from wildfires results in increased incidences of respiratory illnesses, premature death, and visits to hospitals and emergency rooms (Fann et al. Citation2016; Nolte et al. Citation2018). More severe and possibly longer droughts are projected, particularly in the Southwest and Southern Great Plains (Hayhoe et al. Citation2018), and these changes would be expected to produce longer wildfire seasons and larger wildfires, increase the amount of wildfire smoke and dust in drought-affected areas and “reduce the amount and quality of time spent in outdoor activities” (Nolte et al. Citation2018). In a warming climate, the future health impacts of wildfires will depend on a variety of other factors, including changes in the intensity and frequency of wildfires and patterns of human habitation, particularly at the interface between urban and wildland environments.
Aeroallergens
Climate change is also expected to exacerbate the adverse health impacts of plant-based pollens. Elevated CO2 levels have been directly associated with stronger pollen production for some important sources of allergenic pollen, including ragweed, pine trees, and oak trees. Changes consistent with warming, including warmer winters and longer growing seasons, have also been associated with increased exposure to aeroallergens. However, research so far is less conclusive as to whether these changes have or will lead to changes in health outcomes (Nolte et al. Citation2018). Conversely, warming may reduce exposure in some cases; for example, drier conditions expected in some areas may reduce pollen exposure (Fann et al. Citation2016).
Nonetheless, “the frequency and severity of allergic illnesses, including asthma and hay fever, are likely to increase as a result of a changing climate. Earlier spring arrival, warmer temperatures, changes in precipitation, and higher carbon dioxide concentrations can increase exposure to airborne pollen allergens” (Nolte et al. Citation2018). There is evidence that prior or simultaneous exposure to other air pollutants (e.g., ozone and PM2.5) may exacerbate the risks of aeroallergen exposure (Fann et al. Citation2016).
Indoor air quality
Air quality concerns aren’t limited to the outdoors; climate change also has the potential to influence indoor air quality. Any changes in exposure to outdoor pollutants will result in changes to indoor exposure to those pollutants, although changes in heating and air conditioning in response to rising temperatures may result in seasonal and regional changes in the rate at which outdoor pollutants infiltrate indoor spaces (Fann et al. Citation2016; Ilacqua et al. Citation2015). Increases in humidity, heavy precipitation events, flooding, droughts, severe tropical storms, and dust storms could also increase exposures to indoor molds, carbon monoxide poisoning during more frequent or longer power outages (see “Climate, weather, and energy”), and illnesses such as Valley fever, Legionnaires’ disease, and Hantavirus Pulmonary Syndrome, although these and other indoor air quality concerns are emerging issues requiring further research (Fann et al. Citation2016).
Changes in health outcomes
Policies aimed at reducing air pollution have improved air quality in the United States, but climate change threatens to offset some of the benefits of air-quality regulations. “Unless counteracting efforts to improve air quality are implemented, climate change will worsen existing air pollution levels. This worsened air pollution would increase the incidence of adverse respiratory and cardiovascular health effects, including premature death. Increased air pollution would also have other environmental consequences, including reduced visibility and damage to agricultural crops and forests” (Nolte et al. Citation2018).
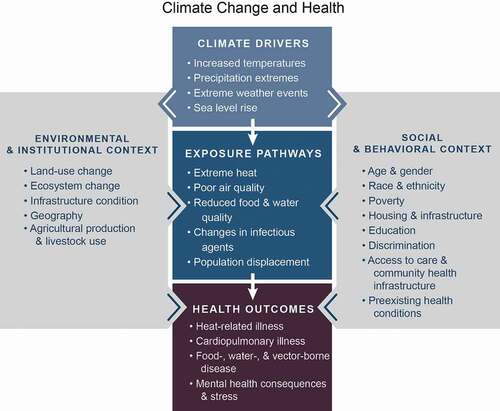
Changes in actual health outcomes will be influenced by many other factors, including urbanization, emissions of pollutants, and changing land-use patterns, as well as by social determinants of health, proximity to sources of emissions, and access to air conditioning, air filtration, and other factors (; Fann et al. Citation2016). These interactions and interdependencies complicate the challenge of understanding how climate change has and will affect exposures and health outcomes.
Figure 3. Figure from the USGCRP Climate and Health Assessment illustrates some of the ways in which changes in climate can influence exposure to poor air quality and the resulting health outcomes, as well as the important influences of environmental, institutional, social, and behavioral factors—factors that can themselves be influenced by climate change. Source: Fann et al. Citation2016
Climate change mitigation and air quality co-benefits
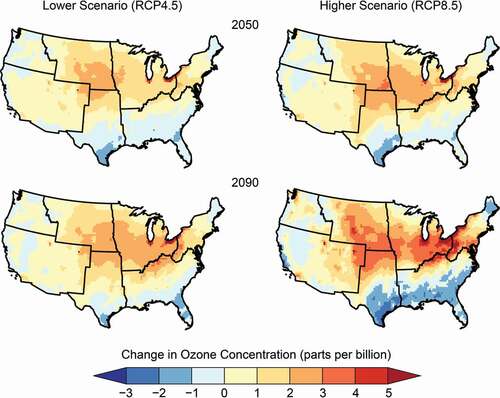
Efforts to limit future climate change by reducing GHG emissions could result in significant co-benefits in the form of improved air quality. shows projected changes in summer ozone for CONUS. Both scenarios show increases across much of the country, with generally smaller increases under the lower scenario (RCP4.5). These changes are consistent with the general expectation that higher temperatures result in higher ozone levels, although parts of the South and Southeast do show decreases, as other meteorological changes (e.g., in precipitation and winds) may make conditions less favorable for ozone. Furthermore, projections indicate 1,700 additional deaths per year by 2090 attributable to the impact from climate change under RCP8.5, compared to 1,200 per year under RCP4.5 – a difference of 500 fewer premature deaths per year under the lower scenario (EPA Citation2017b; Nolte et al. Citation2018).
Figure 4. Figure from NCA4 shows model projections of changes in summer average maximum daily 8-hour ozone concentration in 2050 (top) and 2090 (bottom) compared to the 1995–2005 average for the lower scenario (RCP4.5, left) and the higher scenario (RCP8.5, right). Sources: Nolte et al. Citation2018, adapted from EPA Citation2017b
Policies aimed directly at improving air quality can have varying effects on climate change. For example, reductions in emissions of black carbon, which has a warming influence, could have a relatively rapid and strong cooling influence, particularly on regional scales, in addition to providing health benefits (DeAngelo et al. Citation2017). However, other aerosols and aerosol precursors exert a cooling influence on the climate that has masked some of the GHG-driven warming effect, and policies aimed at reducing emissions of these substances to improve air quality have already contributed to a leveling off of this cooling influence (Fahey et al. Citation2017).
Future uncertainties
Rising temperatures and other manifestations of climate change will have multiple, sometimes counteracting, and regionally varying effects on the meteorological, chemical, and biological processes that influence air pollution. Societal choices, including future emissions of GHGs, policies aimed at reducing air pollution, patterns of urbanization and regional migration, and changes in air conditioning usage, all introduce significant uncertainty as to the net effects of climate change on exposure to air pollutants. The impacts of changes in exposure on human health and well-being will depend in part on future trends in the underlying health status of the population and other socioeconomic factors.
All of these factors complicate projections about the impacts of climate change on air quality and pose challenges for managing air quality in a rapidly changing climate. However, other considerations aside, climate change is expected to have an overall negative influence on air quality. “Despite the potential variability in regional impacts of climate change, there is evidence that climate change will increase the risk of unhealthy air quality in the future across the Nation in the absence of further air pollution control efforts” (Nolte et al. Citation2018).
Climate, weather, and forests
Forests cover about 33% of land in the United States and provide benefits to the natural environment as well as economic benefits and ecosystem services (such as recreational opportunities and carbon storage) to people. They provide opportunities for recreation and spiritual renewal and serve as a source of water, fiber, and wood products (Vose et al. Citation2018). Additionally, forests serve as a critical carbon sink, offsetting about 12% of U.S. carbon emissions in 2018 (EPA Citation2020).
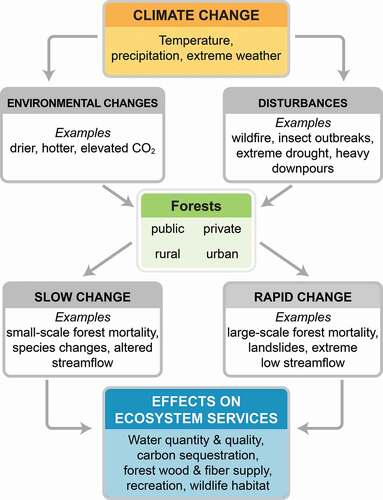
Rapid changes in forests have been driven by increasing temperatures, severe drought, insect outbreaks, and wildfires. Climate and environmental changes pose risks to the health of forests and threaten their ability to continue providing goods and services (). Climate extremes, such as heat waves and severe drought, can cause heat-related stress in vegetation, resulting in reduced forest productivity and increased tree mortality, leaving forests more susceptible to wildfires and insect outbreaks (Vose et al. Citation2018). Warming and increased concentrations of atmospheric CO2 can also affect below-ground processes, such as nitrogen and carbon cycling, potentially impacting forest productivity (Campbell et al. Citation2009).
Figure 5. Figure from NCA4 depicts how many factors in the biophysical environment interact with climate change to influence forest productivity, structure, and function, ultimately affecting the ecosystem services that forests provide to people in the United States and globally. Sources: Vose et al. Citation2018, U.S. Forest Service
Heat and drought
The rate of warming influences the rate and magnitude of changes in forest health. Negative effects on some species will benefit others. Overall changes in the structure of forest communities depend on the ability of local vegetation populations to migrate to new areas that become suitable as climate continues to change (Vose et al. Citation2018).
As the climate warms, future droughts are expected to be stronger and last longer (Lall et al. Citation2018). Drought can cause forest productivity loss and plant mortality by inducing hydraulic failure. Trapped gas emboli form in the water transport system of plants in response to drought stress. This reduces a plant’s ability to supply water to its leaves, which can ultimately result in desiccation and mortality (Choat et al. Citation2012). The slow response times of some tree species is likely to mask the direct effects of climate change on tree mortality. Modeling studies suggest that increases in drought and prolonged dry periods in the future will also exacerbate fire risk, threatening both forests and local communities (Vose et al. Citation2018).
Insects and pathogens
Recent tree mortality caused by insect infestations appears to be far outside documented historical ranges and is likely related to climate change (Vose et al. Citation2018). Elevated temperatures can speed up bark beetle reproductive and growth cycles and reduce cold-induced beetle mortality, increasing the overall beetle population. A combination of drought and warm temperatures can lead to extreme or prolonged water stress, weakening trees and making them more susceptible to bark beetle attacks (Bentz et al. Citation2005).
In the West, tree mortality caused by bark beetles has outpaced tree mortality caused by wildfires over the past three decades. In the East, the southern pine beetle is the only bark beetle species that causes extensive tree mortality. And while there is no evidence of drought-related outbreaks of this beetle, higher winter temperatures have facilitated a recent expansion of its range into the Northeast. As a result, the beetle now threatens pine barrens in New York and Massachusetts. Large-scale dieback in forests with commercially valuable trees can negatively affect timber prices and the economic well-being of forest landowners and wood processors.
The hemlock woolly adelgid (HWA), an aphid-like insect, is a nonnative species that attacks eastern hemlock trees from Georgia to Maine. HWAs drain trees of their stored sugars, causing needle loss and branch death. An increase in winter minimum temperatures has facilitated a northward expansion of its habitat in the Northeast (Dunckel, Weiskittel, and Fiske Citation2017), as well as a habitat expansion of the mountain pine beetle in high-elevation forests of the West (Vose et al. Citation2018). Studies project continued northward expansion of the HWA into the full range of hemlock in New England and southern Canada, with the potential to eliminate the species in the coming decades (Boucher et al. Citation2020). High-elevation pine species are expected to suffer significant mortality in the future due to a combination of warmer temperatures, white pine blister rust, and mountain pine beetle infestations (Krist et al. Citation2014).
“Fungal pathogens, especially those that depend on stressed plant hosts for colonization, are expected to perform better and have greater effects on forests as a result of climate change” (Vose et al. Citation2018), as increases in annual temperatures and precipitation create ideal conditions for disease outbreaks. Most forest pathogens are expected to be able to migrate at a faster rate than tree species to areas where climate conditions are suitable for their survival and reproduction (Sturrock et al. Citation2011).
Insect and disease outbreaks can interact with other forest disturbances, such as wildfire, worsening the overall impact on ecosystem services. For example, mountain pine beetle outbreaks alter forest fuels, affecting the frequency and intensity of wildfires. Conversely, trees injured by fire can promote bark beetle attacks, consequently increasing beetle populations (Jenkins et al. Citation2014).
Wildfire
Climate and fuels are the main factors that control wildfire patterns. Climate controls the frequency of weather conditions that are conducive to wildfire, while fuel quantity and distribution are responsible for fire intensity and spread. Climate also influences fuels by shaping forest composition and productivity, as well as susceptibility to disturbance (Ayres et al. Citation2014). Most fire-prone forests have the ability to persist as the occurrence of wildfires increases, but the resilience of the underlying ecosystems depends on the continued presence of fire-adapted species, intensity and frequency of future fires, and societal response (Vose et al. Citation2018).
Fire exclusion of fire-prone forest ecosystems over the past century has left behind highly flammable landscapes of dense forests with heavy fuel loads (Keane et al. Citation2002). And a warm, dry climate has led to an increase in the area burned across the West over recent decades (Abatzoglou and Kolden Citation2013), although it is unclear if this increase is outside the range of what has been observed over centuries of fire occurrence.
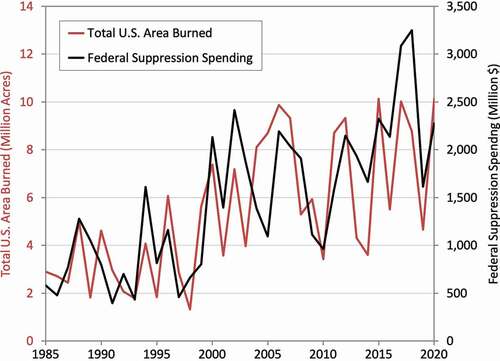
Large, intense wildfires have been difficult to suppress in some locations, leading to an increased risk to life and property, as well as increased spending on fire suppression (operations used to extinguish, prevent, modify, or manage a fire; DOI Citation2021). Wildfires burned at least 5 million acres nationwide in 7 of the last 10 years, including a record 10.1 million acres in 2015 and 2020. Over this same time span, annual federal wildfire suppression expenditures ranged from 1.6 USD billion to 3.2 USD billion (). Some of the increased spending on fire suppression is due to the increasing cost of protecting property in the wildland–urban interface (Vose et al. Citation2018).
Figure 6. Figure updated from NCA4 shows the annual wildfire area burned in the United States (red) and the annual federal wildfire suppression spending (black), adjusted to 2020 U.S. dollars. Trends for both area burned and wildfire suppression costs indicate about a fourfold increase over a 35-year period. Sources: Adapted from Vose et al. Citation2018, U.S. Forest Service
Increased temperatures and earlier onset of spring snowmelt has lengthened the wildfire season in the West since the 1970s. Over the same time period, the average burn time, frequency, and area burned by large wildfires (> 400 hectares) have also increased (Westerling Citation2016). Increases in frequency and area burned by large wildfires are projected to continue across the West in the coming decades, with the area burned increasing by as much as two to six times over the 1970–2006 average by midcentury (Gergel et al. Citation2017; Litschert, Brown, and Theobald Citation2012). “More frequent and larger wildfires, combined with increasing development at the wildland–urban interface (where people live in and near forested areas), portend increasing risks to property and human life” (Vose et al. Citation2018).
Wildfire risk can be reduced in some forests. For conifer forests in the southern U.S. and low-elevation, dry conifer forests in the western U.S., wildfire risk can be reduced by decreasing stand density (the amount of tree material per unit area), using prescribed burning, and letting some fires burn in cases where they will not affect people. Frequent prescribed burning has been a socially accepted practice for decades in fire-prone and fire-dependent southern forests, illustrating how wildfire risk can be reduced by forest-management practices. However, smoke produced by prescribed burning is a growing concern in the wildland–urban interface (Vose et al. Citation2018), creating substantial public health impacts to large populations living near heavily forested areas (Nolte et al. Citation2018).
Ecosystem services and forest management
Forests provide many and varied benefits to people, such as recreation, wildlife habitat, biodiversity, cultural values, and non-timber forest products. It is very likely that the impacts of climate change, such as those described above, will decrease the ability of many forest ecosystems to provide these important ecosystem services. “Ensuring the continuing health of forest ecosystems and, where desired and feasible, keeping forestland in forest cover are key challenges for society” (Vose et al. Citation2018).
A better understanding of the potential risks of climate change in the context of forest management can help inform decisions related to managing resources (Vose et al. Citation2018). For example, risks posed by ecological disturbances can be reduced by first assessing specific disturbance components (e.g., wildfire exposure) and then identifying forest management activities that can be implemented to reduce risk (Ojima et al. Citation2014). However, both risk assessment and risk management in the context of how forests will respond to climate change are complex issues. Identifying interactions among all types of risks at both local and regional scales will provide land managers with the information needed to manage forests sustainably across large landscapes (Vose et al. Citation2018).
Climate, weather, and energy
Energy systems and infrastructure, including energy production, distribution, and demand, underpin every sector of the economy, and “the Nation’s economic security is increasingly dependent on an affordable and reliable supply of energy” (Zamuda et al. Citation2018). These systems, including their vulnerabilities and resilience, differ across the United States, however, and will all be impacted by a changing climate.
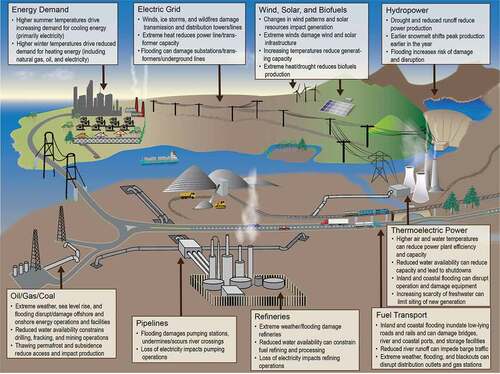
Some of the most apparent impacts of climate change on the energy industry are those caused by extreme weather. Extreme events (e.g., heat waves, snow and ice storms, heavy precipitation) are the main contributors to power outages. As described above in Climate change in the United States,” some event types, such as extreme heat and intense precipitation, are projected to increase in a warming climate. As a result, power outages are projected to become more frequent and longer lasting. Such events can interrupt energy supplies, disrupt infrastructure and distribution systems, and lead to fuel and electricity shortages (), causing cascading impacts on other critical sectors and potentially affecting economic and national security (Zamuda et al. Citation2018). “At the same time, the energy sector is undergoing substantial policy, market, and technology-driven changes that are projected to affect these vulnerabilities” (USGCRP Citation2018).
Figure 7. Figure from NCA4 depicts how extreme weather and climate change can potentially impact all components of the Nation’s energy system, from fuel (petroleum, coal, and natural gas) production and distribution to electricity generation, transmission, and demand. Sources: Zamuda et al. Citation2018, adapted from DOE Citation2013
Extreme weather
“The Nation’s energy system is already affected by extreme weather events, and due to climate change, it is projected to be increasingly threatened by more frequent and longer-lasting power outages affecting critical energy infrastructure and creating fuel availability and demand imbalances” (Zamuda et al. Citation2018). The Nation’s energy system is also aging, so longer and more frequent power interruptions are projected to occur if attention is not given to aging infrastructure and equipment (ASCE Citation2017). Extreme rainfall is projected to increase in the future, including an increase in the amount of precipitation produced by hurricanes and atmospheric river events (long, narrow streams of concentrated moisture that transport water vapor from the tropics; NOAA Citation2017), which can result in flash floods. Such events, along with river flooding, have been known to wash out infrastructure important for the transportation of energy products and to undermine the foundations of power lines, power plants, and other energy facilities (DOE Citation2015). Extreme heat events result in the reduced capacity and increased disruption of regional power supplies while simultaneously increasing energy demand for cooling. In our changing climate, U.S. heat waves have the potential to become more common, more severe, and longer in duration, which could lead to an increase in the number of local blackouts and power outages, potentially resulting in increased risks to public health and safety (Zamuda et al. Citation2018). Increased demand for cooling is also likely to increase emissions of air pollutants such as nitrogen oxide and sulfur dioxide (see “Climate, weather, and air quality”). Extreme cold outbreaks, on the other hand, can damage power lines and affect the supply and transportation of fuel; however, such events are expected to decrease in the future. Another potential cause of power outages is high winds, which can damage electricity transmission and distribution lines as well as buildings and other structures associated with energy infrastructure and operations (DOE Citation2015). Projections of changes in thunderstorms and strong wind events are uncertain (Hayhoe et al. Citation2018).
Coastal flooding
Coastal flooding is another major threat to energy infrastructure. Seawater incursion from waves or storm surge “can affect gas and electric asset performance, cause asset damage and failure, and disrupt energy generation, transmission, and delivery” (Zamuda et al. Citation2018). Hazardous spills can occur if flooding damages petroleum tanks in above-ground storage facilities (DOE Citation2015). Power plants and oil refineries along the Southeast Atlantic and Gulf Coasts are especially vulnerable to hurricane storm surge (Maloney and Preston Citation2014), and this risk is projected to increase as sea levels rise. It is extremely likely that U.S. sea levels will continue to rise throughout the 21st century (Sweet et al. Citation2017).
Reduced water availability
Another factor affecting energy production is reduced water availability. During periods of drought, which are projected to intensify (Hayhoe et al. Citation2018), fuel refining operations will need alternative water supplies or may be shut down temporarily, resulting in increased costs and ultimately increased consumer prices (DOE Citation2013). Drought can also “increase the risk of wildfires that threaten transmission lines and other energy infrastructure” (Zamuda et al. Citation2018).
Future scenarios
Continued GHG emissions are projected for the future, and if a higher scenario is followed, both electricity costs and demand would increase due to rising temperatures. Nationwide, electricity demand is projected to increase by 2%–9% by 2040 (Larsen et al. Citation2017). This projection includes both the reduction in electricity used for space heating in states with warming winters and the increase in electricity demand for cooling as overall temperatures increase. Increases in cooling demand are projected across the Nation (Zamuda et al. Citation2018) and will only be marginally offset by the relatively small decline in heating demand that is met with electric power (Clarke et al. Citation2018a). Although buildings and appliances are becoming more energy efficient, costs would still increase due to the reduced efficiency of power generation and delivery. By 2040, nationwide, residential, and commercial electricity expenditures are projected to increase by 4%–18% (Larsen et al. Citation2017), with an increase in annual average energy expenditures of 32–87 USD billion by the end of the century, due to increased energy demand (Hsiang et al. Citation2017; Larsen et al. Citation2017). Energy generation and storage capacity will need to meet the highest peak load demand, so a warming climate may necessitate the construction of up to 25% more power plant capacity by 2040, compared to a scenario without rising global temperatures (Larsen et al. Citation2017).
Energy sector vulnerabilities
As outlined above, the energy sector is susceptible to the adverse effects of climate change, such as extreme weather events, coastal flooding, and reduced water availability. Energy sector vulnerabilities to climate change depend in part on factors such as changes in energy technologies, markets, and policies. “These changes offer the opportunity to diversify the energy generation portfolio and require planning for operation and reliability of power generation, transmission, and delivery to maximize the positive effects and avoid unintended consequences” (Zamuda et al. Citation2018). Energy system flexibility, reliability, and resilience are also being enhanced by the growing adoption of energy efficiency programs, demand response programs, transmission capacity increases, and microgrids with energy storage technologies (DOE Citation2017).
Many efforts are underway to address the challenges of our changing climate in terms of the energy sector and to improve energy system resilience. These efforts include “planning and operational measures that seek to anticipate climate impacts and prevent or respond to damages more effectively, as well as hardening measures (including physical barriers, protective casing, or other upgrades) to protect assets from damage during extreme weather events, multi-institutional and public–private partnerships for coordinated action, and development and deployment of new technologies to enhance system resilience” (Zamuda et al. Citation2018).
Access to the latest data and improved modeling and analysis are also essential for energy companies, utilities, and system operators in order to support assessment and planning activities and to help stakeholders plan for the future. For example, coastal infrastructure plans should take into account rising sea levels and the associated increased risk of flooding (Zamuda et al. Citation2018). Uncertainties still exist, however, and “an escalation of the pace, scale, and scope of efforts is needed to ensure the safe and reliable provision of energy and to establish a climate-ready energy system to address present and future risks” (USGCRP Citation2018).
Climate, weather, and water
“Ensuring a reliable supply of clean freshwater to individuals, communities, and ecosystems, together with effective management of floods and droughts, is the foundation of human and ecological health” (Lall et al. Citation2018). Water also plays a significant role in the resilience of other sectors, such as agriculture, energy, urban environments, and industry (Lall et al. Citation2018).
Our changing climate has a profound effect on water. Increases in the frequency and magnitude of extreme precipitation events will pose challenges in many regions of the United States (Lall et al. Citation2018). Such events often lead to flooding, as well as disruptions to infrastructure and the built environment, especially when combined with rising sea levels in coastal areas (Carter et al. Citation2018; Fleming et al. Citation2018). Other parts of the United States are experiencing intensified droughts or reduced snowpack, which are being exacerbated by rising temperatures (Gonzalez et al. Citation2018; May et al. Citation2018). These impacts, combined with increasing water demand from a growing population, can reduce the future reliability of water supplies (Gonzalez et al. Citation2018).
Increasing temperatures
Climate change presents a variety of challenges in terms of water resources. Rising winter temperatures affect the proportion of precipitation falling as snow, resulting in declines in the end-of-season snow water equivalent (the amount of water contained within the snowpack) in the West since the 1980s (Pederson, Betancourt, and McCabe Citation2013). Observations indicate that rising temperatures are causing earlier snowmelt runoff (Lall et al. Citation2018). This is especially important in areas where water supply is dominated by spring snowmelt (Easterling et al. Citation2017). Increasing temperatures are also causing glaciers to melt, which can alter stream water volume, water temperature, and runoff timing in Alaska and the western United States. “As temperatures continue to rise, there is a risk of decreased and highly variable water supplies for human use and ecosystem maintenance” (Lall et al. Citation2018).
Increasing temperatures also result in increased water consumption, particularly in the agriculture sector. Irrigated agriculture is one of the Nation’s main consumers of water, with irrigation being used for crop production in most of the West (Gowda et al. Citation2018) and the northern part of the Midwest, where coarse soils of lower water-holding capacity are more vulnerable to drying (Angel et al. Citation2018). Rising temperatures combined with insufficient precipitation and the resulting increases in irrigation requirements will likely result in substantial groundwater depletion in the coming decades (Döll Citation2009). Groundwater currently provides more than 40% of the water used for agriculture (irrigation and livestock), as well as for domestic water supplies across the United States (Lall et al. Citation2018). In many locations, groundwater is being depleted due to increased pumping during dry spells and concentrated demands in urban areas (Russo and Lall Citation2017). The depletion of groundwater exacerbates drought risk, as the ability to meet water needs is diminished (Lall et al. Citation2018).
Precipitation
Historical changes in annual precipitation amounts vary both regionally and seasonally. Nationally, the total amount of precipitation has increased since the beginning of the 20th century, with the largest increases occurring in the fall season and the smallest in winter (Easterling et al. Citation2017). Regionally, increases in annual precipitation have been observed in the Northeast, Midwest, and Great Plains regions, with decreases seen over parts of the Southwest and Southeast (Hayhoe et al. Citation2018). In some U.S. regions, continued warming and increasing consumption will increase stress on and adversely affect the reliability of water supplies. In addition, increased water demand due to a growing population could exceed future supply in areas experiencing decreasing amounts of precipitation (Lall et al. Citation2018), particularly if efforts are not made to increase water-use efficiency in rural and urban areas (Sankarasubramanian et al. Citation2017).
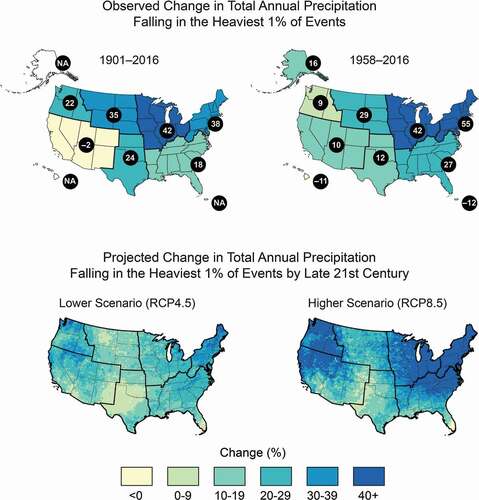
Extreme precipitation events have increased in both frequency and magnitude since the beginning of the 20th century across most of the United States and are projected to continue to increase over this century under both lower and higher scenarios. One example to consider is heavy precipitation events above the 99th percentile of daily values. Since 1901, the amount of precipitation occurring in these heaviest 1% of events has increased in all regions of CONUS, with the exception of the Southwest. The Northeast and Midwest regions experienced the greatest increases and are projected to see continued increases under both a lower and higher scenario (). The upward trends in such extreme precipitation events are also linked to increases in the occurrence and intensity of organized thunderstorm clusters across the northern and central United States (Hayhoe et al. Citation2018). Isolated thunderstorms and other severe phenomena such as tornadoes occur over smaller areas and much shorter time periods, making it difficult to detect trends or develop future projections (Kossin et al. Citation2017). However, “there is some indication that, in a warmer world, the number of days with conditions conducive to severe thunderstorm activity is likely to increase” (Hayhoe et al. Citation2018). Increases in extreme precipitation are projected to occur in all regions of the United States, even those where the total amount of precipitation is expected to decline, such as the Southwest. For instance, under a higher scenario the number of 2-day duration extreme events exceeding a 5-year return period is projected to increase by two to three times the historical average in every region of the contiguous United States (Easterling et al. Citation2017).
Figure 8. Figure from NCA4 shows that heavy precipitation is becoming more intense and more frequent across most of the United States, particularly in the Northeast and Midwest, and that these trends are projected to continue in the future. This map shows the observed (top; numbers in black circles give the percentage change) and projected (bottom) change in the amount of precipitation falling in the heaviest 1% of events (above the 99th percentile of the distribution). Observed historical trends are quantified in two ways. The observed trend for 1901–2016 (top left) is calculated as the difference between 1901–1960 and 1986–2016. The values for 1958–2016 (top right), a period with a denser station network, are linear trend changes over the period. The trends are averaged over each National Climate Assessment region (see Hayhoe et al. Citation2018 for full methodology). Projected future trends are for a lower (RCP4.5, bottom left) and a higher (RCP8.5, bottom right) scenario for the period 2070–2099 relative to 1986–2015. Data for projected changes in heavy precipitation were not available for Alaska, Hawai‘i, or the U.S. Caribbean. Sources: Hayhoe et al. Citation2018; top maps adapted from Easterling et al. Citation2017
Floods
Flooding can occur in many forms, including, but not limited to, flash floods from smaller rivers and creeks, prolonged flooding along major rivers, urban flooding unassociated with riverways, high tide flooding in coastal towns, and larger-scale coastal flooding from storm surge (which may be exacerbated by sea level rise).
Major flooding across the United States is often related to extreme precipitation events. Flash floods are associated with extreme precipitation events that occur along rivers, upstream of at-risk locations. Activities such as deforestation, urbanization, dams, and floodwater management techniques can affect streamflow rates and potentially alter the effects of such flooding.
Major rivers in the West are fed by snowmelt from mountain snowpack. Substantial snow accumulations, especially those followed by a “rain on snow” event, can lead to flooding in late winter or spring. Such flooding can also occur due to a sudden increase in temperature that results in rapid snowmelt within a river basin (Wehner et al. Citation2017). Mountain snowpack in western coastal states can also be substantially increased by extreme precipitation events known as atmospheric rivers (ARs). ARs transport water vapor from the tropics. When they reach the United States, the water vapor rises and condenses to create heavy precipitation in the form of rain or snow (NOAA Citation2017). ARs account for 30%–40% of the typical snowpack in the Sierra Nevadas (Guan et al. Citation2010), as well as a significant amount of annual precipitation along the West Coast, and are an essential summertime source of water for agriculture, consumption, and ecosystem health (Kossin et al. Citation2017). They are also associated with severe flooding when adding large amounts of rainfall to existing snow cover (Guan et al. Citation2016) but can be critical in ending droughts (Dettinger Citation2013). Projections of ARs indicate that they are likely to increase in both frequency and intensity; however, there is no clear consensus on whether these changes will translate to increased precipitation (Kossin et al. Citation2017). Also, “as winter temperatures increase, the fraction of precipitation falling as snow will decrease, potentially disrupting western U.S. water management practices” (Wehner et al. Citation2017).
Hurricanes and tropical storms also lead to major flooding events in the East (Wehner et al. Citation2017), and climate models project an increase in tropical cyclone intensity, as well as an increase in the number of major hurricanes (Category 4 and 5 storms). The overall number of tropical storms is not projected to increase; however, the most intense storms may become more frequent and produce more rainfall in a warming world (Knutson et al. Citation2015). As a result, socially and economically vulnerable coastal residents are particularly at risk from freshwater flooding, as well as secondary effects such as landslides (Hayhoe et al. Citation2018). The long-term impacts on these communities are somewhat unclear. Fleming et al. (Citation2018) note that the effects of a storm can extend far beyond the directly affected areas, as with Hurricane Katrina, which resulted in people relocating to all 50 states with economic and social impacts felt nationwide. Sea level rise could also lead to the migration of large populations, with 13.1 million people potentially at risk of needing to migrate due to a 6-foot rise in sea level by the year 2100 (Hauer Citation2017).
America’s coasts are increasingly threatened by tidal flooding due to coastal storms, high tides, and sea level rise, which is increasing in frequency, depth, and extent. These trends are projected to continue, with some regions more vulnerable than others (Hayhoe et al. Citation2018). “Since the 1960s, sea level rise has already increased the frequency of high tide flooding by a factor of 5 to 10 for several U.S. coastal communities” (Sweet et al. Citation2014). Risks are exacerbated by storm surge, which may occur due to extreme precipitation events and rising sea levels. Even under a lower-emissions future, coastal communities will suffer financial impacts as flooding leads to higher costs and lower property values. “Actions to plan for and adapt to more frequent, widespread, and severe coastal flooding would decrease direct losses and cascading impacts” (Fleming et al. Citation2018).
In a changing climate, flood-prone regions of the United States are becoming increasingly vulnerable to compound events – “the combination of two or more hazard events or climate variables over space and/or time that leads to an extreme impact” (Lall et al. Citation2018). When such events occur, risks to both the natural and the human environment are amplified. Infrastructure is especially vulnerable, as many systems are interconnected, and the failure of one component can in turn lead to the failure of critical facilities such as water and wastewater treatment plants, refineries, and even hospitals. Hurricane Katrina (in 2005), Superstorm Sandy (in 2012), and Hurricane Harvey (in 2017) are all examples of compound extreme events that led to widespread flooding with cascading effects on crucial infrastructure. For further details, see NCA4 Chapter 17: “Sector Interactions, Multiple Stressors, and Complex Systems” (Clarke et al. Citation2018b).
Although there is a clear link between flooding and extreme rainfall, trends in flood occurrence are much harder to discern (Hirsch and Ryberg Citation2012; Hodgkins et al. Citation2017). “Although extreme precipitation is one of the controlling factors in flood statistics, a variety of other compounding factors, including local land use, land-cover changes, and water management also play important roles” (Easterling et al. Citation2017). The relationship between human-induced warming and riverine flooding is still unclear, with regards to both observed and projected changes (Wehner et al. Citation2017). However, “extreme precipitation events are projected to increase in a warming climate and may lead to more severe floods and greater risk of infrastructure failure in some regions” (Lall et al. Citation2018).
Drought
Drought affects water availability in many parts of the United States, and the combination of variable precipitation and increasing temperatures is intensifying drought in many regions. Changes in precipitation and runoff, combined with changes in withdrawal and consumption, have led to reduced surface and groundwater supplies. Surface soil moisture is projected to decrease across much of the United States due to increased evaporation rates in a warming world. “This means that, all else being equal, future droughts in most regions will likely be stronger and potentially last longer” (Hayhoe et al. Citation2018). Despite recent droughts of record intensity, there is no detectable trend in long-term drought for the country as a whole, and the 1930s Dust Bowl era still remains the benchmark for drought and extreme heat in the United States (Lall et al. Citation2018).
Water quality
Each of the extreme events described above can have complex effects on water quality (Peterson et al. Citation2014), and a changing climate can impact water conditions in a variety of additional ways. For example, projected increases in water temperatures, when combined with projected increases in the intensity of extreme precipitation events and changes in runoff, can lead to degraded water quality as contaminants are released into waterways at greater rates (Jastram and Rice Citation2015). Such changes, “pose challenges related to the cost and implications of water treatment, and they present a risk to water supplies, public health, and aquatic ecosystems” (Lall et al. Citation2018). Saltwater intrusion into coastal rivers and aquifers threatens the supply of drinking water and coastal infrastructure, as well as local ecosystems (Kolb et al. Citation2017). Saltwater intrusion is often exacerbated by storm surge, altered freshwater runoff, and sea level rise, which is projected to continue in the future (Sweet et al. Citation2017). Water management, as well as both agricultural and urban land-use changes, also impacts water conditions in a changing climate, and terrestrial ecosystem changes such as wildfire and the increased frequency of forest pest and disease outbreaks can have indirect impacts on water quality (Lall et al. Citation2018).
Water infrastructure and management
Impacts to the water sector are exacerbated by aging and deteriorating infrastructure. In some parts of the United States, critical water infrastructure is nearing the end of its design life, increasing the risk of failure (Lall et al. Citation2018). The estimated combined cost of reconstruction and maintenance for dams, levees, aqueducts, sewers, and water and wastewater treatment systems totals trillions of dollars (Lall et al. Citation2018). Many public water systems (which provide safe drinking water) are at risk, and public health could potentially be affected if issues with wastewater treatment facilities and stormwater management systems are not addressed. Vast losses could also result from dam failures; as of 2019, 15,600 U.S. dams are listed as high risk (ASCE Citation2021).
Infrastructure is also at risk from the projected increases in the intensity of extreme precipitation events, which may lead to more severe floods. Dams and levees could also be compromised if erosion or subsidence (sinking) occurs, if there is a reduction in soil strength, or if the ground cracks due to drying because of long-lasting droughts and/or heat waves (Lall et al. Citation2018). These infrastructure risks currently remain unquantified, however, as to date there has been no comprehensive assessment of the climate-related vulnerability of U.S. water infrastructure (Lall et al. Citation2018). Also, “there are no common design standards or operational guidelines that address how infrastructure should be designed and operated in the face of changing climate risk” (Lall et al. Citation2018), and many risk assessment procedures rely on out-of-date information related to the frequency and severity of extreme events (Cheng et al. Citation2014). Statistical methods incorporating observed and projected changes in climate extremes have been developed for analyzing climate risk; however, these still need to be incorporated into infrastructure design and operations (Lall et al. Citation2018).
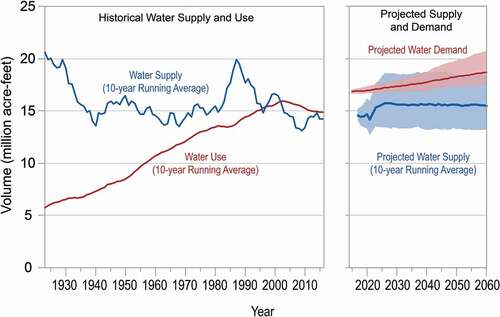
Water planning and management strategies also need to address risk in our changing climate. Adapting to future climate conditions that are broader in scope than experienced in the past is a key challenge, with much action occurring at the local level (Lempert et al. Citation2018). “Doing so requires approaches that evaluate plans over many possible futures instead of just one, incorporate real-time monitoring and forecast products to better manage extremes when they occur, and update policies and engineering principles with the best available geoscience-based understanding of global change” (Lall et al. Citation2018). shows an example of a challenge faced by water managers in many U.S. locations – a potential imbalance between future supply and demand but with considerable long-term variability that is not well understood for the future.
Figure 9. Figure from NCA4 shows the Colorado River Basin historical water supply and use (left) and projected water supply and demand (right). For the projections, the dark lines are the median values, and the shading represents the 10th to 90th percentile range. Sources: Lall et al. Citation2018, adapted from U.S. Bureau of Reclamation Citation2012
Developing new approaches may also involve updates to regulatory and legal aspects of water management, community planning, and infrastructure design. Sufficient funding and maintenance related to adapting water policy and infrastructure would also help overcome the challenges posed by climate change. Such challenges are heightened for smaller, rural, and other communities with limited financial or technical resources (Lall et al. Citation2018).
Regional highlights
Every region of the United States is impacted differently by climate change, but the following examples are of particular significance.
Although energy resources are abundant across the central United States, energy infrastructure is at risk from climate change and extreme weather (Conant et al. Citation2018). Diverse land use and variable climate across the Northern Great Plains pose challenges for the sustainable use of water, land, and energy resources by competing urban, suburban, rural, and tribal populations (Conant et al. Citation2018). Water-related challenges in particular will be exacerbated by future changes in precipitation and the potential for more extreme precipitation events. People and economies in the Southern Great Plains are at risk from a variety of extreme weather, such as hurricanes, flooding, severe storms with large hail, tornadoes, blizzards, ice storms, relentless winds, heat and cold waves, and drought. Several of these climate-related extremes (such as heat, drought, flooding, and severe storms) are expected to increase in intensity and frequency. Others, such as extreme cold events, are projected to decrease (Kloesel et al. Citation2018). Rising sea levels will make the built environment of the Texas Gulf Coast increasingly vulnerable to disruption, especially as infrastructure ages (Kloesel et al. Citation2018).
Residents in the Northeast, particularly those in urban areas, face multiple climate hazards, including extreme temperatures, episodes of poor air quality, recurrent waterfront and coastal flooding due to sea level rise and storm events, and heavy downpours that can lead to increased flooding on urban streams (Dupigny-Giroux et al. Citation2018).
In the Midwest, many communities are at risk from climate change impacts such as increases in urban heat islands, drought, and flooding. Critical infrastructure, including stormwater management systems, are already experiencing impacts from changing precipitation patterns and elevated flood risks (Angel et al. Citation2018).
Flooding is a major concern in the Southeast due to the combined effects of increases in extreme rainfall and rising sea levels, with coastal and low-lying regions being particularly vulnerable (Carter et al. Citation2018; Fleming et al. Citation2018). Air pollution is also a significant concern in the region, which experiences stagnant air masses on 40% of summer days (Schnell and Prather Citation2017), with major urban centers already being impacted by poor air quality during warmer months (Carter et al. Citation2018). Rising temperatures are expected to increase ozone levels, and drier fall conditions could result in longer ozone-exposure seasons (Zhang and Wang Citation2016). However, there is more uncertainty related to changes in cloud cover, precipitation, and winds (Nolte et al. Citation2018). Changes in wind patterns and an increase in precipitation could actually reduce overall ozone health impacts (EPA Citation2017b). Meanwhile, the region is experiencing a rapid urbanization trend, which is expected to increase aeroallergens through localized increases in temperature and CO2 levels. Projections of more frequent and larger wildfires, combined with increasing development at the wildland–urban interface, also pose significant risks to communities of the Southeast (Vose et al. Citation2018).
Increasing storm intensity and flooding are concerns in the Northwest, where existing water, transportation, and energy infrastructure also face challenges from heat waves, wildfire, drought, and landslides (May et al. Citation2018). Alaska is one of the fastest-warming regions on Earth and faces a multitude of climate-related impacts. Communities and infrastructure are affected by thawing permafrost, melting glaciers, and flooding and coastal erosion resulting from changes in sea ice, as well as increases in wildfire frequency and extent (Markon et al. Citation2018). Frontline communities, including tribes and Indigenous peoples, are often disproportionately affected by climate change and are often less able to adapt (May et al. Citation2018).
The Southwest is particularly vulnerable to drought, which may occur more frequently in the future due to rising air temperatures (Lall et al. Citation2018). The intensification of drought events, as well as heavy downpours and reduced snowpack, combines with increasing water demands from a growing population, groundwater depletion, and deteriorating infrastructure to reduce the reliability of water supplies and decrease the ability of hydropower and fossil fuel electricity generation to meet growing energy use (Gonzalez et al. Citation2018). Human health in the region is affected not only by low water quality and availability but also extreme heat, ground-level ozone pollution, aeroallergens, and particulate air pollution from wildfires and dust storms (USGCRP Citation2017). Wildfire is a major concern in the Southwest, as it increasingly threatens people and homes (Abatzoglou and Williams Citation2016). Forests are more susceptible to burning in a changing climate, and an increasing number of residents and communities are threatened as building expands in fire-prone areas (Gonzalez et al. Citation2018).
Dependable water supplies are a concern for communities of the U.S. Caribbean, Hawaiʻi, and the U.S.-Affiliated Pacific Islands, which are each threatened by increasing temperatures, rising seas, saltwater intrusion, and the increased risk of both extreme drought and flooding (Gould et al. Citation2018; Keener et al. Citation2018). The U.S. Caribbean, in particular, is highly vulnerable to disaster-related risks and is already experiencing an increasing frequency of extreme events, such as hurricanes, that threaten life, property, and the economy (Gould et al. Citation2018).
Conclusion and implications for the future
The impacts and implications of climate change, such as those described in this paper, are already being felt across the United States and are projected to intensify. The severity of these future impacts will depend largely on actions taken to reduce GHGs, as well as Americans’ ability to adapt to the changes that occur. “Decisions made today determine risk exposure for current and future generations and will either broaden or limit options to reduce the negative consequences of climate change” (Jay et al. Citation2018). As climate-related risks continue to grow, Americans increasingly recognize the impacts to their everyday lives and livelihoods and are beginning to respond. Information on observed changes and impacts that affect human welfare and society, along with projections for the future, is therefore highly valuable for informing decision-makers, including utility managers, emergency planners, and other stakeholders as they plan for the future.
Risks posed by a changing climate vary by region and sector and also by the vulnerability of those experiencing impacts. “Social, economic, and geographic factors shape the exposure of people and communities to climate-related impacts and their capacity to respond” (Jay et al. Citation2018). Low-income communities, some communities of color, children, and the elderly often experience the greatest level of risk (Ebi et al. Citation2018).
Adaptation, to both short- and long-term risks, is one form of risk management. Individuals, communities, businesses, and governments can take adaptation actions at many different scales, with a large amount occurring at the local level. “Adaptation actions can yield beneficial short-term and/or longer-term outcomes in excess of their costs, based on economic returns, ecological benefits, and broader concepts of social welfare and security” (Lempert et al. Citation2018).
Integrating climate risk management into existing design, planning, and operations practices can provide many benefits and is more likely to succeed because it augments already-familiar processes with new information and tools. However, dedicated, stand-alone adaptation approaches are also important to address the full range of climate impacts. For more on climate change adaptation and risk management, see NCA4 Chapter 28: “Reducing Risks Through Adaptation Actions” (Lempert et al. Citation2018).
Climate change mitigation efforts can also be implemented to reduce the long-term risks of climate change. Both adaptation and mitigation responses to climate change are likely to occur as part of an iterative risk management strategy in which learning occurs and actions are modified over time. For more on climate change mitigation–related activities see NCA4 Chapter 29: “Reducing Risks Through Emissions Mitigation” (Martinich et al. Citation2018).
Disclaimer
The findings and conclusions in this report are those of the authors and do not necessarily represent the official position of the National Oceanic and Atmospheric Administration (NOAA), the United States Global Change Research Program (USGCRP), or any individual authors of National Climate Assessment reports.
Acknowledgment
The authors appreciate the comments and recommendations from K. Kunkel and A. McCarrick that have improved the paper.
Disclosure statement
No potential conflict of interest was reported by the author(s).
Additional information
Funding
Notes on contributors
Laura E. Stevens
Laura E. Stevens is a Research Associate with North Carolina State University and the Cooperative Institute for Satellite Earth System Studies (CISESS) at NOAA’s National Centers for Environmental Information (NCEI) in Asheville, NC.
Thomas K. Maycock
Thomas K. Maycock is a science editor and Science Public Information Officer with North Carolina State University and the Cooperative Institute for Satellite Earth System Studies (CISESS) at NOAA’s National Centers for Environmental Information (NCEI) in Asheville, NC.
Brooke C. Stewart
Brooke C. Stewart is a Research Associate with North Carolina State University and the Cooperative Institute for Satellite Earth System Studies (CISESS) at NOAA’s National Centers for Environmental Information (NCEI) in Asheville, NC.
References
- Abatzoglou, J. T., and A. P. Williams. 2016. Impact of anthropogenic climate change on wildfire across western US forests. Proc. Natl. Acad. Sci. 113 (42):11770. doi:https://doi.org/10.1073/pnas.1607171113.
- Abatzoglou, J. T., and C. A. Kolden. 2013. Relationships between climate and macroscale area burned in the western United States. Int. J. Wildland Fire 22 (7):1003–20. doi:https://doi.org/10.1071/WF13019.
- Angel, J., C. Swanson, B. M. Boustead, K. C. Conlon, K. R. Hall, J. L. Jorns, K. E. Kunkel, M. C. Lemos, B. Lofgren, T. A. Ontl, et al. 2018. Midwest. In Impacts, risks, and adaptation in the United States: Fourth national climate assessment, ed. D. R. Reidmiller, C. W. Avery, D. Easterling, K. Kunkel, K. L. M. Lewis, T. K. Maycock, and B. C. Stewart, Vol. II, 872–940. Washington, DC: U.S. Global Change Research Program. doi:https://doi.org/10.7930/NCA4.2018.CH21.
- ASCE. 2017. 2017 infrastructure report card: Energy, 6. American Society of Civil Engineers (ASCE), Reston, VA. https://www.infrastructurereportcard.org/wp-content/uploads/2017/01/Energy-Final.pdf
- ASCE. 2021. 2021 infrastructure report card, 8. American Society of Civil Engineers, Reston, VA. https://infrastructurereportcard.org/wp-content/uploads/2020/12/Dams-2021.pdf
- Ayres, M. P., J. A. Hicke, B. K. Kerns, D. McKenzie, J. S. Littell, L. E. Band, C. H. Luce, A. S. Weed, and C. L. Raymond. 2014. Disturbance regimes and stressors. In Climate Change and United States Forests, ed. D. L. Peterson, J. M. Vose, and T. Patel-Weynand, 55–92. Dordrecht: Springer Netherlands. doi:https://doi.org/10.1007/978-94-007-7515-2_4.
- Bentz, B., J. Logan, J. MacMahon, C. D. Allen, M. Ayres, E. Berg, A. Carroll, M. Hansen, J. Hicke, L. Joyce, et al. 2005. Bark Beetle Outbreaks in Western North America: Causes and Consequences. Bark Beetle Symposium; Snowbird, UT; November, 2005, 42. Salt Lake City: University of Utah Press (for USFS). https://www.fs.fed.us/rm/pubs_other/rmrs_2009_bentz_b001.pdf
- Boucher, P. B., S. Hancock, D. A. Orwig, L. Duncanson, J. Armston, H. Tang, K. Krause, B. Cook, I. Paynter, Z. Li, et al. 2020. Detecting Change in Forest Structure with Simulated GEDI Lidar Waveforms: A Case Study of the Hemlock Woolly Adelgid (HWA; Adelges tsugae) Infestation. Remote Sensing 12 (8):1304. doi:https://doi.org/10.3390/rs12081304.
- Camalier, L., W. Cox, and P. Dolwick. 2007. The effects of meteorology on ozone in urban areas and their use in assessing ozone trends. Atmos. Environ. 41 (33):7127–37. doi:https://doi.org/10.1016/j.atmosenv.2007.04.061.
- Campbell, J. L., L. E. Rustad, E. W. Boyer, S. F. Christopher, C. T. Driscoll, I. J. Fernandez, P. M. Groffman, D. Houle, J. Kiekbusch, A. H. Magill, et al. 2009. Consequences of climate change for biogeochemical cycling in forests of northeastern North AmericaThis article is one of a selection of papers from NE Forests 2100: A Synthesis of Climate Change Impacts on Forests of the Northeastern US and Eastern Canada. Canadian J. For. Res. 39 (2):264–84. doi:https://doi.org/10.1139/X08-104.
- Carter, L., A. Terando, K. Dow, K. Hiers, K. E. Kunkel, A. Lascurain, D. Marcy, M. Osland, and P. Schramm. 2018. Southeast. In Impacts, Risks, and Adaptation in the United States: Fourth National Climate Assessment, ed. D. R. Reidmiller, C. W. Avery, D. Easterling, K. Kunkel, K. L. M. Lewis, T. K. Maycock, and B. C. Stewart, Vol. II, 743–808. Washington, DC: U.S. Global Change Research Program. doi:https://doi.org/10.7930/NCA4.2018.CH19.
- Cheng, L., and A. AghaKouchak. 2014. Nonstationary precipitation intensity-duration-frequency curves for infrastructure design in a changing climate. Sci. Rep. 4 (1):7093. doi:https://doi.org/10.1038/srep07093.
- Choat, B., S. Jansen, T. J. Brodribb, H. Cochard, S. Delzon, R. Bhaskar, S. J. Bucci, T. S. Feild, S. M. Gleason, U. G. Hacke, et al. 2012. Global convergence in the vulnerability of forests to drought. Nature 491 (7426):752–55. doi:https://doi.org/10.1038/nature11688.
- Clarke, L., L. Nichols, R. Vallario, M. Hejazi, J. Horing, A. C. Janetos, K. Mach, M. Mastrandrea, M. Orr, B. L. Preston, et al. 2018b. Sector Interactions, Multiple Stressors, and Complex Systems. In Impacts, Risks, and Adaptation in the United States: Fourth National Climate Assessment, ed. D. R. Reidmiller, C. W. Avery, D. Easterling, K. Kunkel, K. L. M. Lewis, T. K. Maycock, and B. C. Stewart, Vol. II, 638–68. Washington, DC: U.S. Global Change Research Program. doi:https://doi.org/10.7930/NCA4.2018.CH17.
- Clarke, L., J. Eom, E. H. Marten, R. Horowitz, P. Kyle, R. Link, B. K. Mignone, A. Mundra, and Y. Zhou. 2018a. Effects of long-term climate change on global building energy expenditures. Energy Economics 72:667–77. doi:https://doi.org/10.1016/j.eneco.2018.01.003.
- Clean Air Act Amendments of 1990. Pub. L. No. 101–549, 1630 Stat. November 15, 1990
- Conant, R. T., D. Kluck, M. Anderson, A. Badger, B. M. Boustead, J. Derner, L. Farris, M. Hayes, B. Livneh, S. McNeeley, et al. 2018. Northern Great Plains. In Impacts, Risks, and Adaptation in the United States: Fourth National Climate Assessment, ed. D. R. Reidmiller, C. W. Avery, D. Easterling, K. Kunkel, K. L. M. Lewis, T. K. Maycock, and B. C. Stewart, Vol. II, 941–86. Washington, DC: U.S. Global Change Research Program. doi:https://doi.org/10.7930/NCA4.2018.CH22.
- DeAngelo, B., J. Edmonds, D. W. Fahey, and B. M. Sanderson. 2017. Perspectives on climate change mitigation. In Climate science special report: Fourth national climate assessment, ed. D. J. Wuebbles, D. W. Fahey, K. A. Hibbard, D. J. Dokken, B. C. Stewart, and T. K. Maycock, Vol. 1, 393–410. Washington, DC: U.S. Global Change Research Program. doi:https://doi.org/10.7930/J0M32SZG.
- Dettinger, M. D. 2013. Atmospheric rivers as drought busters on the U.S. West Coast. J. Hydrometeorol. 14 (6):1721–32. doi:https://doi.org/10.1175/JHM-D-13-02.1.
- DOE. 2013. U.S. energy sector vulnerabilities to climate change and extreme weather. DOE/PI-0013, 73. U.S. Department of Energy (DOE), Washington, DC. http://www.energy.gov/downloads/us-energy-sector-vulnerabilities-climate-change-and-extreme-weather
- DOE. 2015. Climate change and the U.S. energy sector: Regional vulnerabilities and resilience solutions. DOE/EPSA-0005, 189. U.S. Department of Energy (DOE), Washington, DC. https://energy.gov/sites/prod/files/2015/10/f27/Regional_Climate_Vulnerabilities_and_Resilience_Solutions_0.pdf
- DOE. 2017. Staff Report to the Secretary on Electricity Markets and Reliability, 181. U.S. Department of Energy (DOE), Washington, DC. https://energy.gov/staff-report-secretary-electricity-markets-and-reliability
- DOI. 2021. Suppression. U.S. Department of the Interior (DOI) office of wildland fire. https://www.doi.gov/wildlandfire/suppression
- Döll, P. 2009. Vulnerability to the impact of climate change on renewable groundwater resources: A global-scale assessment. Environ. Res. Lett. 4 (3):35006. doi:https://doi.org/10.1088/1748-9326/4/3/035006.
- Dunckel, K., A. Weiskittel, and G. Fiske. 2017. Projected future distribution of Tsuga canadensis across alternative climate scenarios in Maine, U.S. Forests 8 (8):285. doi:https://doi.org/10.3390/f8080285.
- Dupigny-Giroux, L. A., E. L. Mecray, M. D. Lemcke-Stampone, G. A. Hodgkins, E. E. Lentz, K. E. Mills, E. D. Lane, R. Miller, D. Y. Hollinger, W. D. Solecki, et al. 2018. Northeast. In Impacts, risks, and adaptation in the United States: Fourth national climate assessment, ed. D. R. Reidmiller, C. W. Avery, D. Easterling, K. Kunkel, K. L. M. Lewis, T. K. Maycock, and B. C. Stewart, Vol. II, 669–742. Washington, DC,: U.S. Global Change Research Program. doi:https://doi.org/10.7930/NCA4.2018.CH18.
- Easterling, D. R., K. E. Kunkel, J. R. Arnold, T. Knutson, A. N. LeGrande, L. R. Leung, R. S. Vose, D. E. Waliser, and M. F. Wehner. 2017. Precipitation change in the United States. In Climate science special report: Fourth national climate assessment, ed. D. J. Wuebbles, D. W. Fahey, K. A. Hibbard, D. J. Dokken, B. C. Stewart, and T. K. Maycock, Vol. I, 207–30. Washington, DC: U.S. Global Change Research Program. doi:https://doi.org/10.7930/J0H993CC.
- Ebi, K. L., J. M. Balbus, G. Luber, A. Bole, A. Crimmins, G. Glass, S. Saha, M. M. Shimamoto, J. Trtanj, and J. L. White-Newsome. 2018. Human health. In Impacts, risks, and adaptation in the United States: Fourth national climate assessment, ed. D. R. Reidmiller, C. W. Avery, D. Easterling, K. Kunkel, K. L. M. Lewis, T. K. Maycock, and B. C. Stewart, Vol. II, 539–71. Washington, DC: U.S. Global Change Research Program. doi:https://doi.org/10.7930/NCA4.2018.CH14.
- EPA. 2009. Integrated science assessment for particulate matter. EPA/600/R-08/139F. National Center for Environmental Assessment, Office of Research and Development, U.S. Environmental Protection Agency, Research Triangle Park, NC. http://cfpub.epa.gov/ncea/cfm/recordisplay.cfm?deid=216546
- EPA. 2016. Emissions inventory for air quality modeling technical support document: Heavy-duty vehicle greenhouse gas phase 2 final rule. EPA-420-R-16-008, 199. U.S. Environmental Protection Agency (EPA), Washington, DC. https://nepis.epa.gov/Exe/ZyPURL.cgi?Dockey=P100PKEE.txt
- EPA. 2017a. National air quality: Status and trends of key air pollutants [website]. U.S. Environmental Protection Agency (EPA), Washington, DC. https://www.epa.gov/air-trends
- EPA. 2017b. Multi-model framework for quantitative sectoral impacts analysis: A technical report for the fourth national climate assessment. EPA 430‐R‐17‐001, 271. U.S. Environmental Protection Agency (EPA), Washington, DC. https://cfpub.epa.gov/si/si_public_record_Report.cfm?dirEntryId=335095
- EPA. 2020. Inventory of U.S. greenhouse gas emissions and sinks: 1990–2018 EPA 430-R-20-002, 733. U.S. Environmental Protection Agency, Washington, DC. https://www.epa.gov/ghgemissions/inventory-us-greenhouse-gas-emissions-and-sinks-1990-2018
- Fahey, D. W., S. J. Doherty, K. A. Hibbard, A. Romanou, and P. C. Taylor. 2017. Physical drivers of climate change. In Climate science special report: Fourth national climate assessment,ed. D. J. Wuebbles, D. W. Fahey, K. A. Hibbard, D. J. Dokken, B. C. Stewart, and T. K. Maycock, Vol. 1, 73–113. doi:https://doi.org/10.7930/J0513WCR.
- Fann, N., A. D. Lamson, S. C. Anenberg, K. Wesson, D. Risley, and B. J. Hubbell. 2012. Estimating the national public health burden associated with exposure to ambient PM2.5 and ozone. Risk Anal. 32 (1):81–95. doi:https://doi.org/10.1111/j.1539-6924.2011.01630.x.
- Fann, N., T. Brennan, P. Dolwick, J. L. Gamble, V. Ilacqua, L. Kolb, C. G. Nolte, T. L. Spero, and L. Ziska. 2016. Ch. 3: Air quality impacts. In The impacts of climate change on human health in the United States: A scientific assessment, ed. A. Crimmins, J. Balbus, J. L. Gamble, C. B. Beard, J. E. Bell, D. Dodgen, R. J. Eisen, N. Fann, M. D. Hawkins, S. C. Herring, L. Jantarasami, D. M. Mills, S. Saha, M. C. Sarofim, J. Trtanj, and L. Ziska, 69–98. Washington, DC: U.S. Global Change Research Program. doi:https://doi.org/10.7930/J0GQ6VP6.
- Fiore, A. M., V. Naik, and E. M. Leibensperger. 2015. Air quality and climate connections. J. Air Waste Manage. Assoc. 65 (6):645–85. doi:https://doi.org/10.1080/10962247.2015.1040526.
- Fleming, E., J. Payne, W. Sweet, M. Craghan, J. Haines, J. F. Hart, H. Stiller, and A. Sutton-Grier. 2018. Coastal effects. In Impacts, risks, and adaptation in the United States: Fourth national climate assessment, ed. D. R. Reidmiller, C. W. Avery, D. Easterling, K. Kunkel, K. L. M. Lewis, T. K. Maycock, and B. C. Stewart, Vol. II, 322–52. Washington, DC: U.S. Global Change Research Program. doi:https://doi.org/10.7930/NCA4.2018.CH8.
- Gergel, D. R., B. Nijssen, J. T. Abatzoglou, D. P. Lettenmaier, and M. R. Stumbaugh. 2017. Effects of climate change on snowpack and fire potential in the western USA. Clim. Chang. 141 (2):287–99. doi:https://doi.org/10.1007/s10584-017-1899-y.
- Gonzalez, P., G. M. Garfin, D. D. Breshears, K. M. Brooks, H. E. Brown, E. H. Elias, A. Gunasekara, N. Huntly, J. K. Maldonado, N. J. Mantua, et al. 2018. Southwest. In Impacts, risks, and adaptation in the United States: Fourth national climate assessment, ed. D. R. Reidmiller, C. W. Avery, D. Easterling, K. Kunkel, K. L. M. Lewis, T. K. Maycock, and B. C. Stewart, Vol. II, 1101–84. Washington, DC: U.S. Global Change Research Program. doi:https://doi.org/10.7930/NCA4.2018.CH25.
- Gould, W. A., E. L. Díaz (co-leads), N. L. Álvarez-Berríos, F. Aponte-González, W. Archibald, J. H. Bowden, L. Carrubba, W. Crespo, S. J. Fain, G. González, et al. 2018. U.S. Caribbean. In Impacts, risks, and adaptation in the United States: Fourth national climate assessment, ed. D. R. Reidmiller, C. W. Avery, D. Easterling, K. Kunkel, K. L. M. Lewis, T. K. Maycock, and B. C. Stewart, Vol. II, 809–71. Washington, DC: U.S. Global Change Research Program. doi:https://doi.org/10.7930/NCA4.2018.CH20.
- Gowda, P., J. L. Steiner, C. Olson, M. Boggess, T. Farrigan, and M. A. Grusak. 2018. Agriculture and rural communities. In Impacts, risks, and adaptation in the United States: Fourth national climate assessment, ed. D. R. Reidmiller, C. W. Avery, D. Easterling, K. Kunkel, K. L. M. Lewis, T. K. Maycock, and B. C. Stewart, Vol. II, 391–437. Washington, DC: U.S. Global Change Research Program. doi:https://doi.org/10.7930/NCA4.2018.CH10.
- Guan, B., D. E. Waliser, F. M. Ralph, E. J. Fetzer, and P. J. Neiman. 2016. Hydrometeorological characteristics of rain-on-snow events associated with atmospheric rivers. Geophys. Res. Lett. 43 (6):2964–73. doi:https://doi.org/10.1002/2016GL067978.
- Guan, B., N. P. Molotch, D. E. Waliser, E. J. Fetzer, and P. J. Neiman. 2010. Extreme snowfall events linked to atmospheric rivers and surface air temperature via satellite measurements. Geophys. Res. Lett. 37 (20):L20401. doi:https://doi.org/10.1029/2010GL044696.
- Hauer, M. E. 2017. Migration induced by sea-level rise could reshape the US population landscape. Nat. Clim. Chang. 7 (5):321–25. doi:https://doi.org/10.1038/nclimate3271.
- Hayhoe, K., J. Edmonds, R. E. Kopp, A. N. LeGrande, B. M. Sanderson, M. F. Wehner, and D. J. Wuebbles. 2017. Climate models, scenarios, and projections. In Climate science special report: Fourth national climate assessment, ed. D. J. Wuebbles, D. W. Fahey, K. A. Hibbard, D. J. Dokken, B. C. Stewart, and T. K. Maycock, Vol. I, 133–60. Washington, DC: U.S. Global Change Research Program. doi:https://doi.org/10.7930/J0WH2N54.
- Hayhoe, K., D. J. Wuebbles, D. R. Easterling, D. W. Fahey, S. Doherty, J. Kossin, W. Sweet, R. Vose, and M. Wehner. 2018. Our changing climate. In Impacts, risks, and adaptation in the United States: Fourth national climate assessment, ed. D. R. Reidmiller, C. W. Avery, D. Easterling, K. Kunkel, K. L. M. Lewis, T. K. Maycock, and B. C. Stewart, Vol. II, 72–144. Washington, DC: U.S. Global Change Research Program. doi:https://doi.org/10.7930/NCA4.2018.CH2.
- Hirsch, R. M., and K. R. Ryberg. 2012. Has the magnitude of floods across the USA changed with global CO2 levels? Hydrol. Sci. J. 57 (1):1–9. doi:https://doi.org/10.1080/02626667.2011.621895.
- Hodgkins, G. A., P. H. Whitfield, D. H. Burn, J. Hannaford, B. Renard, K. Stahl, A. K. Fleig, H. Madsen, L. Mediero, J. Korhonen, et al. 2017. Climate-driven variability in the occurrence of major floods across North America and Europe. J. Hydrol. 552:704–17. doi:https://doi.org/10.1016/j.jhydrol.2017.07.027.
- Hsiang, S., R. Kopp, A. Jina, J. Rising, M. Delgado, S. Mohan, D. J. Rasmussen, R. Muir-Wood, P. Wilson, M. Oppenheimer, et al. 2017. Estimating economic damage from climate change in the United States. Science 356 (6345):1362–69. doi:https://doi.org/10.1126/science.aal4369.
- Ilacqua, V., J. Dawson, M. Breen, S. Singer, and A. Berg. Effects of climate change on residential infiltration and air pollution exposure. 2015. J. Expo. Sci. Environ. Epidemiol. 27(1):16–23, May 27. Published online. doi:https://doi.org/10.1038/jes.2015.38.
- Jastram, J. D., and K. C. Rice, 2015: Air- and stream-water-temperature trends in the chesapeake bay region, 1960–2014. Open-File Report 2015-1207, 35. U. S. Geological Survey, Reston, VA. doi:https://doi.org/10.3133/ofr20151207.
- Jay, A., D. R. Reidmiller, C. W. Avery, D. Barrie, B. J. DeAngelo, A. Dave, M. Dzaugis, M. Kolian, K. L. M. Lewis, K. Reeves, et al. 2018. Overview. In Impacts, risks, and adaptation in the United States: Fourth national climate assessment, ed. D. R. Reidmiller, C. W. Avery, D. Easterling, K. Kunkel, K. L. M. Lewis, T. K. Maycock, and B. C. Stewart, Vol. II, 33–71. Washington, DC: U.S. Global Change Research Program. doi:https://doi.org/10.7930/NCA4.2018.CH1.
- Jenkins, M. J., J. B. Runyon, C. J. Fettig, W. G. Page, and B. J. Bentz. 2014. Interactions among the mountain pine beetle, fires, and fuels. For. Sci. 60 (3):489–501. doi:https://doi.org/10.5849/forsci.13-017.
- Jhun, I., N. Fann, A. Zanobetti, and B. Hubbell. 2014. Effect modification of ozone-related mortality risks by temperature in 97 US cities. Environ. Int. 73:128–34. doi:https://doi.org/10.1016/j.envint.2014.07.009.
- Keane, R. E., K. C. Ryan, T. T. Veblen, C. D. Allen, J. A. Logan, and B. Hawkes. 2002. The cascading effects of fire exclusion in the Rocky Mountain ecosystems. In Rocky mountain futures: An ecological perspective, ed. J. S. Baron, 133–52. Washington, DC: Island Press.
- Keener, V., D. Helweg, S. Asam, S. Balwani, M. Burkett, C. Fletcher, T. Giambelluca, Z. Grecni, M. Nobrega-Olivera, J. Polovina, et al. 2018. Hawaiʻi and U.S.-Affiliated Pacific Islands. In Impacts, risks, and adaptation in the United States: Fourth national climate assessment, ed. D. R. Reidmiller, C. W. Avery, D. Easterling, K. Kunkel, K. L. M. Lewis, T. K. Maycock, and B. C. Stewart, Vol. II, 1242–308. Washington, DC: U.S. Global Change Research Program. doi:https://doi.org/10.7930/NCA4.2018.CH27.
- Kloesel, K., B. Bartush, J. Banner, D. Brown, K. Hayhoe, J. Lemery, X. Lin, C. Loeffler, G. McManus, E. Mullens, et al. 2018. Southern great plains. In Impacts, risks, and adaptation in the United States: Fourth national climate assessment, ed. D. R. Reidmiller, C. W. Avery, D. Easterling, K. Kunkel, K. L. M. Lewis, T. K. Maycock, and B. C. Stewart, Vol. II, 987–1035. Washington, DC: U.S. Global Change Research Program. doi:https://doi.org/10.7930/NCA4.2018.CH23.
- Knutson, T. R., J. J. Sirutis, M. Zhao, R. E. Tuleya, M. Bender, G. A. Vecchi, G. Villarini, and D. Chavas. 2015. Global projections of intense tropical cyclone activity for the late twenty-first century from dynamical downscaling of CMIP5/RCP4.5 scenarios. J. Clim. 28 (18):7203–24. doi:https://doi.org/10.1175/JCLI-D-15-0129.1.
- Kolb, C., M. Pozzi, C. Samaras, and J. M. VanBriesen. 2017. Climate change impacts on bromide, trihalomethane formation, and health risks at coastal groundwater utilities. ASCE-ASME J. Risk Uncertainty Eng. Syst. A. 3 (3):04017006. doi:https://doi.org/10.1061/AJRUA6.0000904.
- Kossin, J. P., T. Hall, T. Knutson, K. E. Kunkel, R. J. Trapp, D. E. Waliser, and M. F. Wehner. 2017. Extreme storms. In Climate science special report: Fourth national climate assessment, ed. D. J. Wuebbles, D. W. Fahey, K. A. Hibbard, D. J. Dokken, B. C. Stewart, and T. K. Maycock, Vol. I, 257–76. Washington, DC: U.S. Global Change Research Program. doi:https://doi.org/10.7930/J07S7KXX.
- Krist, F. J., J. R. Ellenwood, M. E. Woods, A. J. McMahan, J. P. Cowardin, D. E. Ryerson, F. J. Sapio, M. O. Zweifler, and S. A. Romero. 2014. 2013–2027 national insect and disease forest risk assessment. FHTET-14-01, 199. U.S. Forest Service, Forest Health Technology Enterprise Team (FHTET), Fort Collins, CO. https://www.fs.fed.us/foresthealth/technology/pdfs/2012_RiskMap_Report_web.pdf
- Kunkel, K. E., S. E. Stevens, L. E. Stevens, and T. R. Karl. 2020. Observed climatological relationships of extreme daily precipitation events with precipitable water and vertical velocity in the contiguous United States. Geophys. Res. Lett. 47 (12):e2019GL086721. doi:https://doi.org/10.1029/2019GL086721.
- Lall, U., T. Johnson, P. Colohan, A. Aghakouchak, C. Brown, G. McCabe, R. Pulwarty, and A. Sankarasubramanian. 2018. Water. In Impacts, risks, and adaptation in the United States: Fourth national climate assessment, ed. D. R. Reidmiller, C. W. Avery, D. Easterling, K. Kunkel, K. L. M. Lewis, T. K. Maycock, and B. C. Stewart, Vol. II, 145–73. Washington, DC: U.S. Global Change Research Program. doi:https://doi.org/10.7930/NCA4.2018.CH3.
- Larsen, K., J. Larsen, M. Delgado, W. Herndon, and S. Mohan. 2017. Assessing the effect of rising temperatures: The cost of climate change to the U.S. power sector, 27. New York, NY: Rhodium Group. https://rhg.com/wp-content/uploads/2017/01/RHG_PowerSectorImpactsOfClimateChange_Jan2017-1.pdf
- Lawrence, M. G. 2005. The relationship between relative humidity and the dewpoint temperature in moist Air: A simple conversion and applications. Bull. Am. Meteorol. Soc. 86 (2):225–33. doi:https://doi.org/10.1175/BAMS-86-2-225.
- Leibensperger, E. M., L. J. Mickley, and D. J. Jacob. 2008. Sensitivity of US air quality to mid-latitude cyclone frequency and implications of 1980–2006 climate change. Atmos. Chem. Phys. 8 (23):7075–86. doi:https://doi.org/10.5194/acp-8-7075-2008.
- Lempert, R., J. Arnold, R. Pulwarty, K. Gordon, K. Grieg, C. Hawkins-Hoffman, D. Sands, and C. Werrell. 2018. Reducing risks through adaptation actions. In Impacts, risks, and adaptation in the United States: Fourth national climate assessment, ed. D. R. Reidmiller, C. W. Avery, D. Easterling, K. Kunkel, K. L. M. Lewis, T. K. Maycock, and B. C. Stewart, Vol. II, 1309–45. Washington, DC: U.S. Global Change Research Program. doi:https://doi.org/10.7930/NCA4.2018.CH28.
- Litschert, S. E., T. C. Brown, and D. M. Theobald. 2012. Historic and future extent of wildfires in the Southern Rockies ecoregion, USA. For. Ecol. Manage. 269:124–33. doi:https://doi.org/10.1016/j.foreco.2011.12.024.
- Maloney, M. C., and B. L. Preston. 2014. A geospatial dataset for U.S. hurricane storm surge and sea-level rise vulnerability: Development and case study applications. Clim. Risk Manage. 2:26–41. doi:https://doi.org/10.1016/j.crm.2014.02.004.
- Markon, C., S. Gray, M. Berman, L. Eerkes-Medrano, T. Hennessy, H. Huntington, J. Littell, M. McCammon, R. Thoman, and S. Traino. 2018. Alaska. In Impacts, risks, and adaptation in the United States: Fourth national climate assessment, ed. D. R. Reidmiller, C. W. Avery, D. Easterling, K. Kunkel, K. L. M. Lewis, T. K. Maycock, and B. C. Stewart, Vol. II, 1185–241. Washington, DC: U.S. Global Change Research Program. doi:https://doi.org/10.7930/NCA4.2018.CH26.
- Martinich, J., B. J. DeAngelo, D. Diaz, B. Ekwurzel, G. Franco, C. Frisch, J. McFarland, and B. O’Neill. 2018. Reducing risks through emissions mitigation. In Impacts, risks, and adaptation in the United States: Fourth national climate assessment, ed. D. R. Reidmiller, C. W. Avery, D. Easterling, K. Kunkel, K. L. M. Lewis, T. K. Maycock, and B. C. Stewart, Vol. II, 1346–86. Washington, DC: U.S. Global Change Research Program. doi:https://doi.org/10.7930/NCA4.2018.CH29.
- May, K., C. Luce, J. Casola, M. Chang, J. Cuhaciyan, M. Dalton, S. Lowe, G. Morishima, P. Mote, A. Petersen, et al. 2018. Northwest. In Impacts, risks, and adaptation in the United States: Fourth national climate assessment, ed. D. R. Reidmiller, C. W. Avery, D. Easterling, K. Kunkel, K. L. M. Lewis, T. K. Maycock, and B. C. Stewart, Vol. II, 1036–100. Washington, DC: U.S. Global Change Research Program. doi:https://doi.org/10.7930/NCA4.2018.CH24.
- Moss, R. H., J. A. Edmonds, K. A. Hibbard, M. R. Manning, S. K. Rose, D. P. van Vuuren, T. R. Carter, S. Emori, M. Kainuma, T. Kram, et al. 2010. The next generation of scenarios for climate change research and assessment. Nature 463 (7282):747–56. doi:https://doi.org/10.1038/nature08823.
- NOAA. 2017. What are atmospheric rivers? National oceanic and atmospheric administration. https://www.noaa.gov/stories/what-are-atmospheric-rivers
- NOAA. 2021. State of the climate: Global climate report—Annual 2020. NOAA National Centers for Environmental Information. https://www.ncdc.noaa.gov/sotc/global/202013
- Nolte, C. G., P. D. Dolwick, N. Fann, L. W. Horowitz, V. Naik, R. W. Pinder, T. L. Spero, D. A. Winner, and L. H. Ziska. 2018. Air quality. In Impacts, risks, and adaptation in the United States: Fourth national climate assessment, ed. D. R. Reidmiller, C. W. Avery, D. Easterling, K. Kunkel, K. L. M. Lewis, T. K. Maycock, and B. C. Stewart, Vol. II, 512–38. Washington, DC: U.S. Global Change Research Program. doi:https://doi.org/10.7930/NCA4.2018.CH13.
- Ojima, D. S., L. R. Iverson, B. L. Sohngen, J. M. Vose, C. W. Woodal, G. M. Domke, D. L. Peterson, J. S. Littell, S. N. Matthews, A. M. Prasad, et al. 2014. Risk assessment. In Climate change and United States forests, ed. D. L. Peterson, J. M. Vose, and T. Patel-Weynand, 223–44. Dordrecht, The Netherlands: Springer.
- Pederson, G. T., J. L. Betancourt, and G. J. McCabe. 2013. Regional patterns and proximal causes of the recent snowpack decline in the Rocky Mountains, U.S. Geophys. Res. Lett. 40 (9):1811–16. doi:https://doi.org/10.1002/grl.50424.
- Peterson, T. C., T. R. Karl, J. P. Kossin, K. E. Kunkel, J. H. Lawrimore, J. R. McMahon, R. S. Vose, and X. Yin. 2014. Changes in weather and climate extremes: State of knowledge relevant to air and water quality in the United States. J. Air Waste Manage. Assoc. 64 (2):184–97. doi:https://doi.org/10.1080/10962247.2013.851044.
- Ren, C., G. M. Williams, L. Morawska, K. Mengersen, and S. Tong. 2008. Ozone modifies associations between temperature and cardiovascular mortality: Analysis of the NMMAPS data. Occup. Environ. Med. 65 (4):255. doi:https://doi.org/10.1136/oem.2007.033878.
- Russo, T. A., and U. Lall. 2017. Depletion and response of deep groundwater to climate-induced pumping variability. Nat. Geosci. 10 (2):105–08. doi:https://doi.org/10.1038/ngeo2883.
- Sankarasubramanian, A., J. L. Sabo, K. L. Larson, S. B. Seo, T. Sinha, R. Bhowmik, A. R. Vidal, K. Kunkel, G. Mahinthakumar, E. Z. Berglund, et al. 2017. Synthesis of public water supply use in the United States: Spatio-temporal patterns and socio-economic controls. Earth’s Future 5 (7):771–88. doi:https://doi.org/10.1002/2016EF000511.
- Schnell, J. L., and M. J. Prather. 2017. Co-occurrence of extremes in surface ozone, particulate matter, and temperature over eastern North America. Proc. Natl. Acad. Sci. U.S.A. 114 (11):2854–59. doi:https://doi.org/10.1073/pnas.1614453114.
- Sturrock, R. N., S. J. Frankel, A. V. Brown, P. E. Hennon, J. T. Kliejunas, K. J. Lewis, J. J. Worrall, and A. J. Woods. 2011. Climate change and forest diseases. Plant Pathol. 60 (1):133–49. doi:https://doi.org/10.1111/j.1365-3059.2010.02406.x.
- Sweet, W., J. Park, J. Marra, C. Zervas, and S. Gill. 2014. Sea level rise and nuisance flood frequency changes around the United States. NOAA Technical Report NOS CO-OPS 073, 58. Silver Spring, MD: National Oceanic and Atmospheric Administration, National Ocean Service. http://tidesandcurrents.noaa.gov/publications/NOAA_Technical_Report_NOS_COOPS_073.pdf
- Sweet, W. V., R. Horton, R. E. Kopp, A. N. LeGrande, and A. Romanou. 2017. Sea level rise. In Climate science special report: Fourth national climate assessment, ed. D. J. Wuebbles, D. W. Fahey, K. A. Hibbard, D. J. Dokken, B. C. Stewart, and T. K. Maycock, Vol. I, 333–63. Washington, DC: U.S. Global Change Research Program. doi:https://doi.org/10.7930/J0VM49F2.
- U.S. Bureau of Reclamation. 2012. Colorado river basin water supply and demand study. Study report. Prepared by the Colorado River Basin Water Supply and Demand Study Team, 95. Denver, CO: U.S. Department of the Interior, Bureau of Reclamation, December. https://www.usbr.gov/lc/region/programs/crbstudy/finalreport/Study%20Report/CRBS_Study_Report_FINAL.pdf
- USGCRP. 2017. Climate science special report: Fourth national climate assessment, Eds D. J. Wuebbles, D. W. Fahey, K. A. Hibbard, D. J. Dokken, B. C. Stewart, and T. K. Maycock, Vol. I, 470. Washington, DC: U.S. Global Change Research Program. doi:https://doi.org/10.7930/J0J964J6.
- USGCRP. 2018. Impacts, risks, and adaptation in the United States: Fourth national climate assessment, ed. D. R. Reidmiller, C. W. Avery, D. R. Easterling, K. E. Kunkel, T. K. M. K. L. M. Lewis, and B. C. Stewart, Vol. II. Report-in-Brief. Washington, DC: U.S. Global Change Research Program. doi:https://doi.org/10.7930/NCA4.2018.RiB.
- USGCRP. 2021a. USGCRP indicator platform: Global surface temperatures. U.S. Global Change Research Program. https://www.globalchange.gov/browse/indicator-details/3656
- USGCRP. 2021b. USGCRP indicator platform: Sea level rise. U.S. Global Change Research Program. https://www.globalchange.gov/browse/indicator-details/3977
- USGCRP. 2021c. USGCRP indicator platform: U.S. surface temperatures. https://www.globalchange.gov/browse/indicator-details/3663
- Vose, J. M., D. L. Peterson, G. M. Domke, C. J. Fettig, L. A. Joyce, R. E. Keane, C. H. Luce, J. P. Prestemon, L. E. Band, J. S. Clark, et al. 2018. Forests. In Impacts, risks, and adaptation in the United States: Fourth national climate assessment, ed. D. R. Reidmiller, C. W. Avery, D. Easterling, K. Kunkel, K. L. M. Lewis, T. K. Maycock, and B. C. Stewart, Vol. II, 232–67. Washington, DC: U.S. Global Change Research Program. doi:https://doi.org/10.7930/NCA4.2018.CH6.
- Wehner, M. F., J. R. Arnold, T. Knutson, K. E. Kunkel, and A. N. LeGrande. 2017. Droughts, floods, and wildfires. In Climate science special report: Fourth national climate assessment, ed. D. J. Wuebbles, D. W. Fahey, K. A. Hibbard, D. J. Dokken, B. C. Stewart, and T. K. Maycock, Vol. I, 231–56. Washington, DC: U.S. Global Change Research Program. doi:https://doi.org/10.7930/J0CJ8BNN.
- Westerling, A. L. 2016. Increasing western US forest wildfire activity: Sensitivity to changes in the timing of spring. Philosophical Trans. R Soc. B. 371 (1696):20150178. doi:https://doi.org/10.1098/rstb.2015.0178.
- Wuebbles, D. J., D. R. Easterling, K. Hayhoe, T. Knutson, R. E. Kopp, J. P. Kossin, K. E. Kunkel, A. N. LeGrande, C. Mears, W. V. Sweet, et al. 2017. Our globally changing climate. In Climate science special report: Fourth national climate assessment, ed. D. J. Wuebbles, D. W. Fahey, K. A. Hibbard, D. J. Dokken, B. C. Stewart, and T. K. Maycock, Vol. I, 35–72. Washington, DC: U.S. Global Change Research Program. doi:https://doi.org/10.7930/J08S4N35.
- Zamuda, C., D. E. Bilello, G. Conzelmann, E. Mecray, A. Satsangi, V. Tidwell, and B. J. Walker. 2018. Energy supply, delivery, and demand. In Impacts, risks, and adaptation in the United States: Fourth national climate assessment, ed. D. R. Reidmiller, C. W. Avery, D. Easterling, K. Kunkel, K. L. M. Lewis, T. K. Maycock, and B. C. Stewart, Vol. II, 174–201. Washington, DC: U.S. Global Change Research Program. doi:https://doi.org/10.7930/NCA4.2018.CH4.
- Zhang, Y., and Y. Wang. 2016. Climate-driven ground-level ozone extreme in the fall over the Southeast United States. Proc. Natl. Acad. Sci. U.S.A. 113 (36):10025–30. doi:https://doi.org/10.1073/pnas.1602563113.