
 ?Mathematical formulae have been encoded as MathML and are displayed in this HTML version using MathJax in order to improve their display. Uncheck the box to turn MathJax off. This feature requires Javascript. Click on a formula to zoom.
ABSTRACT
Coefficient of Haze (CoH) was the official proxy for the mass concentration of particulate matter in the US from ca. 1950 onwards. Originally, a linearity between CoH and sample load was claimed, but although shortly after the introduction of the method it was found that the relation between mass loading and the fraction of light 10 absorbed by the sample was identical to the nonlinear curve of the European “Black Smoke” (BS) method this correction was not officially adopted. We found that BS is a linear proxy for Elemental Carbon (EC) enabling an easy nonlinear conversion of CoH to EC concentration. Earlier it had been assumed that light-absorption by a sample is equal in the two methods, although CoH is obtained by light transmission while BS by light reflection. The “Filter Smoke Number” (FSN), used for diesel-soot emissions, is in essence the light-absorption by samples collected on the same filter type as in the CoH method (but probed in reflection). We noticed that the curve relating load and FSN is indistinguishable from the BS/EC curve. Ingram showed that light-absorption measured in reflection and transmission for this filter type is highly similar, so the standard BS/EC curve can be used to compare BS/EC and CoH. At low loadings the relation of EC concentration and CoH was quite similar to the equivalency factor of Black Carbon (BC) concentration and CoH. At CoH = 8, the historic limit of a severe smog day; however, the EC/BC-concentration alone was three times higher than that based on a (linear) equivalency factor. At CoH = 8, EC/BC mass concentrations alone reached the OSHA 8-hr workplace exposure limit of 150 µg m−3 for total carbon (the sum of organic carbon (OC) and EC).
Implications: In this MS we show that the historic database of Coefficient of Haze (CoH) data can be converted to Elemental Carbon (EC) concentrations via several steps involving other historic and current measurement techniques (the European Black Smoke (BS) technique and techniques to measure Black Carbon (BC) and EC). The originally claimed linear relation between CoH and sample load is in reality a strongly nonlinear relation, so using the original linear relation leads to severe underestimations of historic EC concentrations especially on days with high concentrations of EC.
Introduction
The parameter Coefficient of Haze (CoH) was a proxy for air pollution in the US in the second half of the 20th century. Its value was in essence based on the fraction of light absorbed by filter samples of particulate matter (PM) obtained with a standard automated sampler for PM as described in the next section. It was determined in a number of networks in the US.
A conversion of CoH to the mass concentration of Black Carbon (BC, a term used to indicate the analyte of optical measurement methods) is of relevance because eBC is a proxy for Elemental Carbon (EC, a term used to indicate the analyte of thermal-optical measurement methods) to assess historic levels of EC as it is strongly associated with negative health effects (Janssen et al. Citation2011) which must have been more severe in the past given the elevated CoH levels (Kirchstetter et al. Citation2017). Furthermore, EC/BC absorbs solar radiation which is a substantial factor in positive radiative forcing leading to global warming (IPCC Citation2013). EC/BC was very likely a major anthropogenic warming component in the 1950s based on emission estimates by Bond et al. (Citation2007). Measurements of the parameter CoH started in the 1950s and with the equivalency factor historic BC mass concentrations were reconstructed from the CoH data (Kirchstetter et al. Citation2008, Citation2017).
In a short calibration test with laboratory soot Kirchstetter et al. (Citation2017) noticed that CoH did not linearly follow filter loading, so they used long-term averages of CoH values in their determination of an equivalency factor between CoH and BC mass concentration (obtained from co-located measurements with the CoH instrument and an aethalometer). This non-linearity is in contrast to the linear relation of CoH and filter loading claimed by the manufacturer at the time of invention (Hemeon, Haines, and Ide Citation1953). However, a non-linearity was already found shortly after introduction in studies in Australia (Sullivan Citation1962), Canada (Sanderson and Katz Citation1963) and South-Africa (Kemeny Citation1962) and also in a study in the late 1960s in the US (Ingram and Golden Citation1973). We use the latter study here because the highly similar Black Smoke (BS) method was also tested there. We also address the non-linearity in more general terms because it is a general feature of light absorption measurements of samples collected on fibrous filters.
In the absence of quantitative data on the non-linearity as a function of filter loading in the CoH approach we used an indirect route via BS, a parameter also based on measurements of the light-absorption by aerosol samples collected on paper fiber filters, so the two parameters should be intimately related. This relation was investigated in the early years of application of both CoH and BS methods (Ingram and Golden Citation1973), who showed a table and a graph of the nonlinear relation. However, this relation was not based on measurements as we found in our analysis (see section 3), but we show in the present study that the assumptions made by Ingram and Golden (Citation1973) were indeed valid.
The non-linearity between light-absorption (definition given below) and filter loading is due to a piling up of particles on top of each other inside the pores of fibrous filters, especially at elevated loadings (Hinds Citation1999; Park, Hansen, and Cho (Citation2010). This leads to a deviation from the log-linear relationship between light absorption and loading as expressed by Beer’s law, a well-known phenomenon in aethalometer measurements known as “loading effect” (Weingartner et al. Citation2003). Aethalometer derived BC mass concentrations are usually corrected for this non-linearity (Virkkula et al. Citation2007). An even stronger nonlinear relation between CoH and filter loading is to be expectedbecause the fiber filter (Whatman-4) is of a coarser material than the aethalometer filter tape. In the next section we present an analysis of the CoH-method.
Experimental method, uncertainties and nonlinear relation of CoH and loading
In essence CoH is the value of the fraction of light absorbed by aerosol filter samples collected with the “AISI” automated tape sampler (Hemeon, Haines, and Ide Citation1953) using a Whatman-4 cellulose fiber filter. Light-absorption by the filter deposits was measured in transmittance and expressed as the 10log of the ratio of the light passing a blank filter and that passing the samples. One unit of CoH was defined as equal to 0.01 of this logarithm. CoH was translated into an absorption coefficient so that results obtained with different sampling volumes could be compared. The unit CoH per 1000 linear feet was defined, written as CoH/1000ʹ. It expressed the absorption per 1000 linear feet of the column of air sampled through the loaded filter spot, which is equal to the ratio of the sampled air volume divided by the surface area of the spot; in mathematical form:
with L = sampling volume/sample surface area; with L in units of 1000 ft; at standard sampling conditions L equals 5.5.
EquationEquation 1(1)
(1) is, incidentally, similar to that for the attenuation (ATN) used in the aethalometer from which value the BC mass concentration is derived, except that ATN is expressed in terms of the natural logarithm. In most reports and publications values of CoH are presented while in reality these are in the unit CoH/1000ʹ. We will follow this convention.
We could not find a report on a standardization of the method in contrast to that for the BS-method described in the next section. There are only some graphs with a few rather scattered data points in the original publication by the manufacturer (Hemeon, Haines, and Ide Citation1953). From these it was claimed that a linear relationship between mass loading and CoH existed, which from thereon was taken as a basic feature of the method.
The most pertinent information on the CoH-approach was found in a publication by Ingram and Golden (Citation1973) and specifically in the underlying detailed report (Ingram Citation1969), where the transmittance of an unused filter tape was measured. The standard deviation of the transmittance values (i.e. the spot-to spot differences) was found to be 3%; a similar value can be deduced from studies by Sullivan (Citation1962) and Heidorn (Citation1980), which translates to an uncertainty of CoH of 0.25. Incidentally, this uncertainty is lower (<1%) in the Black Smoke method in which the light-absorption is probed in reflection, as discussed in section 3 below.
A rough check of the linearity of the method was made by Ingram and Golden (Citation1973) in comparing the CoH value of a single 2-hr sample with that obtained as the average of two consecutive 1-hr samples. This comparison indicated that a CoH value of 4 for a standard 2-hr sample corresponded to a CoH of approximately 6 for the average of the two 1-hr samples, implying that the relationship between loading and CoH is nonlinear. A non-linearity was also noticed in Australia (Sullivan Citation1962) and South-Africa (Kemeny Citation1962). In Canada (Sanderson and Katz Citation1963) a Whatman-52 filter with smaller pores was used for which still a quite nonlinear dependence was seen. We proceed to address this non-linearity in a quantitative way via the analogy of the CoH approach with that of the Black Smoke method and that in the method to measure the so-called Filter Smoke Number (FSN), the standard method for diesel soot emissions (e.g. AVL Citation2005). The FSN is measured using the same filter type as for CoH, but absorption is probed in reflection.
Black Smoke, Filter Smoke Number and their relation with the Coefficient of Haze
Ingram and Golden (Citation1973) applied the BS method in New York in a series of measurements. The aim of the study was to relate values of CoH, the reference measure for air pollution in the US, to that of the “mass” concentration as obtained with the BS method as reference European measure for air pollution by PM. A full description of the official measuring and quality assurance protocol is provided by Ingram (Citation1969) in his report on behalf of US-EPA that we summarize here. Instead of the Whatman-4 filter prescribed in the CoH method, a Whatman-1 cellulose filter was used with the same diameter as that in the CoH method, but the (standard) sample period was 24 hrs. Originally BS was meant as a proxy for the gravimetric mass loading on the filters, but it was already realized at the time that it was in fact a proxy for light-absorbing carbon. The relation of the fraction of light absorbed and actual filter mass loading was assessed via the so-called normalization approach in an elaborate protocol of OECD (Citation1964). The key feature in this approach is the use of “proportional sampling” with which samples of the same aerosol with increasing loadings are obtained. This is accomplished via a number of parallel sampling lines with pumps intermittently operated at different time intervals. The light reflected by the samples is determined with a reflectometer. The intensity of light reflected from a blank filter is set to 100 (%). Then, the reflectivity of a loaded filter is determined. The light-absorption is defined as the linear difference in intensity of the light reflected by the blank and loaded filters, divided by the intensity of the light reflected by a blank filter, expressed as Darkness Index (DI) in %. Its relation with the CoH as measure for the light-absorption is discussed in the Appendix A and used here in section 4.
The normalization of the mass loading versus light-absorption as expressed by DI occurs as follows. In a separate line the aerosol is collected on a glass fiber filter for weighing; the cutoff diameter of the sampler is similar to the one of the BS-sampler(s) and roughly equivalent to that of PM10 (ten Brink, Hitzenberger, and Keuken Citation2021). The tests in New York City were performed in the Lower East Side and at a site close to the NE tip of Manhattan in the years 1966 to 1968; the relation between light absorption and absolute mass loading at the two sites was highly similar. The shape of this nonlinear curve was the same as that of the international standard BS-curve (OECD Citation1964). In absolute terms the normalized “PM10” mass loading at the reference absorption value (DI) of 25% was close to 30 µg cm−2 compared to 20 µg cm−2 for standard BS.
In our evaluation of the report (Ingram Citation1969), we noticed that the graph relating CoH and mass loading was not based on comparison measurements, but constructed with the assumption that the fraction of the light absorbed by a sample obtained with the CoH method was the same as that in the BS-approach. In the following we examine this, while providing the details of our evaluation of the study by Ingram and Golden (Citation1973) in the Supplementary Material (S1.1).
We found two crucial points: a) in the BS method light absorption is probed by light reflection, while in the CoH approach it is probed by transmission and b) the filters are of a different type.
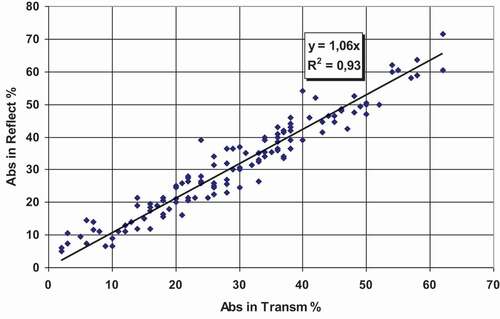
With respect to issue a), Ingram (Citation1969) studied the comparability of absorption obtained in transmission and reflection from the same sample. We evaluated the data given in the report and found that absorption measured in reflection is 1.06 times that in transmission with an R2 of 0.93 (). A similarly high correlation was found by other authors (Saucier and Sansone Citation1972; Sullivan Citation1962) but with different regression coefficients. Issue b) is the use of a different filter type in the CoH and BS methods; the fraction of the light absorbed by the same sample might be different. However, we provide evidence from literature of the comparability via an analysis of the light-absorption in the FSN approach. The parameter FSN is basically the light absorption by a standardized filter sample, expressed on a scale from 0 to 10. In this way 1 unit of FSN equals 10 units of darkness index (DI) in the BS-method.
Figure 1. Relation of the fraction of light absorbed by samples probed in reflection versus that in transmission with absorption expressed as the difference in the light received for a loaded versus a blank filter, in percentage as usual in the BS method; data from Ingram (Citation1969)
We compared the curve of EC mass loading versus FSN (expressed in DI units) and the EC curve versus DI (based on an equivalency factor of 0.15 between EC and BS (ten Brink, Hitzenberger, and Keuken Citation2021)). In the Appendix A, in which the issue is further discussed, shows that the shape of the graph of EC mass loading versus FSN is indistinguishable from that of EC versus DI, within the uncertainty limits of the methods. This implies that the relation between EC-mass loading and fraction of light absorbed on Whatman-4 filters is the same as that on Whatman-1 filters. The difference in the absolute EC mass-values is due to the different methods with which EC is/was determined. Since the fraction of light absorbed in reflection and transmission was equal within the error limits of the measurements (), the relation of EC-load and the fraction of light absorbed in transmission is the same as that with light-absorption measured in reflection ().
Coefficient of Haze versus Elemental Carbon concentration
We turn now to the central theme of our investigation, the assessment of the (nonlinear) relation between EC (BC) mass concentration and CoH, using the relation between DI and CoH discussed in the Appendix A. This empirical relation (see ) was then translated to the corresponding EC concentration using the surface loading of EC and the sampling volume.
The curve shown in is in a form that can be compared with the graph given by Kirchstetter et al. (Citation2017) for BC concentration versus CoH. We used the lower curve of , for this comparison that is a little complicated because Kirchstetter et al. (Citation2017) constructed a linear fit, while the “BS”-curve is highly nonlinear. Therefore we compare the two relations at levels where the non-linearity is small but where values are substantially higher than the lower detection limit of 0.25 CoH units. This implies that such a comparison is only meaningful for a value of CoH > 1. However, even at these values the non-linearity in the relation between CoH and EC is already appreciable. Kirchstetter et al. (Citation2017) give a proportionality factor of 6.7 μg m−3 BC per unit CoH. According to , the EC mass concentration is 7.4 μg m−3 at a CoH of 1.25, and 14.5 μg m−3 at a CoH of 2. These values correspond to an EC mass concentration of 5.8 μg m−3 and 7.6 μg m−3, respectively. This is a good similarity of values for two parameters that are based on different reference methods, as discussed in the Appendix A.
Figure 2. Relation between the concentration of Elemental Carbon (EC) and CoH based on the relation of EC mass concentration and light absorption according to the “standard BS-curve” converted to units of CoH and for CoH values that exceed three times the lower detection limit of 0.25 in the CoH-method
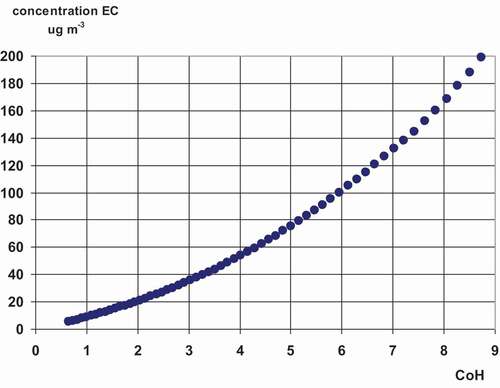
At higher CoH numbers, the associated EC/BC mass concentration is much larger than that obtained with the linear equivalency factor/linear extrapolation of the BC-values. At CoH = 8, which was the marker for harmful smog in the 1970s (US-EPA Citation1975), the corresponding mass concentration of EC/BC is around 150 μg m−3 (), while the linearly extrapolated mass concentration of EC/BC would be less than 50 µg m−3, which is a severe underestimation. Daily values of CoH in excess of 8 were recorded in New York City during severe smog episodes in the 1950s (Greenburg et al. Citation1962). Even taking into account all uncertainties, the associated EC concentration of around 150 µg m−3 alone would be at the current 8-hr exposure limit at workplaces of 150 µg m−3 for the total carbon mass concentration (OSHA Citation2013), which is the sum of EC and organic carbon.
Conclusion
The parameter Coefficient of Haze (CoH) was measured in the USA from the early 1950s until the beginning of this century. We show that its value is nonlinearly related to filter mass loading, although a linear relation was claimed by the manufacturer and US-authorities. We demonstrate that the actual nonlinear relationship corresponds to the standard international “Black Smoke” curve. EC mass loading follows the same curve. We translated the “BS”-curve relating EC and fraction of light absorbed (DI) to a graph of EC loading versus CoH by expressing the DI values in units of CoH. The EC mass-concentrations obtained this way were comparable to those of BC given the uncertainty in the values of these parameters in general, derived from CoH values in the intercomparison tests by Kirchstetter et al. (Citation2017) at the lowest reliable CoH value. At a CoH value of 8, marking the lower limit of severe smog, the nonlinear “BS” relation gives an EC-concentration of around 150 µg m−3, which is three times higher than the linearly extrapolated EC/BC mass concentration. Such a value, incidentally, is close to the OSHA 8-hr workplace exposure limit of 150 µg m−3 for Total Carbon, which consists of EC and organic carbon.
In our literature search we found that for the Whatman-1 and Whatman-4 cellulose fiber filters the light-absorption by samples measured in reflection is much more reliable than in transmission.
Highlights
The “official” linear relation between CoH and filter mass loading does not apply
The relation is that of the strongly nonlinear “Black Smoke/BS” curve
CoH-values can be converted, via the standard BS-curve, to EC-concentrations
Historic EC-levels alone reached the current 8-hr exposure US-limit for total carbon for workplaces
Coefficient_of_Haze_supplementary__material_submitted_21.03.2021_line_numbers.doc
Download MS Word (65.5 KB)Disclosure statement
No potential conflict of interest was reported by the author(s).
Supplemental data
Supplemental data for this paper can be accessed on the publisher’s website.
Additional information
Notes on contributors
Harry Ten Brink
Harry Ten Brink has an MSc in Physical Chemistry (spectroscopy), a Ph.D. in molecular dynamics and 40+ years of expertise in aerosol science; retired.
Regina Hitzenberger
Regina Hitzenberger has a Ph.D. in Physics. She is Professor for Aerosol and Cluster Physics at the University of Vienna, Austria.
References
- AVL. 2005. Smoke value measurements with the filter-paper method. Application Notes. https://www.avl.com/documents/10138/885893/Application+Notes
- Biles, B., and J. M. Ellison. 1975. The efficiency of cellulose fibre filters with respect to lead and black smoke in urban aerosol. Atmos. Environ. 9 (11):1030–32. doi:https://doi.org/10.1016/0004-6981(75)90025-6.
- Birch, M. E., and R. A. Cary. 1996. Elementary Carbon-based method for monitoring occupational exposures to particulate diesel exhaust. Aerosol Sci. Technol. 25 (3):221–41. doi:https://doi.org/10.1080/02786829608965393.
- Bond, T. C., E. Bhardwaj, R. Dong, R. Jogani, S. Jung, C. Roden, D. G. Streets, and N. M. Trautmann. 2007. Historical emissions of black and organic carbon aerosol from energy-related combustion, 1850–2000. Global Biogeochem. Cycles 21 (2):GB2018. doi:https://doi.org/10.1029/2006GB002840.
- Greenburg, L., M. B. Jacobs, B. M. Drolette, F. Field, and M. M. Braverman. 1962. Report of an air pollution incident in New York City, November 1953. Public Health Rep. 77 (1):7–16. doi:https://doi.org/10.2307/4591399.
- Heidorn, K. C. 1980. Errors in the measurement of soiling index due to variations in sampling tape thickness. J. Air Pollut. Control Assoc. 30 (1):56–58. doi:https://doi.org/10.1080/00022470.1980.10465917.
- Hemeon, W. C. L., G. F. Haines Jr., and H. M. Ide. 1953. Determination of Haze and Smoke concentrations by filter paper samplers. Air Repair 3 (1):22–28. doi:https://doi.org/10.1080/00966665.1953.10467585.
- Hinds, W. C. 1999. Aerosol technology - Properties, behavior, and measurement of airborne particles. 2nd ed. NJ: J. Wiley and Sons.
- Ingram, W. T. 1969. Smoke curve calibration. New York: New York University, School of Engineering and Science; PHS contract no. PH-86-68-66. Available at the website of EPA-NSCEP http://nepis.epa.gov/Exe/ZyNET.exe/91002420.TXT
- Ingram, W. T., and J. Golden. 1973. Smoke curve calibration. J. Air Pollut. Control Assoc. 23 (2):110–15. doi:https://doi.org/10.1080/00022470.1973.10469749.
- IPCC. 2013. Climate change 2013: The physical science basis. In Contribution of working Group I to the fifth assessment report of the intergovernmental panel on climate change, ed. T. F. Stocker, D. Qin, G.-K. Plattner, M. Tignor, S. K. Allen, J. Boschung, A. Nauels, Y. Xia, V. Bex, and P. M. Midgley; p. 30. Cambridge, UK; New York, USA: Cambridge University Press.
- ISO. 2019. ISO 8178-3:2019(en) Reciprocating internal combustion engines - Exhaust emission measurement - Part 3: Test procedures for measurement of exhaust gas smoke emissions from compression ignition engines using a filter type smoke meter. https://www.iso.org/obp/ui/#iso:std:iso:8178:-3:ed-2:v1:en
- Janssen, N. A. H., G. Hoek, M. Simic-Lawson, P. Fischer, L. van Bree, H. Ten Brink, M. Keuken, R. W. Atkinson, H. R. Anderson, B. Brunekreef, et al. 2011. Black carbon as an additional indicator of the adverse health effects of airborne particles compared with PM10 and PM2.5. Environ. Health Perspect. 119 (12):1691–99. doi:https://doi.org/10.1289/ehp.1003369.
- Kemeny. 1962. The determination of gravimetric pollution concentrations by means of filter paper. J. Air Pollut. Control Assoc. 12 (6):278–81. doi:https://doi.org/10.1080/00022470.1962.10468078.
- Kirchstetter, T. W., J. Aguiar, S. Tonse, D. Fairley, and T. Novakov. 2008. Black carbon concentrations and diesel vehicle emission factors derived from coefficient of haze measurements in California: 1967 – 2003. Atmos. Environ. 42 (3):480–91. doi:https://doi.org/10.1016/j.atmosenv.2007.09.063.
- Kirchstetter, T. W., C. V. Preble, O. L. Hadley, T. C. Bond, and J. S. Apte. 2017. Large reductions in urban black carbon concentrations in the United States between 1965 and 2000. Atmos. Environ. 151:17–23. doi:https://doi.org/10.1016/j.atmosenv.2016.11.001.
- Northrop, W. F., S. V. Bohac, and J.-Y. Chin. 2011. Comparison of filter smoke number and elemental carbon mass from partially premixed low temperature combustion in a direct-injection diesel engine. J. Eng. Gas Turbines Power 133 (10):102804–06. doi:https://doi.org/10.1115/1.4002918.
- OECD. 1964. Methods of measuring air pollution: Report of the working party on methods of measuring air pollution and survey techniques; Organisation for economic co-operation and development. Directorate for scientific affairs, organization for economic co-operation and development. Working party on methods of measuring air pollution and survey techniques. Chapter II. SMOKE.
- OSHA. 2013. Occupational safety and health administration. Diesel Exhaust/Diesel Particulate Matter. https://www.osha.gov/Publications/OSHA-3590.pdf
- Panteliadis, P., T. Hafkenscheid, B. Cary, E. Diapouli, A. Fischer, O. Favez, P. Quincey, M. Viana, R. Hitzenberger, R. Vecchi, et al. 2015. ECOC comparison exercise with identical thermal protocols after temperature offset correction – Instrument diagnostics by in-depth evaluation of operational parameters. Atmos. Meas. Tech. 8 (2):779–92. doi:https://doi.org/10.5194/amt-8-779-2015.
- Park, S. S., T. D. A. Hansen, and S. Y. Cho. 2010. Measurement of real time black carbon for investigating spot loading effects of Aethalometer data. Atmos. Environ. 44 (11):1449–55. doi:https://doi.org/10.1016/j.atmosenv.2010.01.025.
- Sanderson, H. P., and M. Katz. 1963. The optical evaluation of smoke or particulate matter collected on filter paper. J. Air Pollut. Control Assoc. 13 (10):476–82. doi:https://doi.org/10.1080/00022470.1963.10468208.
- Saucier, J.-Y., and E. B. Sansone. 1972. The relationship between transmittance and reflectance measurements of “soiling index.” Atmos. Environ. 6 (1):37–43. doi:https://doi.org/10.1016/0004-6981(72)90038-8.
- Stettler, M. E., J. J. Swanson, and S. R. Barrett. 2013. Updated correlation between aircraft smoke number and black carbon concentration. Aerosol Sci. Technol. 47 (11):1205–14. doi:https://doi.org/10.1080/02786826.2013.829908.
- Sullivan, J. L. 1962. The calibration of smoke density. J. Air Pollut. Control Assoc. 12 (10):474–78. doi:https://doi.org/10.1080/00022470.1962.10468116.
- Ten Brink, H., R. Hitzenberger, and M. Keuken. 2021. On the equivalency of Black Smoke/British Smoke and historic Elemental Carbon. Atmos. Environ. 244:117857. doi:https://doi.org/10.1016/j.atmosenv.2020.117857.
- US-EPA. 1975. Air pollution indices; a compendium and assessment. https://nepis.epa.gov/Exe/ZyPDF.cgi/910201FI.PDF?Dockey=910201FI.PDF
- Virkkula, A., T. Mäkelä, R. Hillamo, T. Yli-Tuomi, A. Hirsikko, K. Hämeri, and I. K. Koponen. 2007. A simple procedure for correcting loading effects of aethalometer data. J. Air Waste Manag. Assoc. 57 (10):1214–22. doi:https://doi.org/10.3155/1047-3289.57.10.1214.
- Wallin, S. C. 1965. Calibration of the D.S.I.R. standard smoke filter for diesel smoke. Air Water Poll. 9:351–56.
- Weingartner, E., H. Saathoff, M. Schnaiter, N. Streit, B. Bitnar, and U. Baltensperger. 2003. Absorption of light by soot particles: Determination of the absorption coefficient by means of aethalometers. J. Aerosol. Sci. 34 (10):1445–63. doi:https://doi.org/10.1016/S0021-8502(03)00359-8.
Appendix A. Comparability of the light-absorption by samples on Whatman-1 and Whatman-4 filters
In the CoH approach Whatman-4 filters are used that have larger pores than the Whatman-1 type used in the BS-approach. It is suggested that, because of the coarser filter the collection efficiency and the penetration depth of the particles would be less in the CoH method, the fraction of light absorbed by the same aerosol sample is lower (Biles and Ellison, Citation1975). This might seem a valid assumption but we searched in literature for experimental support, or rather experimental data on the relation between loading and light-absorption. We noticed that Whatman-4 filters are in extensive use in assessing the soot emissions in exhaust. The most used is the method with which the “Filter Smoke Number (FSN)” (ISO Citation2019) is obtained as reference criterion for particulate emissions in diesel exhaust, with a standardized sampling procedure and light-probing (AVL Citation2005).
There is a long-established relation between FSN and the mass-loading of the filters (AVL Citation2005) and EC-loading (e.g., Northrop, Bohac, and Chin Citation2011). EC was determined with a thermal optical analyzer according to NIOSH-protocol 5040 (Birch and Cary (Citation1996) for measurements of the levels of diesel soot in working environment. The relation found between EC mass concentration and FSN closely followed that of the standard curve of total mass against FSN (AVL Citation2005), with a correlation coefficient R2 of 94% and a 1:1 slope. The relation is given in equation (A1) with the EC-concentration C in μg m−3 and light-absorption expressed in the unit DI of the BS-method:
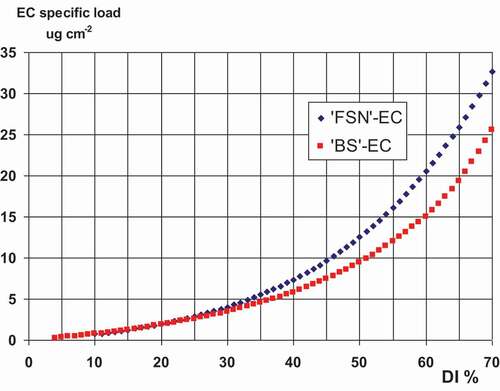
The light-absorption by the filter sample is measured in reflection. The probe light has a quite similar wavelength distribution as in the BS-approach which makes a comparison straightforward. shows the curves relating EC-filter loading and light absorption in the FSN approach (eq. A1) and the “standard Black-Smoke curve” (ten Brink, Hitzenberger, and Keuken Citation2021), with light-absorption expressed in the standard way as the natural logarithm of the ratio of the light reflected by a blank and a loaded filter respectively. The shape of the curves appears to be equal within the uncertainties of the measuring methods. The absolute difference is quite likely due to the different methods used for defining and quantifying EC. The NIOSH approach was applied in combination with the FSN method by Northrop, Bohac, and Chin (Citation2011); this approach was specially developed for freshly emitted soot for which the EC content is high. For EC derived via the BS-method (ten Brink, Hitzenberger, and Keuken Citation2021) the EC values were expressed in concentrations according to the EU-reference protocol EUSAAR-2 TOT (Panteliadis et al. Citation2015).
A final point to be addressed is that freshly emitted diesel exhaust aerosol is assessed in the FSN approach, while in the CoH and BS methods urban aerosol was probed, which contains large amounts of additional components that are non-absorbing but could modify absorption by the sample. However, for samples collected from diesel exhaust by Wallin (Citation1965) the curve relating loading and the fraction of light absorbed was fully similar to that for the standard BS curve for urban aerosol though with a 3–4 smaller absolute mass loading due to the larger proportion of EC in diesel exhaust (ten Brink, Hitzenberger, and Keuken Citation2021). A concern could be that in the FSN-approach the probe light is aimed at a 45° angle onto the filter and the detector is placed at the opposite angle. This configuration may imply that the light has a longer path through the sample in comparison to the perpendicular approach in the BS-method, but the issue under discussion is the form of the curve rather than the absolute values.
Figure A1. Specific loading of EC of samples obtained from light absorption as probed by the FSN approach and via the Black-Smoke method (ten Brink, Hitzenberger, and Keuken Citation2021), expressed in the standard unit DI (percentage of absorbed light)
The empirical graphs of were translated to similar graphs with CoH as the parameter for light-absorption. CoH can be expressed in terms of DI via Equationeq. (1)(1)
(1) noting that the normalized light absorption in transmission and reflection is the same as evidenced in in section 3 of the main text. The normalized absorption in reflection is DI (as a percentage) while that in transmission is (I0-I)/I0. Hence I/I0 in Equationeq. (1)
(1)
(1) can be replaced by 1-DI/100 so a relation between CoH and DI is obtained. For a comparison with the relation of CoH and BC concentration, expressed as ambient concentration in the study by Kirchstetter et al. (Citation2017), we converted the surface concentration to a similar air concentration of EC. This concentration is obtained by multiplying the specific surface load by the loaded filter surface (5.06 cm2) and dividing by the volume of air collected in the standard operational mode in CoH monitoring of 30 ft3, equaling 0.85 m3. This relation is presented as in the main text.
Finally we mention that in aviation the light-absorption by samples on Whatman-4 filters serves as measure for soot emissions with the light-absorption expressed as Smoke Number (SN), which is equivalent to the absorption unit DI in the BS-approach. The Smoke Number is measured in perpendicular reflection. This seems to make this approach ideal for a comparison with the BS-method. We found that the official graph used to relate BC/particle mass concentration and SN (FAO3, Stettler, Swanson, and Barrett (Citation2013)) is highly similar to the BS curve. However, almost all measurements are at the lower detection limit because current emissions are in compliance with the regulations enforcing such low values. Furthermore, soot-particles in the emission of the latest types of turbines are much smaller than that in the older types for which the FAO3 relation applies (Stettler, Swanson, and Barrett Citation2013). This lowers the filter collection efficiency and increase the penetration depth of particles in the filters, affecting the curve relating loading and the fraction of light absorbed and making the Smoke Number method (rather) unsuitable for a comparison with the BS approach.