
ABSTRACT
The use of low-NOx compressed natural gas (CNG) medium-duty vehicles (MDVs) and heavy-duty vehicles (HDVs) has the potential to significantly reduce NOx emissions and yield improvements in regional air quality. However, the extent of air quality improvement depends on many factors including future levels of vehicle deployment, the evolution of emissions from other sources, and meteorology. An analysis of the impacts requires modeling the atmosphere to account for both primary and secondary air pollutants, and the use of health impact assessment tools to map air quality changes into quantifiable metrics of human health. Here, we quantify and compare the air quality and health impacts associated with the deployment of low-NOx CNG engines to power future MDV and HDV fleets in California relative to both a business-as-usual and a more advanced fleet composition. The results project that reductions in summer ground-level ozone could reach 13 ppb when compared to a baseline fleet of diesel and gasoline HDV and MDV and could reach 6 ppb when compared to a cleaner fleet that includes some zero-emission vehicles and fuels. Similarly, for all CNG cases considered reductions in PM2.5 are predicted to range from 1.2 ug/m3 to 2.7 ug/m3 for a summer episode and from 3.1 ug/m3 to approximately 7.8 ug/m3 for a winter episode. These improvements yield short-term health benefits equivalent to $47 to $56 million in summer and $38 to $43 million in winter during episodes conducive to poor air quality. Additionally, the use of zero emission vehicle options such as battery electric and hydrogen fuel cell trucks could achieve approximately 25% to 31% higher benefits for an equivalent fleet penetration level due to the additional emission reductions achieved.
Implications: The paper provides a quantitative estimate of the air quality and human health benefits that can be achieved through the use of novel compressed natural gas engines (i.e., low-NOx CNG) in medium- and heavy-duty vehicles and provide a comparison with zero emission vehicles. Thus, our findings will provide support for policy development seeking to transform the trucking sector to meet clean air and climate goals given the current struggle policymakers have with selecting between alternative truck technologies due to variance in factors like cost and technical maturity.
Introduction
California environmental quality targets require mobile sources to attain reductions in criteria air pollutants to ensure compliance with federal air quality (AQ) standards, and reductions in greenhouse gases (GHG) established under AB 32 (California’s Citation2017; Climate Change Scoping Plan 2017; California Air Resources Board Citation2018a). As an integral part of the on-road goods movement sector, medium- (MDV) and heavy-duty vehicles (HDV) provide important services to California’s economy, but also represent a leading source of air pollution with subsequent deleterious human health effects (Brown Citation2016; Mobile Source Strategy Citation2016). For example, MDV and HDV are responsible for approximately 20% of NOx emissions in the state (CARB Citation2017a). This results from the current reliance on vehicles powered by the combustion of petroleum fuels, including diesel and gasoline (California Energy Commission and CEC Citation2016). The combustion of diesel fuel is particularly concerning from a human health standpoint as it results in the generation of damaging pollutants including oxides of nitrogen (NOx), particulate matter (PM), and toxic air contaminants (Kennedy Citation2007; Ris Citation2007). Therefore, transitions from petroleum-fueled vehicles to cleaner, lower emitting technologies and fuels will be necessary within the MDV and HDV sectors in California.
MDV and HDV are highly diverse. Thus, and a range of alternative vehicles are being considered, including the use of electricity within battery electric trucks and hydrogen within fuel cell powered vehicles, both of which achieve zero tail pipe emissions (here within referred to as zero emission vehicles (ZEV)). However, the technical feasibility and currently high costs associated with these options raise questions regarding the near-term suitability of hydrogen and electricity to achieve significant reductions in emissions from the trucking sector (Couch et al. Citation2019). Additionally, an alternative technology being considered for both applications is the low-NOx compressed natural gas (CNG) engine, which achieves significant reductions in NOx and moderate reductions in other pollutants including PM (Quiros et al. Citation2016). Low-NOx CNG stoichiometric spark ignition engines significantly reduce NOx emissions by utilizing a systems approach combining advanced three-way catalysts with engine management strategies (California Air Resources Board Citation2015). These engines have been demonstrated to operate with NOx emissions below the CARB optional low NOx standard (0.02 g/bhp-hr) and averaged between 0.0012 and 0.02 g/bhp-hr, well below baseline diesel engines (Johnson Citation2018). Various engine manufacturers, including Cummins Westport and Roush Clean, have developed CNG engines ranging from 6.7 to 12 liter (L) that are commercially available and have been certified to one of the optional reduced NOx standards for on-road heavy-duty engines adopted by the California Air Resources Board (CARB) (California Air Resources Board Citation2017a). Therefore, low-NOx CNG engines represent a technology that can be deployed near-term to mitigate the pollutant emissions and AQ impacts of MDV and HDV.
However, understanding how changes in precursor emissions including NOx and reactive organic gases (ROG) impact ambient pollutant concentrations is complex and requires modeling of the atmosphere, rather than a simple understanding of total emission reductions. Deployment of low-NOx CNG engines to displace current MDV and HDV will impact pollutant emissions quantitatively, spatially, temporally, and in chemical composition; all of which subsequently influence ambient concentrations of primary and secondary air pollutant species. Further, the development and outcome of secondary air pollutants are controlled by multifaceted, non-linear atmospheric processes (Finlayson-Pitts Citation1997). For example, lower levels of ozone and PM2.5 (from reductions in NOx) would be expected from low-NOx CNG replacement of diesel vehicles. However, without atmospheric modeling the quantification, spatial patterns, and temporal periods of such reductions cannot be determined. Therefore, detailed atmospheric models accounting for both chemistry and transport must be used to resolve spatial and temporal distribution of pollutant concentrations to assess comprehensively how alternative fueled vehicles may impact AQ in California. Finally, the impacts on AQ are translated into human health impacts, and then those impacts are monetized to provide a quantification of the health economic benefits. The results can assist policymakers in better understanding the implications of AQ improvements in the design of regulations that maximize human health benefits.
A significant body of research exists with regard to the emissions impact of CNG MDV and HDV. The overall AQ impacts of MDV and HDV have been quantified and compared to other on-road sectors (Mac Kinnon et al. Citation2019), including the potential use of ZEV (Mac Kinnon et al. Citation2016). The AQ and human health benefits of deploying alternative vehicle technologies and other emission reduction strategies in a portfolio approach have been estimated for the U.S. (Pan et al. Citation2019). The performance and criteria pollutant emissions of in-use CNG engines relative to conventional petroleum fueled engines have been reported in a large number of studies (Quiros et al. Citation2016; Hesterberg, Lapin, and Bunn Citation2008; Thiruvengadam et al. Citation2015; Korakianitis et al. Citation2011; Lanni et al. Citation2003; McCormick et al. Citation1999; McTaggart-Cowan et al. Citation2006). Specifically, the reduction of air emissions of compounds representing human health concerns has been noted (Kado et al. Citation2005) (Agarwal et al. Citation2018). The health benefits of AQ improvements from transitions to CNG in transportation for a large urban area have been modeled, however the study only considered CNG-fueled buses and reported impacts solely for PM2.5 (Mena-Carrasco et al. Citation2012). Observation data has also been used to quantify the AQ benefits of CNG replacement of diesel buses in a mega city (Delhi) (Goyal Citation2003). Similarly, studies have assessed both the direct and lifecycle emissions of greenhouse gases (GHG) for CNG pathways relative to diesel and gasoline (López et al. Citation2009; Camuzeaux et al. Citation2015; Tong, Jaramillo, and Azevedo Citation2015; Dominguez-Faus Citation2016). However, no study has reported AQ impacts via comprehensive assessment of primary and secondary air pollutants and associated health impacts for a range of scenarios representing large-scale build-out of CNG engines in all vocations of the MDV and HDV sectors at the state level. Furthermore, all of these studies consider conventional CNG engines that do not represent the improved emission performance of the low-NOx engines.
Therefore, the regional AQ and human health implications from the large‐scale deployment of low-NOx CNG engines are currently unclear and, for the first time, we quantify and compare the impacts from using low-NOx CNG engines to power future MDV and HDV fleets in California. We consider the impacts of low-NOx CNG trucks within the initial framework of both a conservative and an optimistic outcome for alternative vehicles as it provides insight into potential benefits across a span of potential evolutionary pathways for the California MDV and HDV fleets. We assess the emission reductions attainable through replacement of conventionally fueled vehicles in 2035, and how emission impacts translate to changes in atmospheric primary and secondary pollutant concentrations via a photochemical AQ model. We then quantify the impacts of AQ changes on human health through the use of a health impact assessment tool to determine the potential monetary value of avoided pollution-induced health incidences. We focus on California as it consistently experiences degraded AQ in regions supporting large population centers yielding serious risks to human health (CARB Citation2017b) and is aggressively pursuing the deployment of alternative technologies in pursuit of emission reductions from MDV and HDV (Mobile Source Strategy Citation2016; Brown Citation2016). Additionally, while reduced from current combustion-based vehicles, tail pipe emissions from low-NOx CNG are higher than from ZEV (which are also under consideration for MDV and HDV vocations) and we include a ZEV scenario to provide comparison of this tradeoff. Therefore, results from this work provide insight into the potential tradeoffs associated with the immediate commercial readiness of the low-NOx CNG relative to the complete reduction in tailpipe emissions from ZEV.
Methodology
Scenario development
We develop scenarios of low-NOx CNG engines in the MDV and HDV within California for the year 2035. The year 2035 is selected because 1) it provides a reasonable horizon for alternative vehicle deployment to reach impactful levels due to fleet-turnover and 2) projected emissions for other sources were available to that year. The scenarios are designed to span the range of potential fleet penetrations with an optimistic stance on the displacement of baseline diesel and gasoline engines. Furthermore, scenarios are constructed to capture other issues associated with alternative fueled vehicles, including the ability of California to regulate emissions from vehicles registered out-of-state.
Cummins Westport’s 8.9 L SI CNG engine has been certified by the U.S. Environmental Protection Agency (EPA) and the ARB to a 0.027 g per brake horsepower-hour (g/bhp-hr) optional NOX standard, and both Cummins Westport and Roush Cleantech have 6 L engines certified to the 0.1 g/bhp-hr standard (California Air Resources Board Citation2018b). Cummins Westport also has an 11.9 L engine certified to the 0.02 g/bhp-hr standard for Class 8 truck and bus applications (33,000-plus pounds gross vehicle weight) (Zwissler and Ptucha Citation2018). The 6.7 L, 6.8 L, and 8.9 L engines are applicable for MDV including trucks, urban transit, and school buses, and refuse hauler applications. The Cummins Westport 11.9 L engine is applicable to on-road HDV applications including long and regional haul trucks and tractors, vocational and transit, school bus, and refuse applications. The vehicles are expected to have sufficient range to offer route flexibility without requiring in-route refueling, e.g., on-highway natural gas trucks can have over 700 mile range (Next Generation Heavy-Duty Natural Gas Engines Fueled By Renewable Natural Gas). Therefore, we assume that low-NOx CNG engines will be available and suitable for all MDV and HDV vocations in 2035.
In 2013, the ARB established optional low NOx standards for heavy-duty engines. As of February 2020, no diesel engines are certified, and only natural gas and LPG engines have been certified (U.S. Environmental Protection Agency Citation2020). For example, the 11.9 L engine was certified on a chassis dynamometer across a range of duty cycle representative of typical urban operation including drayage port cycles, the urban dynamometer driving schedule, and three cycles designed by CARB (Johnson Citation2018). While a full review of the emission factors of the various CNG engines is outside the scope of this work, additional information can be found in References (Johnson Citation2018; California Air Resources Board Citation2018b; Next Generation Heavy-Duty Natural Gas Engines Fueled By Renewable Natural Gas Citation0000; US Environmental Protection Agency Citation2020).
Vision model
The Heavy Duty Vehicle Module within the Vision Scenario Planning Model version 2.1 is used to develop scenario representative of the integration of low-NOx CNG engines into the MDV and HDV population for the year 2035. Vision was developed by CARB and allows users to conduct multi-pollutant assessments for the transportation sector system-wide in California accounting for vehicle sales, activity, technologies, fuels, and efficiencies to estimate energy demands (California Air Resources Board Citation2017b). The Vision HDV module generates two sets of baseline emission databases by design. The first considers that the only emission control regulations are those the current regulations set in place, i.e., the Base Case. In comparison, the State Implementation Plan (SIP) Case includes the controls and regulations described in California’s SIP document which affects the HDV population and results in MDV and HDV fleets composed of lower emitting technologies than the Base Case overall (the measures assumed for each case are provided in the SI). It is important to note that the Vision projections are from 2017, and thus do not account for several recent regulatory statutes with implications for future MDV and HDV fleets including the CARB Advanced Clean Trucks Regulation and the Heavy-Duty Engine and Vehicle Omnibus Regulation. Therefore, the baseline fleet mixes estimated using Vision are likely to be higher emitting than current regulations dictate.
Using the two baseline datasets (Base and SIP) as starting points, additional scenarios are developed to assess the increased implementation of low-NOx CNG engines across MDV and HDV categories by displacement of gasoline or diesel engines. While a small penetration of additional alternative technologies is assumed for some of the cases, including hydrogen fuel cell and battery electric vehicles, in this work low-NOx CNG vehicles are the predominant technology to replace diesel and gasoline vehicles. The scenarios shown in assume mid- (50%) and high (100%) optimism regarding CNG fleet penetration levels with equivalent deployment across all vocations for the 50% cases. The 100% adoption of low-NOx CNG (Case 1B) is relevant to both the Base and SIP Cases and is compared to both to determine the upper bounds for vehicle utilization. While the majority of cases are designed to span vehicle deployment outcomes, two cases from the SIP Case are designed to assess the impact of additional considerations. First, Case 2C assumes complete deployment only for HDV vocations expected to be the most feasible for low-NOx CNG technologies (shown in Table SI 1) to consider impacts if low-NOx CNG engines do not become commercially developed for all vocations, resulting in an HDV penetration of 41%. Second, Case 2D assumes deployment only for HDV registered in the state to consider the impact of challenges associated with the regulation of out-of-state and international vehicles, resulting in an HDV CNG fraction of 60%. In addition, a case is considered assuming complete deployment of ZEV (100 ZEV) within MDV and HDV for comparison with the potential impacts of using ZEV, such as battery electric and hydrogen fuel cell vehicles.
Table 1. Name and description of each scenario considered for this study including the total fleet penetration of low-NOx CNG engines
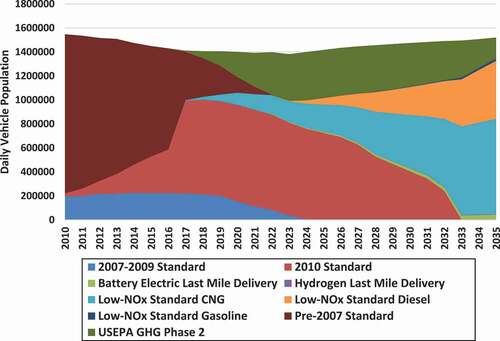
Depending on the scenario, we project vehicle population and daily vehicle miles traveled (VMT) of HDV and MDV by technology type to 2035 using Vision. Shown in , in Case 1B all MDV and HDV transition to low-NOx CNG from diesel and gasoline technologies, representing the upper bound for possible impacts. Conversely, shows the evolution of the MDV and HDV fleets to 2035 for Case 2D, which assumes all in-state HDV transition to low-NOx CNG. Case 2D is constructed based on the SIP Case, which assumes a cleaner mix of baseline technologies than the Base Case including CNG, low-NOx standard diesel, and gasoline. Additionally, battery electric and hydrogen fuel cell vehicles in last mile delivery applications are included although at a low total percentage. Case 2D provides a more conservative and realistic estimate for low-NOx CNG impacts as the SIP Case is designed to provide emission reductions needed to meet AQ mandates, and in-state vehicles may be more straightforward to encourage shifts to low-NOx CNG (relative to out-of-state and international vehicles).
Figure 1. Daily vehicle population of MDV and HDV to 2035 in Case 1B
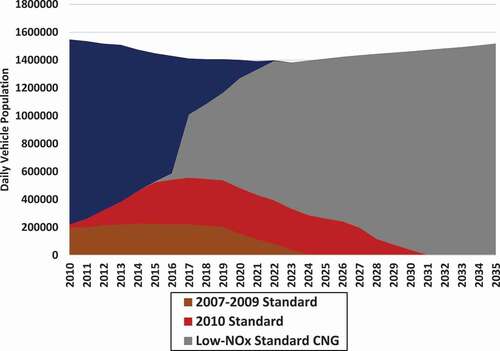
Figure 2. Daily vehicle population of MDV and HDV to 2035 in Case 2D
Emission projection and resolution
Baseline AQ is established by projecting emissions from the 2012 California Air Resources Board inventory (CARB Citation2013) for all sources excluding MDV and HDV (e.g., industry, off-road transportation, power generation, etc.) from the California Air Resources Board’s CEPAM: 2016 SIP – Standard Emission Tool (CARB Citation2017a). For MDV and HDV, total emissions of criteria pollutants required for AQ modeling, including NOx, PM in 10 ug (PM10) and PM2.5, reactive organic gases (ROG), and CO are obtained from Vision. For NOx, an NO2/NO ratio of 0.174 is assumed. It should be noted that upstream pollutant emissions for vehicle fueling pathways are not considered in this work and only direct vehicle tailpipe and evaporative emissions are modified. Emission representative of each case is applied and resolved in space and time using the Sparse Matrix Operator Kernel Emissions (SMOKE) modeling system (US EPA Citation2017). SMOKE accounts for geospatial (e.g., truck activity, routes, etc.) and temporal (e.g., drive patterns, times, etc.) information associated with MDV and HDV activity in California.
The vehicles are assumed to be equally distributed within the current spatial and temporal patterns of MDV and HDV throughout California. Reductions are associated with current transportation networks within California including the locations of vehicle activity, with locations of peak reductions in urban areas supporting high levels of MDV and HDV activity including the SoCAB, Central Valley, and the San Francisco (S.F.) Bay Area. These areas have particular importance in regard to AQ improvements due to preexisting degraded AQ and the existence of large populations with implication for health impacts (Zhu et al. Citation2019).
Air quality modeling
We conduct simulations of atmospheric chemistry and transport via the Community Multi-scale Air Quality model (CMAQ, v5.2) to establish fully developed distributions of atmospheric concentrations of pollutants of interest, including ground-level ozone and PM2.5 (US EPA Office of Research and Development Citation2017). CMAQ is a widely known model used for various AQ assessment needs, including regulatory compliance and atmospheric research associated with tropospheric ozone, PM, acid deposition, and visibility (Foley et al. Citation2015; Foley et al. Citation2010). For gas-phase chemistry, we use the SAPRC-07 chemical mechanism (Carter Citation2010) and the AERO6 module to provide aerosol dynamics (Pye et al. Citation2013). The model domain is the same as Mac Kinnon et al. (Citation2019), covering the entire state of California with 4 km × 4 km horizontal resolution. Boundary conditions are generated via the Model for Ozone and Related Chemical Tracers (Mozart v4.0) (Emmons et al. Citation2010). We generate meteorological input data for the modeling period through the Advanced Research Weather Research and Forecasting Model (WRF-ARW, 3.7), with the MODIS land use database (Friedl et al. Citation2010). Baseline meteorological conditions are obtained from the (Final) Operational Global Analysis data (National Centers for Environmental Prediction/National Weather Service/NOAA/U.S. Department of Commerce, National Center for Atmospheric Research, Computational and Information Systems Laboratory Citation2000). The boundary conditions and meteorology are held constant from 2012 to 2035; thus, impacts of transported pollution and climate change are not considered. We verify model performance by comparison with observational data from the U.S. EPA Air Quality System for hourly ozone and PM2.5, with acceptable performance demonstrated through the criteria recommended in Reference (Emery et al. Citation2017). More details regarding the model performance can be found in the SI, and a complete report of statistical parameters is presented by Zhu et al. (Citation2019).
The two pollutants considered to assess AQ for this work are PM2.5 and ground-level ozone. Ozone is an important component of photochemical smog, and is not directly emitted but forms in the atmosphere during reactions between NOx and ROG in the presence of sunlight (Finlayson-Pitts and Pitts Citation2000). PM2.5 is both directly emitted and forms in the atmosphere during reactions of gaseous precursor emissions contributing to total atmospheric levels (Zhu et al. Citation2018)–(Kleeman Citation2008; Hallquist et al. Citation2009). Both represent current and historical air pollution concerns (many regions of California experience ambient levels in excess of state and federal health-based standards (CARB Citation2017b)) and are associated with human health detriments supported by a broad body of scientific literature (Dockery et al. Citation1993; Pope III and Dockery Citation2006; Jerrett et al. Citation2009). Therefore, ground-level concentrations of ozone and PM2.5 serve as appropriate metrics in the evaluation of impacts associated with technological shifts targeting AQ improvements.
Modeling episodes seasonally is necessary to determine comprehensively impacts on ambient AQ. For example, ozone levels peak in the summer months as high ambient temperatures, enhanced solar radiation, and increased evaporative ROG emissions are favorable for the atmospheric chemical reactions driving ozone formation (Pusede et al. Citation2014). Here, two simulation periods are conducted to capture the effect of seasonal variation in meteorology and emissions on ozone and PM2.5 concentrations including a summer episode (July 8–21) and winter episode (January 1–14). July is selected as this period encompasses conditions typically associated with high tropospheric ozone formation, including high temperatures, an abundance of sunlight, lack of natural scavengers, and the presence of inversion layers (Carreras-Sospedra et al. Citation2006). The (July 8–21) period represents the highest ozone episode simulated within the Base Case. The January period also is associated with high levels of PM2.5 in some regions of California, including the South Coast Air Basin (SoCAB) of California and many regions of the Central Valley. The (January 1–14) period represents the highest PM2.5 episode simulated within the Base Case. The first 3 days of each period are considered model spin up and excluded from the analysis of the results.
For consistency with ambient AQ standards, ground-level concentrations are reported as maximum daily 8-hr average ozone (MD8H) and 24-hr average PM2.5 calculated by two different methods. First, to capture the peak AQ impacts, we calculate the largest MD8H ozone and 24-hr PM2.5 average that occurs for each model grid cell for any averaging period within the 11-day period. This provides an understanding of the maximum possible impact that may be experienced. Second, to provide a marker of the general impact experienced throughout the entire 11-day episode, we calculate the average MD8H ozone and 24-hr PM2.5 experienced for each modeling grid cell. Following the methods of Zhu et al. (Citation2019), we report ozone for the summer episode as California is well known to experience episodes of high ozone pollution during this period. In contrast, ozone concentrations in winter are generally below Federal National Ambient AQ standards (NAAQS) in California. For example, predicted levels for both the Base and SIP cases remain under the NAAQs and California standards for MD8H ozone of 70 parts per billion (ppb). Therefore, ozone is not reported here for the winter episode. We compute changes in concentration for PM2.5 for both the summer and winter episodes as PM2.5 pollution is a concern for human health during both seasons. Finally, concentrations are compared between the Base and the low-NOx CNG Cases to derive the impacts.
Health impact assessment
Improvements in AQ benefit public health by reducing pollution-related incidence of mortality and morbidity, e.g., premature death, non-fatal heart attacks and strokes, and other adverse health effects. To quantify these health savings, we use the environmental Benefits Mapping and Analysis Program – Community Edition (BenMAP-CE) from the U.S. EPA (Sacks et al. Citation2018). For this work, BenMAP-CE is used to quantify benefits from improvements in ozone and PM2.5 attained through low-NOx CNG MDV and HDV deployment. The methods used follow those in the South Coast Air Quality Management District’s (SCAQMD) Socioeconomic Report for the 2016 Air Quality Management Plan (AQMP) (Shen, Oliver, and Dabirian Citation2017). Population projections are based on Landscan data (ORNL Citation2016) and grown to 2035 using projections from the California Department of Finance which captures spatial expansion at the county level (California DOF Citation2017). Baseline incidence rates for mortality and morbidity are estimated from public administrative records where feasible, and projected from U.S. Census Bureau data (Industrial Economics Citation2016). Concentration-response and economic valuation functions are selected based on suggested criteria from a systematic review of the epidemiological literature (Industrial Economics and Lisa Robinson Citation2016; Industrial Economics and Lisa Robinson Citation2016). Though BenMAP-CE can be used to estimate long-term health impacts, such as those occurring from annual average PM2.5 changes, impacts are reported here for short-term exposure to ozone and PM2.5 (as appropriate for the modeled episode) due to intensive resource requirements necessary for simulating cases annually. It should be noted that the use of long-term health impact functions, e.g., those for annual PM, would result in notably higher valuations for avoided adverse health incidence.
Results and discussion
Criteria pollutant emission results
Direct emissions from low-NOx CNG relative to diesel and gasoline equivalent vehicles calculated from the Vision Base Case are shown in . The use of CNG reduces NOx by 96% from baseline diesel, 93% from diesel engines assumed to meet the EPA GHG 2 standards, and 20% relative to an advanced low-NOx diesel engine. Low-NOx CNG engines reduce emissions of ROG from baseline and advanced diesel engines by 17% to 52%. PM2.5 emissions are more similar between technologies because (1) the assumption that future diesel vehicles require particulate filters reduce direct PM2.5 from those sources and (2) PM2.5 generated through brake and tire wear is assumed to be constant regardless of engine technology and fuel, i.e., CNG and ZEV generate equivalent emissions to baseline vehicles. Emissions of CO are higher for low-NOX CNG compared to baseline and advanced diesel engines, but significantly lower than gasoline vehicles. These emissions compare reasonably well with other values reported in the literature (Quiros et al. Citation2016).
Table 2. Direct emissions for advanced CNG, diesel, and gasoline vehicles estimated from the SIP in 2035 in grams per mile (g/mile)
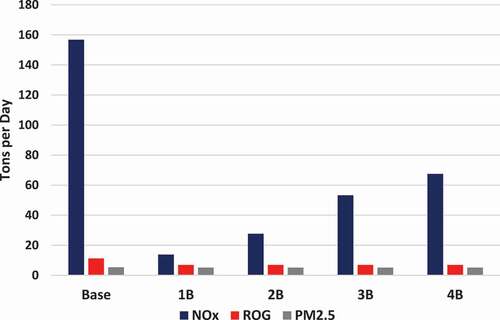
shows total HDV and MDV emissions for the Base Case and associated alternative cases including tailpipe for NOx, tailpipe and evaporative for ROG, and tailpipe, tire wear, and brake wear for PM2.5. The 100% low-NOx CNG Case 1B achieves the lowest total emissions of NOx, representing a 91% reduction from the Base Case, while Case 4B (50% low-NOx in both HDV and MDV) achieves the minimum reduction of 57%. Demonstrating the larger share of emissions attributable to HDV relative to MDV, Case 2B (100% HDV and 50% MDV) achieves a higher reduction than does Case 3B (50% HDV and 100% MDV). Emissions of ROG are reduced from the Base Case for all Cases, exceeding 38% and 97% reductions, respectively. Contrastingly, emissions of PM2.5 are similar both between cases and the Base Case, and between the cases themselves.
Figure 3. Total HDV and MDV emissions of NOx, ROG, and PM2.5 for the base case and alternative scenarios
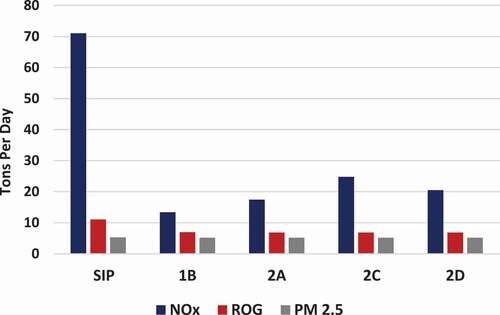
shows total HDV and MDV emissions for the SIP Case and the alternative cases developed from the SIP Case. In the SIP Case, emissions of NOx are significantly reduced (i.e., 76%) from the Base Case as a result of assumed increases in near- and zero emission technologies. Case 1B reduces NOx from the SIP case by an additional 81%, demonstrating the ability of low-NOx CNG vehicles to further reduce NOx emissions even within a more advanced vehicle technology portfolio. Case 2A results in the next highest reduction of 75%, followed by Case 2D (71%) and Case 2 C (65%). As with the Base Case, reductions in ROG from the SIP Case are significant, but differences across cases are minor, and PM2.5 is only modestly impacted.
Figure 4. Total HDV and MDV emissions of NOx, ROG, and PM2.5 for the SIP case and alternative scenarios
Air quality results
Baseline air quality in the Base and SIP Cases
The absolute concentrations predicted for both the Base Case and the SIP Case serve as the baseline for comparison with the alternative cases and are shown in the SI. In the Base Case, high MD8H ozone concentrations are observed in the SoCAB, Central Valley, San Francisco Bay Area (SFBA), and greater Sacramento, with a peak concentration of 133 ppb occurring in the eastern portions of the major urban areas encompassing SoCAB. During the summer period, high 24-hr average PM2.5 concentrations are most prominent throughout the Central Valley potentially exceeding 100 ug/m3, with regions of elevated PM2.5 also occurring north of Sacramento, and SoCAB. For the winter period, peak PM2.5 reaching 62.7 ug/m3 in the northern portion of the Central Valley, with high concentrations predicted for greater Sacramento, SFBA, SoCAB, and San Diego. In the SIP Case, ozone and PM2.5 concentrations are reduced from the Base Case due to the assumed cleaner technology portfolio within MDV and HDV. MD8H ozone concentrations reach 123 ppb and are comparable spatially to those for the Base Case. Similarly, for the summer episode 24-hr PM2.5 concentrations exceed 98 ug/m3 and 58 ug/m3 in the winter episode.
Air quality impacts for the cases developed from the Base Case
Figure SI 5 displays the differences in peak MD8H ozone between the Base Case and the related alternative cases. Quantitatively, peak impacts correspond to NOx emission trends with reductions for the most aggressive adoption within Case 1B exceeding −13.0 ppb, while reductions from the least aggressive adoption with Case 4B reaching −5.8 ppb (). These improvements are significant, and represent the maximum possible improvement occurring during an episode of high pollution as the meteorological conditions were selected to represent. When MD8H ozone changes are averaged across the 11-day period, reductions ranging from −5.8 to −3.6 ppb are predicted with similar trends across the cases. The most pronounced impacts occur in the eastern portions of SoCAB notable as experiencing the highest ambient ozone levels in the U.S. and supporting large population centers. Important reductions are also predicted throughout the Central Valley, SFBA, greater Sacramento, and San Diego.
Table 3. Δ peak and average ozone and PM2.5 predicted from the base case
Peak differences of PM2.5 during the summer range from −1.65 ug/m3 to −2.71 ug/m3 for the cases considered, following ozone trends (). Figure SI 6 shows that reducing emissions from MDV and HDV reduces PM2.5 with areas of peak impact corresponding to locations downwind of vehicle activity along the major transportation corridors in the Central Valley. Similarly, areas downwind of urban areas supporting large numbers of vehicles within the SoCAB and greater Sacramento experience benefits. Spatially, winter PM2.5 impacts follow similar trends to those for summer with maximum impacts widespread throughout the Central Valley (Figure SI 7). However, the magnitude of the reductions is significantly increased from summer, with peak differences between −5.0 ug/m3 and −7.81 ug/m3 (). These values are significant given the current National Ambient Air Quality Standards for MD8H ozone and 24-hr PM2.5 are 70 ppb and 35 ug/m3, respectively. Impacts on PM2.5 between the cases are largely characterized by differences in NOx emission reductions, which is indicative of the role of reductions in secondary PM2.5 in ground-level concentrations as differences in direct emissions of PM2.5 and ROG between the Cases are minor compared to those for NOx. Additionally, the importance of NOx as a driver of secondary PM2.5 concentrations has been demonstrated in California (Zhu et al. Citation2019).
Air quality impacts for the cases developed from the SIP Case
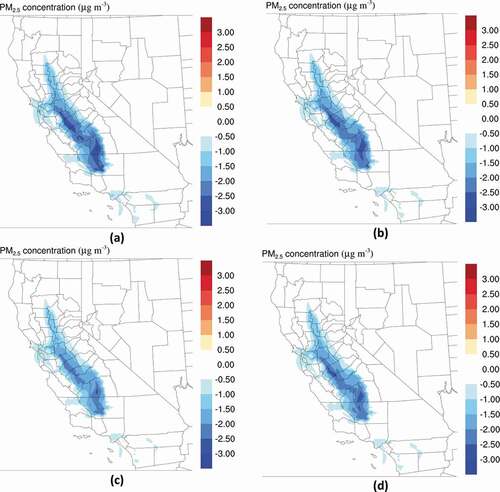
The following section discusses the concentration differences predicted between the SIP Case, serving as a baseline, and the alternative cases constructed around the SIP Case. displays differences in MD8H ozone and winter PM2.5 for the CNG cases relative to the SIP case, while the results for summer PM2.5 are provided in the SI. Generally, the impacts are equivalent spatially to those discussed for the Base Case but are reduced in magnitude as the SIP Case yields lower baseline ozone and PM2.5 due to reduced emissions from a cleaner MDV and HDV truck fleet (). Still, the improvements are important both quantitatively and within the context of human health impacts as the peak impacts often coincide with highly populated regions currently experiencing poor AQ. Within this set of cases, the largest reduction occurs from Case 1B (100% low-NOx CNG) and Case 2 C (41% HDV and 50% MDV low-NOx CNG). Reductions in peak ozone range from −6.1 ppb in Case 1B to −5.4 in Case 2 C, and reductions in average ozone range from −1.2 to −1.4 ppb. Reductions in peak summer PM2.5 range from −1.0 to −1.2 ug/m3 and peak improvements in winter PM2.5 range from −2.6 to −3.1 ug/m3. The assumption of 100% of in-state vehicles in Case 2D results in approximately 60% of HDV and 50% of MDV transitioning to low-NOx CNG engines and achieves notable AQ benefits despite the lack of replacement of out-of-state trucks.
Table 4. Δ Peak and average ozone and PM2.5 concentrations predicted from the SIP case
Figure 5. Peak differences in summer episode MD8H ozone between the SIP case and (a) Case 1B, (b) Case 2A, (c) Case 2C, and (d) Case 2D in ppb
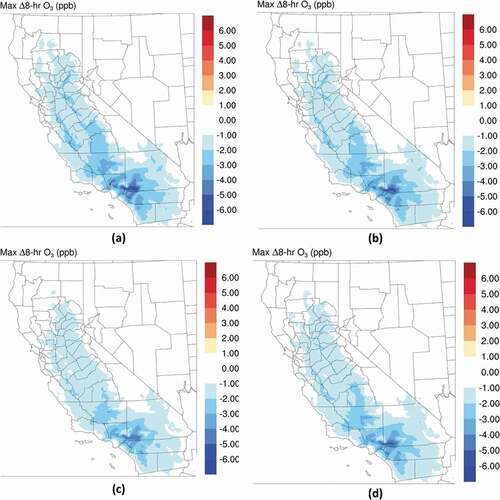
Figure 6. Peak differences in winter episode 24-hr PM2.5 between the SIP Case and (a) Case 1B, (b) Case 2A, (c) Case 2C, and (d) Case 2D in ug/m3
While the maximum reductions do not appear to differ meaningfully between the cases, it should be considered that the spatial dimension of impact is not captured when using this metric, i.e., it represents the largest change experienced by one grid cell throughout the modeling domain. Demonstrating this, the difference in ozone and PM2.5 between Case 1B and 2 C is shown in Figure SI 11, which are widespread and in important regions from an AQ standpoint. This further validates the need for the health impact assessment, which accounts for the spatial dimension of pollutant impacts by translating concentration changes into population exposure estimates.
Health impact assessment results
The following section presents the results from the health impact assessment quantifying and valuing differences in morbidity and mortality across the California population resulting from improvements in AQ. Results are presented for the SIP and the SIP-related Cases as they represent a more likely outcome for the California MDV and HVD sectors. However, we also include the valuation for Case 1B relative to the Base Case as this establishes the upper bound for potential health benefits. The mean values estimated for summer are shown in and for winter in . For the SIP related cases, health savings in summer are estimated to range from $47 million to $56 million as a result of ozone and PM2.5 improvements. In winter, health savings for the SIP cases fall between $36 and $43 million and result solely from PM2.5 reductions. In California, ozone concentrations in winter are often inversely related to emission reductions as a result of titration mechanisms in the atmosphere, and as a result increases are predicted in Southern California which yield a negative value for ozone health savings (shown in Figure SI 12) (Zhu et al. Citation2019; Jhun et al. Citation2015). However, the larger magnitude of health savings from PM2.5 ensures an overall benefit is still achieved. Representing the upper bound, health benefits for Case 1B relative to the Base Case could range up to $120 million in summer and $81 million in winter as a result of the greater reductions in pollutant concentrations, as baseline levels are higher in the Base Case compared to the SIP Case. Given the dramatic variation of ozone health impacts between the seasons (i.e., including a sign change), it should be considered that the individual pollutant impacts are more dissimilar than the total health savings may indicate.
Figure 7. Economic valuation of avoided incidence of mortality and morbidity for the air quality improvements predicted in the summer episode. Values are mean estimates from BenMAP-CE
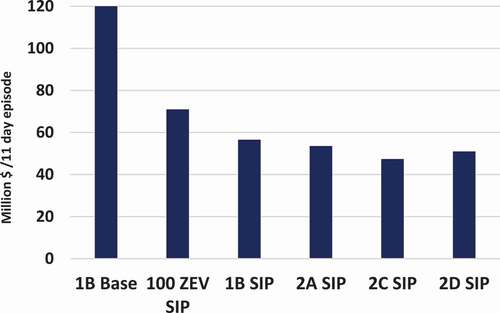
Figure 8. Economic valuation of avoided incidence of mortality and morbidity for the air quality improvements predicted in the winter episode. Values are mean estimates from BenMAP-CE
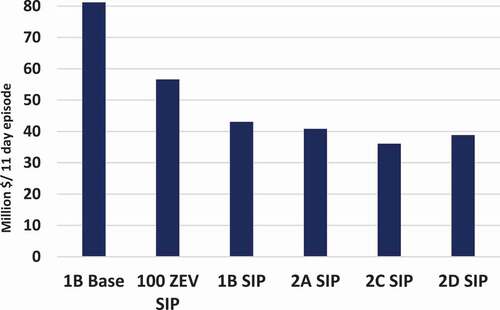
The additional health benefits from ZEV can be estimated via comparison with the results for CNG Case 1B relative to the SIP Case, as both assume complete deployment of the relative vehicle type. In the summer, the 100 ZEV achieves an additional $14.4 million, and in the winter an additional $13.5 million. The use of ZEV attains higher health benefits relative to a comparable low-NOx case due to reductions of all pollutants including PM, ROG, SOx, and CO, and to a lesser degree the complete elimination of NOx. The additional emission reductions are particularly important for PM2.5 concentrations throughout the state.
Furthermore, it should be considered that chronic exposure to NO2 (a principal component of NOx) is associated with deleterious health outcomes including the development of asthma and increased susceptibility to respiratory infections (Chen et al. Citation2007). While those health benefits are not quantified here, they should be considered as an additional benefit of alternative fuel HDV and MDV that reduce NOx.
Discussion
The use of low-NOx CNG engines notably improves AQ from a baseline of vehicles largely comprised of diesel- and gasoline-powered vehicles. These results provide an upper bound for potential AQ benefits as it is expected that future HDV and MDV fleets in California will be comprised of cleaner technologies than those considered in the baseline here, including low-NOx CNG, battery electric, and hydrogen fuel cell vehicles (Brown Citation2016). This outcome is more reasonably represented by comparison with the SIP Case, which provides insight into how increasing penetrations of low-NOx CNG vehicles can impact AQ within the context of a cleaner portfolio of HDV and MDV technologies. However, as noted earlier, the fleet mix in the SIP Case is potentially higher emitting than current regulations would suggest, and the results should be considered as optimistic. The quantified health savings represent important benefits for California and demonstrate the suitability of low-NOx CNG vehicles within advanced MDV and HDV portfolios seeking AQ improvements. The results from this study further support those from others that have shown public health benefits co-benefits from the use of CNG as a climate mitigation strategy in the HDV sector (Aas et al. Citation2019; Zhao et al. Citation2019). We estimate the benefits for replacing only in-state vehicles as potentially exceeding $50 million for an episode in summer and $38 million for an episode in winter, demonstrating that shifts to low-NOx CNG engines are beneficial to AQ even if the challenge of instigating shifts for vehicles outside of California limits deployment.
● Reductions in NOx provide the largest benefits in ozone and PM2.5
While it is expected that NOx reductions drive overall impacts on ozone, predicted reductions in PM2.5 are also primarily influenced by secondary mechanisms associated with emissions of NOx. This occurs in part as changes in directly emitted PM2.5 and ROG are minor compared to the substantial differences in emitted NOx. Results here demonstrate important seasonal differences in secondary PM2.5, with impacts in winter particularly important in the Central Valley with improvements predicted for that period exceeding −1.50 ug/m3 to −3.41 ug/m3 depending on the composition of the HDV and MDV fleet. This is a desirable outcome as the Central Valley suffers from winter-time PM2.5 levels above health-based standards and the results support similar findings for the region in related studies (Zapata et al. Citation2018). Impacts on PM2.5 for summer conditions are more moderate, and with different spatial occurrence of peak impacts predicted during the winter period, with peak concentration reductions predicted for the SoCAB, and other areas of note including different areas of the Central Valley.
● Air quality benefits often occur in important locations, including disadvantaged communities
Impacts are most notable in regions that currently experience unhealthy levels of air pollution, including the SoCAB, Central Valley, S.F. Bay Area, and Greater Sacramento area. These areas are often encompass disadvantaged communities as designated by California, further emphasizing the importance of AQ benefits (Faust et al. Citation2017). Increasing the deployment of low-NOx CNG vehicles can achieve benefits from a future characterized by moderate advancement in MDV and HDV technologies; and from the supposition of more aggressive deployment of advanced technology portfolios in California to meet regulatory standards. Therefore, the increasing deployment of low-NOx CNG vehicles above levels that are currently expected or targeted can offer important AQ benefits by reducing atmospheric pollutant concentrations in currently affected areas of the state.
● Trade-offs between low-NOx CNG and ZEV should be considered in the design of policy promoting cleaner MDV and HDV fleets
The current commercial readiness of low-NOx CNG engines, in contrast to the prominent zero-emission options of battery electric and hydrogen fuel cell, allows the opportunity for near- and mid-term emission reductions that could be particularly significant in regions of non-compliance (Couch et al. Citation2019). For example, the foremost AQ challenge facing SoCAB is the reduction of NOx sufficient to comply with ozone standard deadlines in 2031 (Shen, Oliver, and Dabirian Citation2017). Within this timeline, low-NOx CNG could be an important solution in the MDV and HDV sectors and offer considerable AQ benefits within disadvantaged communities. However, zero-emission options, including battery electric and hydrogen fuel cell trucks, attain higher health benefits than low-NOx CNG vehicles and represent the ultimate answer for sustainable trucking, and it is unknown if large-scale shifts to CNG could delay or prevent commercialization progress in California for those options, e.g., average vehicle lifetimes could result in CNG engines remaining in fleets for a decade or more. Here, we estimate that the health savings attainable from ZEV could be up to 25% higher in summer and 31% higher in winter than those from low-NOx CNG for equivalent vehicle deployment levels. Tradeoffs should be considered within the context of policy seeking emission reductions and AQ benefits from the on-road sector. These tradeoffs must also be considered from a climate policy perspective, as the selection of vehicle technology and fuel combinations will determine GHG footprints from fleets. A short-term promotion of CNG use could delay or prevent more optimal integrated solutions in the mid-term, for example. In addition, work characterizing the techno-economics of transitions to fuel supply chains for the production, distribution, and dispensing of low carbon NG fuels, including renewable natural gas (RNG), should also be considered within this context as they would be necessary to ensure GHG reductions (Lane Citation2019).
It has also been shown that in-use NOx emissions from current diesel vehicles exceed certification standards as a result of poor aftertreatment system performance during low duty cycle operation (Miller et al. Citation2013). Similar work has verified the NOx reduction of low-NOx CNG engines to be independent of duty cycle (Johnson Citation2018). Therefore, results here could be underestimated as emission reductions are estimated assuming diesel vehicles are maintaining satisfactory compliance with emission regulations. Conversely, it has also been shown that emitted particles, ammonia, and methane were higher than diesel engines on similar drive cycles (Johnson Citation2018). This was not represented in the modeling conducted for this work, and should be considered in future work due to important AQ and GHG implications, particularly given the importance of ammonia emissions to PM2.5 formation and associated health impacts (Watson and Chow Citation2002).
● Chemical differences in PM occurring from fuel composition differences between gasoline and diesel vehicles and CNG vehicles may yield additional public health impacts for CNG vehicles
Direct PM emissions are assumed to be reduced moderately for low-NOx CNG engines relative to advanced diesel and gasoline engines in terms of total mass. However, the chemical composition of emitted PM is also likely to be substantially different due to differences in fuel composition and other combustion parameters (Kakaee, Paykani, and Ghajar Citation2014). The chemical composition of PM is a direct determinant of human health impacts, and thus exposure to PM2.5 generated from low-NOx CNG engines may have dissimilar health impacts compared to exposure to diesel or gasoline generated PM2.5. This is an issue that would benefit from further study including focused toxicological research with similarity to studies done for exposure to first-generation biodiesel fuels (Gookin Citation2011; Valand et al. Citation2018).
It should also be considered that shifts in the NO2/NOx ratio could occur from transitions to CNG vehicles. This phenomenon has been observed in Europe, potentially as a result of emission control technologies and shifts in vehicles and fuels (Carslaw Citation2005). In addition to direct health implications from NO2, changes in the ratio could affect formation mechanisms associated with ozone.
Conclusion
The results demonstrate the substantial public health savings from AQ improvements that deploying alternative vehicle and fuel platforms in the medium- and heavy-duty sectors can attain, particularly within socially vulnerable communities. Improvements to PM2.5 in winter in the Central Valley and ozone in summer in Southern California are pronounced. The extent of these benefits depends on the selection of vehicle and fuel combinations and the timing of fleet penetration. Policy development should weigh the potentially higher near-term benefits from CNG resulting from enhanced commercialization against the higher longer-term benefits from zero-emission options.
AQ_GHG_and_Health_Impacts_of_CNG_HDV_SI_Second_Revision_Final_Clean.docx
Download MS Word (3.5 MB)Acknowledgment
The authors gratefully acknowledge the funding support for this work provided to the University of California Institute of Transportation Studies (UCI-ITS) from the State of California via the Public Transportation Account and the Road Repair and Accountability Act of 2017 (Senate Bill 1). The authors thank the State of California for its support of university-based research. The authors also thank Professor Stephen Ritchie and Dr. Craig Rindt, the Director and Assistant Director of UCI-ITS respectively, for their thoughtful review and insights.
Disclosure statement
No potential conflict of interest was reported by the author(s).
Supplementary material
Supplemental data for this paper can be accessed on the publisher’s website.
Additional information
Notes on contributors
Michael Mac Kinnon
Michael Mac Kinnon is a Senior Research Scientist in the Advanced Power and Energy Program at the University of California, Irvine.
Shupeng Zhu
Shupeng Zhu is a Senior Research Scientist in the Advanced Power and Energy Program at the University of California, Irvine.
Alejandra Cervantes
Alejandra Cervantes is graduate student researcher in the Advanced Power and Energy Program at the University of California, Irvine.
Donald Dabdub
Donald Dabdub is a Professor of Mechanical, Aerospace, and Environmental Engineering, at the University of California, Irvine. He leads the Computational Environmental Sciences Laboratory at UCI.
G.S. Samuelsen
G.S. Samuelsen is a Horiba distinguished Professor emeritus of Mechanical, Aerospace, and Environmental Engineering at the University of California, Irvine. He is the Founding Director of the Advanced Power and Energy Program.
References
- Aas, D., A. Mahone, Z. Subin, M. MacKinnon, B. Lane, and S. Price. 2019. Natural gas distribution in California’s low-carbon future.
- Agarwal, A. K., B. Ateeq, T. Gupta, A. P. Singh, S. K. Pandey, N. Sharma, R. A. Agarwal, N. K. Gupta, H. Sharma, A. Jain, et al. 2018. Toxicity and mutagenicity of exhaust from compressed natural gas: Could this be a clean solution for megacities with mixed-traffic conditions? Environ. Pollut. 239:499–511. doi:https://doi.org/10.1016/j.envpol.2018.04.028.
- Ayala, A., N. Kado, R. Okamoto, B. Holmen, P. Kuzmicky, R. Kobayahsi, and K. Stiglitz. 2002. Diesel and CNG heavy-duty transit bus emissions over multiple driving schedules: Regulated pollutants and project overview. SAE Trans. 111:735–47.
- Brown, E. G., Jr. 2016. California sustainable freight action plan. Accessed August 2, 2017. http://www.casustainablefreight.org/theplan.html
- California Air Resources Board. 2015. Technology assessment: Low emission natural gas and other alternative fuel heavy-duty engines. Accessed March, 15 2016. https://www.arb.ca.gov/msprog/tech/techreport/ng_tech_report.pdf
- California Air Resources Board. 2017a. Optional reduced NOx emission standards for on-road heavy-duty engines. Accessed June 12, 2018. https://www.arb.ca.gov/msprog/onroad/optionnox/optionnox.htm
- California Air Resources Board. 2017b. Vision 2.1 scenario modeling system: General model documentation. Accessed October 11, 2018. https://www.arb.ca.gov/planning/vision/docs/vision2.1_model_documentation_20170202.pdf
- California Air Resources Board. 2018a. California state implementation plans. Accessed October 4, 2018. https://www.arb.ca.gov/planning/sip/sip.htm
- California Air Resources Board. 2018b. Heavy-duty low NOx. Accessed May 12, 2018. https://www.arb.ca.gov/msprog/hdlownox/hdlownox.htm
- California DOF. 2017. Population projections (Baseline 2016). State of California. Sacramento, CA: Department of Finance. Accessed December 1, 2018. http://www.dof.ca.gov/Forecasting/Demographics/projections/
- California Energy Commission and CEC. 2012. California energy Almanac. California Energy Commission, Sacramento. Accessed April 1, 2016. http://energyalmanac.ca.gov/
- California’s 2017 Climate Change Scoping Plan. Sacramento, CA. 2017. [ Online]. Accessed June 5, 2018. https://www.arb.ca.gov/cc/scopingplan/scoping_plan_2017.pdf
- Camuzeaux, J. R., R. A. Alvarez, S. A. Brooks, J. B. Browne, and T. Sterner. 2015. Influence of methane emissions and vehicle efficiency on the climate implications of heavy-duty natural gas trucks. Environ. Sci. Technol. 49 (11):6402–10. doi:https://doi.org/10.1021/acs.est.5b00412.
- CARB. 2013. Current CARB emissions inventory (ver. 2012).
- CARB. 2017a. CEPAM: 2016 SIP - Standard emission tool emission projections by summary category base year: 2012. Sacramento, CA: California Air Resources Board.
- CARB. 2017b. Area designation maps/state and national. Sacramento, CA: California Air Resources Board.
- Carreras-Sospedra, M., D. Dabdub, M. Rodriguez, and J. Brouwer. 2006. Air quality modeling in the south coast air basin of California: What do the numbers really mean? J. Air Waste Manage. Assoc. 56 (8):1184–95. doi:https://doi.org/10.1080/10473289.2006.10464530.
- Carslaw, D. C. 2005. Evidence of an increasing NO2/NOx emissions ratio from road traffic emissions. Atmos. Environ. 39 (26):4793–802. doi:https://doi.org/10.1016/j.atmosenv.2005.06.023.
- Carter, W. P. L. 2010. Development of the SAPRC-07 chemical mechanism. Atmos. Environ. 44 (40):5324–35. doi:https://doi.org/10.1016/j.atmosenv.2010.01.026.
- Chen, T.-M., W. G. Kuschner, J. Gokhale, and S. Shofer. 2007. Outdoor air pollution: Nitrogen dioxide, sulfur dioxide, and carbon monoxide health effects. Am. J. Med. Sci. 333 (4):249–56. doi:https://doi.org/10.1097/MAJ.0b013e31803b900f.
- Couch, P., J. Leonard, E. Johnstone, R. Lueras, E. Huang, and C.-C. Lin. 2019. San Pedro Bay Ports clean air action plan. 2018 feasibility assessment for drayage trucks.
- Dockery, D. W., C. A. Pope, X. Xu, J. D. Spengler, J. H. Ware, M. E. Fay, B. G. Ferris, and F. E. Speizer. 1993. An association between air pollution and mortality in six US cities. N. Engl. J. Med. 329(24):1753–59. doi:https://doi.org/10.1056/NEJM199312093292401.
- Dominguez-Faus, R. 2016. The carbon intensity of NGV C8 trucks. Davis: University of California, Institute of Transportation Studies.
- Emery, C., Z. Liu, A. G. Russell, M. T. Odman, G. Yarwood, and N. Kumar. 2017 April. Recommendations on statistics and benchmarks to assess photochemical model performance. J. Air Waste Manage. Assoc. 67(5):582–98. doi:https://doi.org/10.1080/10962247.2016.1265027.
- Emmons, S. E. F., S. Walters, P. G. Hess, J.-F. Lamarque, G. G. Pfister, D. Fillmore, C. Granier, A. Guenther, D. Kinnison, T. Laepple, et al. 2010. Description and evaluation of the model for ozone and related chemical tracers, version 4 (MOZART-4). Geosci. Model Dev 3 (1):43–67. doi:https://doi.org/10.5194/gmd-3-43-2010.
- Faust, J. L. August, K. Bangia, V. Galaviz, J. Leichty, and S. Prasad. 2017. CalEnviroScreen 3.0: Update to the California communities environmental health screening tool. [ Online]. https://oehha.ca.gov/media/downloads/calenviroscreen/report/ces3report.pdf.
- Finlayson-Pitts, B. J. 1997. Tropospheric air pollution: Ozone, airborne toxics, polycyclic aromatic hydrocarbons, and particles. Science (80-) 276 (5315):1045. doi:https://doi.org/10.1126/science.276.5315.1045.
- Finlayson-Pitts, B. J., and J. N. Pitts. 2000. Chemistry of the upper and lower atmosphere: Theory, experiments, and applications. San Diego, CA: Academic Press.
- Foley, K. M., P. Dolwick, C. Hogrefe, H. Simon, B. Timin, and N. Possiel. 2015. Dynamic evaluation of CMAQ part II: Evaluation of relative response factor metrics for ozone attainment demonstrations. Atmos. Environ. 103:188–95. doi:https://doi.org/10.1016/j.atmosenv.2014.12.039.
- Foley, K. M., S. J. Roselle, K. W. Appel, P. V. Bhave, J. E. Pleim, T. L. Otte, R. Mathur, G. Sarwar, J. O. Young, R. C. Gilliam, et al. 2010. Incremental testing of the Community Multiscale Air Quality (CMAQ) modeling system version 4.7. Geosci. Model Dev. 3(1):205–26. doi:https://doi.org/10.5194/gmd-3-205-2010.
- Friedl, M. A., D. Sulla-Menashe, B. Tan, A. Schneider, N. Ramankutty, A. Sibley, and X. Huang. 2010. MODIS collection 5 global land cover: Algorithm refinements and characterization of new datasets. Remote Sens. Environ. 114(1):168–82. doi:https://doi.org/10.1016/j.rse.2009.08.016.
- Gookin, G. R. 2011. Comparative study of biodiesel versus petroleum-diesel-fueled engine exhaust toxicity in an asthma mouse model. Irvine: University of California.
- Goyal, P. 2003. Present scenario of air quality in Delhi: A case study of CNG implementation. Atmos. Environ. 37 (38):5423–31. doi:https://doi.org/10.1016/j.atmosenv.2003.09.005.
- Hallquist, M., J. C. Wenger, U. Baltensperger, Y. Rudich, D. Simpson, M. Claeys, J. Dommen, N. M. Donahue, C. George, A. H. Goldstein, and J. F. Hamilton. 2009. The formation, properties and impact of secondary organic aerosol: Current and emerging issues. Atmos. Chem. Phys. 9 (14):5155–236. doi:https://doi.org/10.5194/acp-9-5155-2009.
- Hesterberg, T. W., C. A. Lapin, and W. B. Bunn. 2008. A comparison of emissions from vehicles fueled with diesel or compressed natural gas. Environ. Sci. Technol. 42 (17):6437–45. doi:https://doi.org/10.1021/es071718i.
- Industrial Economics. 2016. Review of baseline incidence rate estimates for use in 2016 socioeconomic assessment. Memorandum. Massachusetts, MA: Industrial Economics, Inc. http://www.aqmd.gov/docs/default-source/clean-air-plans/socioeconomic-analysis/iecmemos_november2016/scbaselineincidence_112916.pdf
- Industrial Economics and Lisa Robinson. 2016. Review of mortality risk reduction valuation estimates for 2016 socioeconomic assessment. Memorandum. Massachusetts, MA: Industrial Economics, Inc. http://www.aqmd.gov/docs/default-source/clean-air-plans/socioeconomic-analysis/iecmemos_november2016/evaluationcriteria_113016.pdf
- Jerrett, M., R. T. Burnett, C. A. Pope, K. Ito, G. Thurston, D. Krewski, Y. Shi, E. Calle, and M. Thun. 2009. Long-term ozone exposure and mortality. N. Engl. J. Med. 360(11):1085–95. doi:https://doi.org/10.1056/NEJMoa0803894.
- Jhun, I., B. A. Coull, A. Zanobetti, and P. Koutrakis. 2015. The impact of nitrogen oxides concentration decreases on ozone trends in the USA. Air Qual. Atmos. Heal. 8 (3):283–92. doi:https://doi.org/10.1007/s11869-014-0279-2.
- Johnson, K. 2018. Ultra-low NO x near-zero natural gas vehicle evaluation ISX12N 400 submitted by. [ Online]. Accessed June 15, 2019. https://ucrtoday.ucr.edu/wp-content/uploads/2018/08/CWI-LowNOx-12L-NG_v03.pdf
- Kado, N. Y., R. A. Okamoto, P. A. Kuzmicky, R. Kobayashi, A. Ayala, M. E. Gebel, P. L. Rieger, C. Maddox, and L. Zafonte. 2005. Emissions of toxic pollutants from compressed natural gas and low sulfur diesel-fueled heavy-duty transit buses tested over multiple driving cycles. Environ. Sci. Technol. 39(19):7638–49. doi:https://doi.org/10.1021/es0491127.
- Kakaee, A.-H., A. Paykani, and M. Ghajar. 2014. The influence of fuel composition on the combustion and emission characteristics of natural gas fueled engines. Renew. Sustain. Energy Rev. 38:64–78. doi:https://doi.org/10.1016/j.rser.2014.05.080.
- Kennedy, I. M. 2007. The health effects of combustion-generated aerosols. Proc. Combust. Inst. 31 (2):2757–70. doi:https://doi.org/10.1016/j.proci.2006.08.116.
- Kleeman, M. J. 2008 March. A preliminary assessment of the sensitivity of air quality in California to global change. Clim. Change 87(S1):273–92. doi:https://doi.org/10.1007/s10584-007-9351-3.
- Korakianitis, T., A. M. Namasivayam, and R. J. Crookes. 2011. Natural-gas fueled spark-ignition (SI) and compression-ignition (CI) engine performance and emissions. Prog. Energy Combust. Sci. 37 (1):89–112. doi:https://doi.org/10.1016/j.pecs.2010.04.002.
- Lane, B. 2019. Alternative light- and heavy-duty vehicle fuel pathway and powertrain optimization. Irvine: University of California.
- Lanni, T., B. P. Frank, S. Tang, D. Rosenblatt, and D. Lowell. 2003. Performance and emissions evaluation of compressed natural gas and clean diesel buses at New York City’s metropolitan transit authority. SAE Trans. 112:182–95.
- López, J. M., Á. Gómez, F. Aparicio, and F. J. Sánchez. 2009. Comparison of GHG emissions from diesel, biodiesel and natural gas refuse trucks of the City of Madrid. Appl. Energy 86 (5):610–15. doi:https://doi.org/10.1016/j.apenergy.2008.08.018.
- Mac Kinnon, M., B. Shaffer, M. Carreras-Sospedra, D. Dabdub, G. S. Samuelsen, and J. Brouwer. 2016. Air quality impacts of fuel cell electric hydrogen vehicles with high levels of renewable power generation. Int. J. Hydrogen Energy 41 (38):16592–603. doi:https://doi.org/10.1016/j.ijhydene.2016.07.054.
- Mac Kinnon, M., S. Zhu, M. Carreras-Sospedra, J. V. Soukup, D. Dabdub, G. S. Samuelsen, and J. Brouwer. 2019. Considering future regional air quality impacts of the transportation sector. Energy Policy 124:63–80. doi:https://doi.org/10.1016/j.enpol.2018.09.011.
- McCormick, R. L., M. S. Graboski, T. Alleman, A. M. Herring, and P. Nelson. 1999. In-use emissions from natural gas fueled heavy-duty vehicles. SAE Technical Paper.
- McTaggart-Cowan, G. P., C. C. O. Reynolds, and W. K. Bushe. 2006. Natural gas fuelling for heavy-duty on-road use: Current trends and future direction. Int. J. Environ. Stud. 63 (4):421–40. doi:https://doi.org/10.1080/00207230600802056.
- Mena-Carrasco, M., E. Oliva, P. Saide, S. N. Spak, C. de la Maza, M. Osses, S. Tolvett, J. E. Campbell, T. E. C.-C. Tsao, L. T. Molina, et al. 2012. Estimating the health benefits from natural gas use in transport and heating in Santiago, Chile. Sci. Total Environ. 429:257–65. doi:https://doi.org/10.1016/j.scitotenv.2012.04.037.
- Miller, W., K. Johnson, T. Durbin, and P. Dixit. 2013. In-use emissions testing and demonstration of retrofit technology for control of on-road heavy-duty engines. Diamond Bar, CA. [ Online]. https://www.cert.ucr.edu/research/efr/2013_AQMD_in-use_retrofit_Miller.pdf
- Mobile Source Strategy. Sacramento, CA. 2016. [ Online]. Accessed May 1, 2018. https://www.arb.ca.gov/planning/sip/2016sip/2016mobsrc.pdf
- National Centers for Environmental Prediction/National Weather Service/NOAA/U.S. Department of Commerce, National Center for Atmospheric Research, Computational and Information Systems Laboratory. 2000. NCEP FNL operational model global tropospheric analyses, continuing from July 1999. Research data. Research Data Archive at the National Center for Atmospheric Research, Computational and Information Systems Laboratory.
- Next Generation Heavy-Duty Natural Gas Engines Fueled By Renewable Natural Gas. [ Online]. Accessed June 10, 2017. http://ngvgamechanger.com/pdfs/GameChanger_FullReport.pdf
- ORNL. 2016. LandScan. Oak Ridge, TN: Oak Ridge National Laboratory. http://web.ornl.gov/sci/landscan/
- Pan, S., A. Roy, Y. Choi, S. Sun, and H. O. Gao. 2019. The air quality and health impacts of projected long-haul truck and rail freight transportation in the United States in 2050. Environ. Int. 130:104922. doi:https://doi.org/10.1016/j.envint.2019.104922.
- Pope III, C. A., and D. W. Dockery. 2006. Health effects of fine particulate air pollution: Lines that connect. J. Air Waste Manage. Assoc. 56 (6):709–42. doi:https://doi.org/10.1080/10473289.2006.10464485.
- Pusede, S. E., D. R. Gentner, P. J. Wooldridge, E. C. Browne, A. W. Rollins, K.-E. Min, A. R. Russell, J. Thomas, L. Zhang, W. H. Brune, et al. 2014. On the temperature dependence of organic reactivity, nitrogen oxides, ozone production, and the impact of emission controls in San Joaquin Valley, California. Atmos. Chem. Phys. 14(7):3373–95. doi:https://doi.org/10.5194/acp-14-3373-2014.
- Pye, H. O. T., R. W. Pinder, I. R. Piletic, Y. Xie, S. L. Capps, Y.-H. Lin, J. D. Surratt, Z. Zhang, A. Gold, D. J. Luecken, et al. 2013. Epoxide pathways improve model predictions of isoprene markers and reveal key role of acidity in aerosol formation. Environ. Sci. Technol. 47(19):11056–64. doi:https://doi.org/10.1021/es402106h.
- Quiros, D. C., A. Thiruvengadam, S. Pradhan, M. Besch, P. Thiruvengadam, B. Demirgok, D. Carder, A. Oshinuga, T. Huai, S. Hu, et al. 2016. Real-world emissions from modern heavy-duty diesel, natural gas, and hybrid diesel trucks operating along major California freight corridors. Emiss. Control Sci. Technol. 2(3):156–72. doi:https://doi.org/10.1007/s40825-016-0044-0.
- Ris, C. 2007. US EPA health assessment for diesel engine exhaust: A review. Inhal. Toxicol. 19 (sup1):229–39. doi:https://doi.org/10.1080/08958370701497960.
- Sacks, J. D., J. M. Lloyd, Y. Zhu, J. Anderton, C. J. Jang, B. Hubbell, and N. Fann. 2018. The environmental benefits mapping and analysis program–community edition (BenMAP–CE): A tool to estimate the health and economic benefits of reducing air pollution. Environ. Model. Softw. 104:118–29. doi:https://doi.org/10.1016/j.envsoft.2018.02.009.
- Shen, E., A. Oliver, and S. Dabirian. 2017. Final socioeconomic report. South Coast Air Quality Management District. http://www.aqmd.gov/docs/default-source/clean-air-plans/socioeconomic-analysis/final/sociofinal_030817.pdf?sfvrsn=2
- Thiruvengadam, A., M. C. Besch, P. Thiruvengadam, S. Pradhan, D. Carder, H. Kappanna, M. Gautam, A. Oshinuga, H. Hogo, M. Miyasato, et al. 2015. Emission rates of regulated pollutants from current technology heavy-duty diesel and natural gas goods movement vehicles. Environ. Sci. Technol. 49(8):5236–44. doi:https://doi.org/10.1021/acs.est.5b00943.
- Tong, F., P. Jaramillo, and I. M. L. Azevedo. 2015. Comparison of life cycle greenhouse gases from natural gas pathways for medium and heavy-duty vehicles. Environ. Sci. Technol. 49 (12):7123–33. doi:https://doi.org/10.1021/es5052759.
- US EPA. 2017. SMOKE v4.5 user’s manual. Office of Air Quality Planning and Standards, Air Quality Assessment Division.
- US Environmental Protection Agency. 2020. How to identify low NOx certified engines diesel emissions reduction act (DERA) grants fact sheet [ Online]. Accessed March 3, 2020. https://www.epa.gov/sites/production/files/2020-02/documents/420f20010_0.pdf
- US EPA Office of Research and Development. 2017. CMAQ (Version 5.2). Zenodo. doi: https://doi.org/10.5281/zenodo.1167892.
- Valand, R., P. Magnusson, K. Dziendzikowska, M. Gajewska, J. Wilczak, M. Oczkowski, D. Kamola, T. Królikowski, M. Kruszewski, A. Lankoff, et al. 2018. Gene expression changes in rat brain regions after 7-and 28 days inhalation exposure to exhaust emissions from 1st and 2nd generation biodiesel fuels-The FuelHealth project. Inhal. Toxicol. 30(7–8):299–312. doi:https://doi.org/10.1080/08958378.2018.1520370.
- Watson, J. G., and J. C. Chow. 2002. A wintertime PM2. 5 episode at the Fresno, CA, supersite. Atmos. Environ. 36 (3):465–75. doi:https://doi.org/10.1016/S1352-2310(01)00309-0.
- Zapata, C. B., C. Yang, S. Yeh, J. Ogden, and M. J. Kleeman. 2018. Low-carbon energy generates public health savings in California. Atmos. Chem. Phys. 18 (7):4817–30. doi:https://doi.org/10.5194/acp-18-4817-2018.
- Zhao, B., T. Wang, Z. Jiang, Y. Gu, K.-N. Liou, N. Kalandiyur, Y. Gao, and Y. Zhu. 2019. Air quality and health cobenefits of different deep decarbonization pathways in California. Environ. Sci. Technol. 53(12):7163–71. doi:https://doi.org/10.1021/acs.est.9b02385.
- Zhu, S., J. R. Horne, M. Mac Kinnon, G. S. Samuelsen, and D. Dabdub. 2019. Comprehensively assessing the drivers of future air quality in California. Environ. Int. 125:386–98. doi:https://doi.org/10.1016/j.envint.2019.02.007.
- Zhu, S., J. R. Horne, J. Montoya-Aguilera, M. L. Hinks, S. A. Nizkorodov, and D. Dabdub. 2018. Modeling reactive ammonia uptake by secondary organic aerosol in CMAQ: Application to the continental US. Atmos. Chem. Phys 18 (5):3641–57. doi:https://doi.org/10.5194/acp-18-3641-2018.
- Zwissler, B., and S. Ptucha. 2018. Ultra-low emission natural gas 12-liter engine for on-road heavy-duty vehicles [ Online]. Accessed May 1, 2019. https://www.energy.ca.gov/2019publications/CEC-500-2019-002/CEC-500-2019-002.pdf