
 ?Mathematical formulae have been encoded as MathML and are displayed in this HTML version using MathJax in order to improve their display. Uncheck the box to turn MathJax off. This feature requires Javascript. Click on a formula to zoom.
ABSTRACT
Municipal solid waste constitutes significant quantities of waste generated in markets. Markets produce substantial quantities of fruit and vegetable waste, a source of nuisance in landfills. In Ghana, market waste (MW) appears to be unexplored and has limited data available. The need for MW valorization in the face of a circular economy requires reliable knowledge of MW properties. The study determined the waste compositions of selected major markets from two different classes of settlement in Kumasi and the seasonal effect on the compositions. The chemical properties of organics were determined via proximate and ultimate analyses and the theoretical biomethane potential, with the Buswell equation. From the results, MW composition in the wet season is 59.6% organic, 11.4% plastics, 8.3% paper, 5.3% textiles, 4.7% inert, 4.1% miscellaneous, 2.1% metal, 1.8% glass and 2.8% leather. The dry season values are 45.8% organic, 14.6% plastics, 12.7% paper, 7.3% textiles, 6.4% inert, 4.3% miscellaneous, 2.3% metal, 2.6% glass and 3.9% leather. An ANOVA indicates significant differences between the two seasons and some waste components; organics, plastics, paper and cardboard, leather, and inert. The high calorific values recorded ranged from 14.8 MJ kg−1 to 16.6 MJ kg−1. The biogas potential and biomethane content ranged from 775.3 l/kgVS to 828.9 L/kgVS and 50% to 57% respectively.
Implications: Market waste (MW) in Ghana appears to be an unchartered area and there is limited data on market generation and composition. The need for MW valorization requires reliable knowledge on MW properties. This study explores MW characteristics of six major market from two different classes of settlements in a developing country. Study findings suggest that the quantities of market organics are higher than household waste. Again, MW composition can be influenced by season and geographical location. Furthermore, the study establishes the potential of MW in considerable quantities of biogas and methane generation, in comparison with household waste.
Introduction
Environmentally sound waste management ranks high on the agenda of many high-level international discussions globally. Currently, the transition of municipal solid waste (MSW) management into the circular economy has taken center-stage in efforts to manage waste (Ayeleru et al. Citation2018) and facilitate the diversion of organics, which reach landfills than any other single material, from landfills (Lopez et al. Citation2016; Lou et al. Citation2013). Fisgativa et al. (Citation2016), recount the national objectives of food waste (FW) collection and valorization that many European and some Asian countries have instituted to reduce FW landfilling. Yet, in many developing nations, landfilling is the commonest form of disposal for food, fruit, and vegetable waste (FFVW) (Aye and Widjaya Citation2006; Bouallagui et al. Citation2005; Oduro-kwarteng, et al. Citation2014).
Literature shows that MSW constitutes significant quantities (approximately 20–40%) of waste generated in market areas (Masó & Blasi Citation2008; Okot-Okumu and Nyenje Citation2011; Solomon Citation2011). Likewise, significant quantities of FFVW are generated in markets as compared to households and is a source of nuisance in landfills because of their rapid degradation (Chandrappa and Das Citation2012). A study conducted in South Africa in 2016 revealed the organic fractions of MSW collected from households, restaurants, and a fruit and vegetable market in Johannesburg to be 34%, 14%, and 93% by weight respectively (Masebinu et al. Citation2018). Lim et al. (Citation2017), allude that FFVW which forms the bulk of market waste (MW), is a major component of MSW in Malaysia. Kitinoja and Kader (Citation2015) show that postharvest losses such as rough handling, poor quality packaging, high postharvest handling temperatures, and delays in produce marketing account largely for the huge quantities of organics in MW. The authors reported that in West Africa, losses for vegetables are high, ranging between 70% to 80%, while losses in fruits are between 50% to 70%.
The high organic fractions and easily bio-degradable nature of MW show their potential to generate energy at an affordable cost, hence improving access to energy and related energy services (Mohan et al. Citation2009; Palaiogeorgou et al. Citation2017). Studies have been conducted in many high and middle-income economies on the utilization of organic wastes from market sources. Palaiogeorgou et al. (Citation2017) demonstrated that FFVW from markets that are rich in carbohydrates can be utilized as fermentation feedstocks for 2,3- butanediol (BDO) production. Masebinu et al. (Citation2018) assessed the feasibility of biogas production via anaerobic digestion (AD) of fruit and vegetable waste from the Johannesburg market, South Africa. Results from their study were used to assess a full-scale 45 tons/d plant for the Johannesburg market considering three energy pathways.
Markets in Ghana generate considerable amounts of waste. Poor post-harvest storage systems constitute an important factor as most of the markets lack appropriate storage facilities (FAO Citation2011). For instance, at the retail level, the shelf life of agricultural products being sold in poorly-packed form is diminished (Adom Citation2018) resulting in high quantities of market organic waste. Waste management authorities in many Ghanaian cities have been stifled in their efforts by numerous challenges including inadequate funding, poor public attitude, inadequate infrastructure, inadequate equipment, and poor maintenance culture. In Kumasi alone, about US$491,730 is spent monthly on solid waste collection and disposal (Alhassan et al. Citation2020)
In Ghana, most of the publications have focused on household waste (Asase Citation2011; Miezah et al. Citation2015; Ofori-Boateng et al. Citation2013). MW in Ghana appears to be an unchartered area and there is limited data on market generation and composition. The need for MW valorization requires reliable knowledge of waste properties hence, characterization is critical to estimate the material recovery potential and identify sources of component generation (Abur et al. Citation2014; Pagliaccia et al. Citation2019).
Additionally, the environmental evaluation of sustainable waste management systems depends not only on the waste physical characteristics but also on the chemical properties of the individual fractions. Studies on MW chemical properties in Ghana are lacking. The study also determined the chemical properties of MW organics and estimated the theoretical biogas potential.
Again, seasonal waste characterization has been observed to be limited in reported waste data in Ghana, although it is critical in checking periodic fluctuations in waste compositional heterogeneity. Fisgativa et al. (Citation2016), observed the seasonal impact on FW characteristics and indicated the challenges posed when optimizing the supply chain of renewable energy production, as the feedstock supply is distinct seasonally but energy is required all year. Again, Shi et al. (Citation2017), mentioned that the moisture content of domestic waste in wet seasons was ten times that of dry seasons in Kétao, Togo.
Furthermore, MW represents a desirable feedstock for resource recovery technologies because while household waste is found in smaller quantities at several locations, MW is generated in bulk. The objective of the study was to conduct a compositional analysis of MW and identify the impact of the seasonal changes on the compositions. This is with the view to making recommendations to policymakers, environmentalists, and the government of Ghana toward effective SWM.
Materials and methods
Study area
Kumasi (total area of 254 sq. km), the capital town of the Ashanti region, is the second-largest densely inhabited city in Ghana, next to the nation’s capital (Accra). Kumasi has a population of 2,035,064 and an annual growth rate of 4.8%. The major rainy season starts in March, with a major peak in June. There is a slight dip in mid-July and a peak in August, tapering off in November. December to February is dry, hot, and dusty. The average annual mean temperature is about 27°C. Daytime temperatures in the dry season are about 31–32°C (88–90°F) in December and January and reach 34°C (93°F) in February. In the rainy season, the average temperatures are about 28–30°C in May and June, reaching 28°Cin July and August (Ghana Statistical Service Citation2014).
Kumasi metropolis, for effective administration, is comprised of nine sub-metropolitan districts (as at the time of the study) namely; Asokwa, Bantama, Kwadaso, Manhyia, Oforikrom, Nhyiaeso, Suame, Subin, Tafo. Based on population density, the settlement design of the metropolis has been stratified into two, namely, high-medium (Bantama, Oforikrom, Subin, Kwadaso sub metros) and low-medium (Suame, Tafo, Nhyiaeso, Asokwa, and Manhyia sub metros) density settlements respectively (Ghana Statistical Service Citation2012).
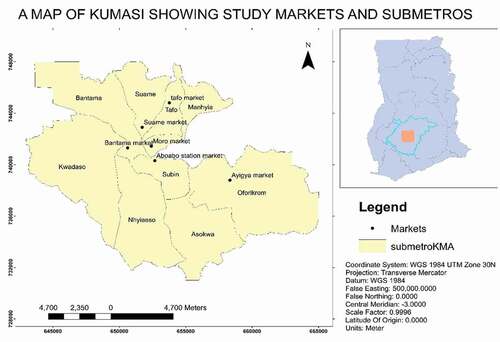
The study covered two-thirds of the metropolis and took into account 3 sub metros from each of the above categories to achieve a fair sample representation. From the high medium settlement category, Bantama, Oforikrom, and Subin were selected while Suame, Tafo, and Manhyia were chosen from the low-medium settlements. Market statistics are generally poor in Ghana and there is a dearth of information about markets in Kumasi. For instance, there are challenges associated with market population data acquisition. Despite the lack of information, six markets were selected for the study, one each from the pre-selected sub-metropolitan assemblies (). The selection was based on the population of the sub-metro and can be deemed representative of all the markets within the sub-metro.
Figure 1. Map of Kumasi showing markets sampled for the study
Waste sorting and weighing procedure
To ensure seasonal variations in the waste generated was captured, the MW from six markets were sampled in both the wet season (May and June 2017) and dry season (January and February 2018). The time lag between the two sampling periods was not significant to cause variations in results obtained. A total of 150 waste samples of 100 kg each from the markets (25 samples from each market) were studied following ASTM D5231-92 (2008) “Standard Test Method for Determination of the Composition of Unprocessed MSW.” Manual sorting was performed under a canopy in an empty cell at the Oti landfill site by a research team of eight persons. MW was unloaded from trucks at a designated site and divided into four waste heaps. The samples obtained from the quartered waste load were transported in wheelbarrows to the sorting area where they were weighed to obtain 100 kg and then unloaded unto the table for sorting. A large, flat table lined with tarpaulin was used for sorting to prevent the risk of erroneous analysis resulting from rough surfaces and the chance of analyzed samples’ contamination with the ground. Waste samples were hand sorted into nine major categories and put into labeled plastic containers. They included organics, paper and cardboard, plastic, metal, glass, textiles, leather, miscellaneous, and inert components. Empty plastic containers were first weighed to obtain their “dry masses” before they were filled with sorted waste. The filled containers were weighed after all sorting activities. The percentage composition was calculated by the expression in EquationEq. (1(1)
(1) ), previously utilized by UNEP, Citation2013.
Analytical methods
The chemical composition of the organic component of MW sampled in the wet season was determined through ultimate and proximate analyses. These parameters were measured according to ASTM (Citation2008) standards. High calorific values were determined with a bomb calorimeter. Lignin was determined using the Klason method according to ASTM D 1106–96 (Citation2007). Cellulose was determined based on ASTM D 1103–96 (2007) and hemicellulose ASTM D 1104– 96 (2007).
Theoretical biomethane potential
Boyle’s modified Buswell equation was used to determine the theoretical biogas and methane potential at standard conditions (0°C, 1 atm) as shown in EquationEquations (2)(2)
(2) and (Equation3
(3)
(3) ). This was used together with the result of the chemical composition of market organic waste (Achinas et al. Citation2016; Antwi et al. Citation2019; Boyle Citation1976).
C – Carbon, H – Hydrogen, O – Oxygen, N – Nitrogen, S – Sulfur, H2O – Water, CH4 – Methane, CO2 – Carbon dioxide, NH3 – Ammonia, H2S – Hydrogen Sulfide. Bu is the maximum methane potential of the market organic waste and the constant of each element (a,b,c,d,e) is equal to the ultimate analysis-based mass divided by the molar mass of the element.
Data analysis
Descriptive statistics were used to analyze data for physical and chemical characterization of the MW. Analysis of variance (ANOVA) was used to determine if there was a significant difference between the percentage composition of MW in the wet and dry seasons.
Results and discussion
Organics composition
The organic fraction recorded at the Bantama market (66.4%) as seen in , can be attributed to the large numbers of food and vegetable traders and the relatively cheaper prices of goods that attract traders from neighboring sub metros to buy and then retail in their respective sub-metros. The situation is similar in the Suame market with 63% recorded. Another reason for the observation could be the market’s proximity to the Komfo Anokye Teaching Hospital (KATH), Ghana’s second-largest teaching hospital. Patients, relatives of admitted patients, and the staff of the hospital often patronize the Bantama market for various grocery needs.
Figure 2. Organic waste percentage for wet and dry season
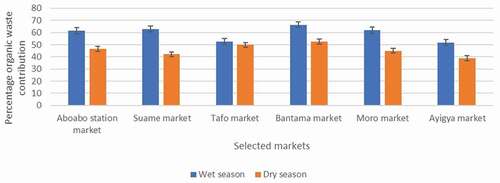
Contrary to expectation, the Aboabo station market which recorded 46.5% did not establish dominance, though it shares boundaries with the central business district (CBD) of Kumasi which has considerable foodstuff trading activities and an estimated number of 1,000,000 people entering and egressing for various commercial purposes. This could be attributed to the relatively high variation of goods and services in the market as compared with the Bantama and Suame markets.
Study results suggest that MW organics are influenced by many factors such as season, geographical location, and cultural diversity. The dominance of organics can be attributed to the abundance of fruits and vegetables in the wet season. Bouallagui et al. (Citation2005) and Masó and Blasi (Citation2008) reported similar findings. Denafas et al. (Citation2014), attributed increased FW to harvesting activates. Generally, markets generate huge quantities of root and tubers, fruit, and vegetable waste as a result of spoilage. This observation is a reflection of the poor post-harvest storage systems in Ghana, with markets lacking appropriate storage facilities (FAO Citation2011). Hence, at the retail level, the shelf life of several agricultural products being sold in poorly-packed form diminishes. Again, during the rainy season, many feeder roads linking rural parts of Kumasi to the urban centers get damaged, with frequent transport breakdown during transport of produce to markets (FAO Citation2011). These result in the bruising of agricultural produce and reduces the shelf life of many farms produce on the markets leading to increased organic waste. Shi et al. (Citation2017), attested to the impact of consumption and living habits in different seasons on the number of organics generated.
The study also indicates the seasonality of MW organics is also influenced by religious festivals and events as indicated by Al-Khazali et al. (Citation2017). Major religious festivals such as Easter (held by Christians who form about 65% of the Kumasi populace) is celebrated in April. Eid al-Fitr and Eid al-Adhar (held by Muslims who form about 20% of the Kumasi populace) also fall within the wet season during the study period. These festivals are marked with feasts held at social gatherings, and the cooking of festive meals by families, all of which enhance vibrant trading activities of agricultural produce from markets. The observation is in agreement with Rafiee et al. (Citation2018), who discussed festivals and events as key factors that affect the seasonal variation of MSW composition in Columbia and Iran respectively.
Except for the Tafo market, there appeared to be a significant increase in the organic waste fraction at all markets during the wet season, compared with the dry season (). This could be attributed to the Tafo MW organics being highly patronized as raw material for certain agricultural purposes, such as livestock feed as the Tafo inhabitants engage in livestock rearing. Again, it was observed that for both seasons, the Bantama market (wet:66.4%, ndry:52.5%) presents the highest contributions respectively. This is not surprising as Bantama is a medium-high populated sub- metro in the Kumasi metropolis.
To determine the seasonal variation in the percentage composition of MW, findings from an ANOVA showed strong fluctuations in organics (p = .002). A decrease of approximately 14% was identified in the percentage composition of organics across the markets in the dry season. This could be due to the reduced moisture content in waste generated, by the evaporation of water owing to relative temperature increase (by 2.8°C) in the dry seasons (Abylkhani et al. Citation2019; Ghana Statistical Service, Citation2012). High moisture- containing organics that were noticed during visual inspection contributed to the increased percentage weight in the wet seasons. They include oranges, mangoes, bananas, sugarcane, pineapples, pawpaw, peanuts, watermelons, avocados, cabbages, eggplant, cucumber, okra, and lettuce. The observation agrees with similar studies conducted by Hussain et al. (Citation2014) and Abylkhani et al. (Citation2019), who showed that the seasonal variations were significant for organics due to the higher consumption of fruits and vegetables in summer.
Further, comparable studies demonstrate the impact of geographical location and cultural diversity on waste generated. Using wet season data in the northern part of Ghana, Bowam and Tierobaar (Citation2014) recorded MW organic fraction of 47%, quite different from the MW (59.6%) recorded in the study. The northern (upper east, upper west, and northern) regions of Ghana are least developed in comparison with the forest regions (in which Kumasi is located) due to low economic activity, poor and unreliable rainfall, and unfertile lands (Balana et al. Citation2019; Monney et al. Citation2013). Again, vegetation in the northern region facilitates animal breeding which largely utilizes the organic residue from households and fields. Boer et al. (Citation2010), reported in-house composting as a factor that influences the composition of solid waste in both rural and urban areas. Shi et al. (Citation2017), reported the impact of culture on the behavior of rural folks in Tibet, China, on waste composition, who harvest vegetation and return leftovers to the land as compost or utilize as livestock feed. Further, the major staple food crops such as maize, millet, sorghum, rice and cowpea, and rice consumed up-north (Balana et al. Citation2019; FAO Citation2011) generate less organic waste.
Results from the study buttress the findings of Bouallagui et al. (Citation2005), Masó and Blasi (Citation2008) Solomon (Citation2011), Okot-Okumu and Nyenje (Citation2011), and Okot-okumu (Citation2012), which report significant organic waste generated from markets, in comparison with households. The average organic fraction (59.6%) of waste for the wet season was found to be higher than the organic fraction (48.4%) in, for instance, the household survey conducted by Miezah et al. (Citation2015) in Kumasi.
Cumulatively, the results indicate that organic waste dominated the waste composition for both the wet (59.6%) and dry (45.8%) seasons () implying that, resource recovery and other waste treatment techniques would be comparatively more efficient in treating an organic fraction of MW than household waste. This is because, in general, the wastes generated from traditional markets are more uniform and less hazardous than waste from other sources. Currently, the Kumasi market organic waste is commingled with other fractions and landfilled. However, organic waste, if properly sorted from the MW stream, could serve as a useful resource for waste to energy projects which could augment energy requirements for the Kumasi metropolis.
Plastics composition
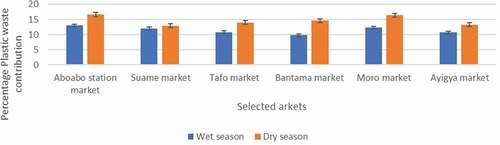
A significant increase in plastic waste fractions is observed across the markets during the dry season (). The dominance in plastic waste by the Aboabo station market, in both seasons, is expected. Besides the market (in the Subin sub-metro) belonging to the category of medium-high population, it is also the most populated and most patronized market in the metropolis. The observation could be due to the extensive use of plastics as packaging materials and the comparatively higher patronage and consumption of plastics-packaged refreshment products. The Moro market is a hotspot for a variety of secondhand (used) footwear that arrives packaged in plastic materials known as “bales,” throughout the year. Hence, it’s position next to the Aboabo station market, is not unexpected, although it belongs to the small-medium category of the population.
Figure 3. Plastic waste percentage for wet and dry season
Despite efforts to limit their utilization and indiscriminate disposal, plastics have increasingly become the preferred choice of packaging, because of their lightweight, ease of storage, re-use, and disposal (Kumi-Larbi Jnr et al. Citation2018). Polyethylene bags for drinking-water sachets and polyethylene terephthalate (PET) bottles are commonly used plastics in Ghana. Tulashie et al. (Citation2020), report that about 22,000 tonnes of plastic waste are produced annually which poses unfavorable threats to the health and safety of Ghanaians. Polyethylene bags for drinking-water sachets, PET bottles containing soft drinks and vegetable cooking oil, low-density polyethylene, and polystyrene used for wrapping food and as carrier/garbage bags were largely predominant in the MW and the observation is in good agreement with findings by Bowam and Tierobaar (Citation2014). The recorded fractions from the markets are therefore expected and the trend is likely to increase in the coming years.
Again, seasonal variations and geographical locations were factors observed to influence plastic waste generation in the markets. There was an increase of 3.2% in plastic waste during the dry season and the difference was statistically significant (p= .002). This could be occurring as a result of high patronage of “iced water” and other cold products, packaged in plastics, which consumers employ to mitigate the discomfort created by the hot conditions. Plastic waste which ranged from 9.8% to 13% in the wet season rose to 12.9% to 16.6% in the dry season. The relatively high temperatures are thus related to the consumption of drink products as mentioned by Gómez et al. (Citation2009) and Kamran et al. (Citation2015). Comparable findings were also made by Gidarakos et al. (Citation2006), who document a rise in packaging waste during the summer period on the island of Crete.
The influence of geographical location on plastic waste is also indicated in the findings. Bowam and Tierobaar (Citation2014) recorded 20% plastics in the wet season in the northern regions of Ghana which is higher than was recorded in this study, and attributable to relatively high patronage of plastic water containers and packaging materials for the staple food (kooko, waakye, tuo zafi, pito, among others) of the people in the northern regions (Monney et al. Citation2013).
It is interesting to note that plastic waste fractions are lower in markets compared to households. Overall, average plastic fractions (11.4% wet and 14.6% dry season) reported in this study were found to be lower than that (17.6%) reported in a household survey conducted in Kumasi by Miezah et al. (Citation2015). This discrepancy could be due to the proliferation of itinerant bargain hunters of unwanted plastics, mainly high-density plastics, in the markets. The need for local authorities to promote the acceptance of source separation practice in the markets is critical as plastic waste has monetary value and constitutes the second highest waste material which could be a major resource for recycled products. Kumar et al. (Citation2018), indicate that about 6.5 tons to 8.5 tons per day of plastic waste is collected by itinerant waste buyers and scrap dealers, and about 50% to 80% of this fraction is recycled.
Paper and cardboard composition
Paper and cardboard waste were found to consist mainly of newspapers, corrugated cardboard, cartons, and folding boxes. The top contributing market is Suame (17.7%) and Ayigya (14.2%) markets respectively (). During the wet season, the Suame market still records the highest fraction of paper waste (10.5%).
Figure 4. Paper and cardboard waste percentage for wet and dry season
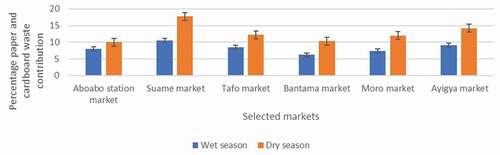
The Suame market is located in a small-medium population sub-metro, yet records the highest paper waste fraction in both seasons, due to the nature of businesses in the market. Gómez et al. (Citation2009), noted that seasonal variation of MSW composition could result from the number and type of commercial enterprises in the study area. Scores of cold stores saturating the market lead to highly patronized imported fish and meat. The paper and cardboard used to package the imported fish become waste after the fish has been sold. Fish, for instance, is sold fresh, smoked, salted and dried, sun-dried, fermented, and fried, all of which are packaged to consumers in paper and cardboard. Again, it was observed that the proximity of the Suame market’s communal waste bin to the Suame Police station restrains the burning of paper and cardboard waste by the janitors at the waste collection centers.
Paper and cardboard waste ranged from 6.2% to 10.5% in the wet season but in the dry season, there was a rise from 10% to 17.7%. There was a significant difference (p = .001) between values obtained for wet and dry seasons.
The results suggest that geographical location influenced paper waste generation. Monney et al (Citation2013), estimated the household fraction of paper and cardboard waste in the northern savanna geographic zone to be 3%, which was lower than values recorded in the study. Meanwhile, Miezah et al. (Citation2015), recorded the household fraction of paper and cardboard waste in Accra in the coastal zone to be 5.3%. The reason could be the prevalence of socio-economic activities and businesses in the forest and coastal zones of the country as against the northern regions of Ghana, implying low economic output for these areas just as Saidan et al. (Citation2017), conclude. Shi et al. (Citation2017), also attributed MSW composition to factors including the economy, urban development, and industry types.
Cumulatively, the paper and cardboard fraction constituted the third-largest MW. This was expected because plastics have replaced certain paper and cardboard packages due to their flexibility and affordability among other beneficial characteristics. For instance, drinking water, fruit juice, carbonated drink, and beverage companies prefer to package their products using polyethylene plastics instead of the cardboard boxes previously used. Bowam and Tierobaar (Citation2014), estimated paper waste fraction to be 11% lower than plastics in the Wa central market. Despite the recorded contribution in the study, it is observed that paper and cardboard are comparatively lower than plastics for both wet and dry seasons. Investigations conducted in the study showed that paper and cardboard waste is often burnt indiscriminately at the MW collection centers to create more room (in the communal waste bins) and make extra income. Although this is a prohibited practice due to the frequent fires at the markets resulting from electrical faults among others, and the consequent huge economic losses, it has become a common practice among janitors assigned to the collection bins.
The considerable fractions of paper and cardboard waste present in MW give a good indication of the significant separation potential for recycling purposes in paper mills projects. Paper recycling has not been initiated on a larger scale in the country, though few individuals have been recycling a smaller portion as sanitary tissues (Miezah et al. Citation2015). Generally, the recycling market and businesses can be strengthened by stable demand and the existence of local markets as mentioned by Saidan et al. (Citation2017).
Metals composition
The contribution of metal to MW is relatively low compared to organics, plastics, and paper and cardboard owing to waste pickers who amass substantial quantities of metal materials (aluminum and tin cans from alcoholic and nonalcoholic drinks, canned foods, etc.) from the MW bin sites. Similar conclusions were reached by Edjabou et al. (Citation2012), who reported the absence of aluminum cans and iron materials in the waste stream analyzed, and attributed it to their recycling to the informal sectors in Togo. The waste pickers generate income through informal waste recycling activities which are an essential component of ISWM (Kamran et al. Citation2015; UNEP, Citation2013).
The metal waste observed in the MW comprised of ferrous and non-ferrous metals, however, the greater portion consisted of empty tins from used canned foods and drinks. The source of these tins includes traders who cook within the market and its environs, fast food joints, and restaurants.
Except for the Aboabo station, Tafo, and Moro markets, the results do not suggest that metal waste fractions are influenced by season changes as seen in . The ANOVA showed that the difference was insignificant (p= .680). Nevertheless, the increased temperatures in the dry season could result in some rise in the consumption of canned drinks and beverages by sellers and customers. The high value recorded at the Aboabo station market (4.4%) in the dry season, however, was unanticipated. Although the Aboabo station market is the most populated, and well-patronized in Kumasi with an expected diverse metal waste product, it was ordinary that the activities of informal waste pickers would reduce the fractions considerably. This was however not the case, and a possible explanation could be unacceptable prices of recyclables coupled with a lack of preferred recyclable metal materials in the central MW. Saidan et al. (Citation2017) alluded to the promotion of recycling industries and trade in the presence of factors such as stable demand, accessibility of local markets, prices of virgin materials, and small variations in the market prices for recyclables. A similar conclusion can be made about the metal fraction (3.2%) from the Tafo market (2.3%) in the wet season and the Moro market (2.3%) waste generated in the dry season.
Figure 5. Metal waste percentage for wet and dry season
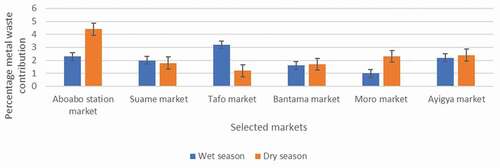
The “Suame Magazine,” a huge informal sector hub sheltering hordes of small-scale informal mechanical engineering artisans, garages, used automobile products, and scrap yards of assorted metal products, is near the Suame market. Owing to this, metal waste from the Suame market was predicted to be of a considerable size, however, contrary results were reported and a possible reason could be the vibrant recycling activities which the hub is well-known for. Tons of metal waste products are heaped in trucks and transported to metallurgy industries in the country and beyond. As a result, metal waste products remain at the hub, with even negligible quantities serving useful purposes to the waste pickers.
The average metal fraction recorded in the study for both wet (2.1%) and dry (2.7%) seasons was comparatively lower than that (4.5%) reported by Miezah et al. (Citation2015) whose work focused on households in Kumasi. Scrap metal dealers were observed to be more widespread in market areas where they find their enterprise more accessible as compared to the households.
Scrap metal has a huge market in Ghana and beyond which makes them attractive to itinerant buyers thereby reducing their composition in the MW stream. They are utilized in local steel industries and are even exported (Miezah et al. Citation2015), therefore, further investigation is required to determine the preferred metal types and statistics about metal waste pickers’ and their activities. Reliable information about scrap dealers and related informal recycling activities can create the ideal conditions needed for the development and maintenance of a stable recycling sector in the country.
Glass composition
Glass waste was low in selected markets, possibly due to the low utilization of glass-packaged products (). Though there are still some glass-packaged products including mayonnaise, salad cream, and alcoholic and nonalcoholic drinks, however, over time, these have given way to plastic packaging. This presents a win-win situation for both manufacturers and consumers as plastics present a cheaper alternative which translates to higher profits. Consumers, on the other hand, enjoy the affordability and convenience of handling. Again, the transition could be the health and safety concerns posed (by chipped edges and cracks developed on bottles) by the continuous refill and resale of glass bottled drinks (such as Guinness, coke, etc.) over some time by the manufacturers. In any case, when alcoholic and nonalcoholic drink bottles become damaged and unacceptable to manufacturers, they are often used by traders of cooking oil, traditional drinks (“pito”) among others as measuring vessels, while others prefer to use it in storing drinking water in their refrigerators. Gidarakos et al. (Citation2006), presented similar findings where extended use of non-refillable, non-returnable bottles by consumers was identified in a compositional analysis study in Crete, Greece.
Figure 6. Glass waste percentage for wet and dry season
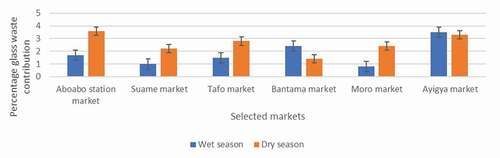
Except for Bantama market, glass waste was comparatively higher in the dry season. This can be explained by the increased intake of drinks packaged in glass bottles due to the high temperatures and associated heat discomfort. Findings are similar to those of Gidarakos et al. (Citation2006), who reported significant seasonal variation in glass waste in the summer. Contrarily, Abylkhani et al. (Citation2019), and Denafas et al. (Citation2014a) noted strong seasonal fluctuations in glass components in the cold seasons, due to the high consumption of alcoholic drinks. There was no influence of the wet and dry seasons on glass waste generated in the study (p = .146). Shi et al. (Citation2017), mentions the cultural impact of the Aba folks in the southwest of China known for their substantial drinking of alcoholic beverages, on the generation of considerable quantities of glass wine bottles in their domestic waste. This attests to the geographical and cultural influences on glass waste fractions.
Located in the most populated sub-metro, Ayigya market teems with a vast number of assorted commercial activities owing to the presence of the Kwame Nkrumah University of Science and Technology (KNUST) and several other tertiary (private) and secondary institutions. As a result, there is a consequent vibrant trading activity arising from students’ and campus workers’ patronizing services. Glassware (doors, window frames, and showcases) manufacturers were observed at the market. Moreover, the market which doubles as a cosmopolitan residence has numerous drinking pubs. These socio-economic activities contribute to the considerable quantity of glass waste recorded in the Ayigya MW during the dry (3.3%) and wet (3.5%) seasons which showed negligible seasonal variations. Similar factors were attributed to the glass waste values recorded at the Aboabo station market (3.6%) in the dry season.
The reported increase in packaging materials transitioning from glass to plastics (Gidarakos et al. Citation2006) is not only a result of the current consumption patterns but also an outcome of advanced practices for the marketing of merchandise. Glass waste is not much of an environmental menace and quantities generated in the Kumasi MW are not sufficient to generate recycling value.
Textiles composition
MW textiles comprised largely of post-consumer discarded clothing, carpet, curtains, residual worn-out clothing from the sale of imported “used” clothing, and pieces of unwanted fabric obtained from dressmaking and apparel alteration.
There was dominance established by the Ayigya market in both the wet (8.6%) and dry seasons (9.8%) (). This could be due to socio-economic impacts, as the market is located in the most populated sub-metro and shelters several businesses and educational institutions. There are several vibrant trading activities of “used” clothing and tailors plus dressmaking shops common to the market.
Figure 7. Textile waste percentage for wet and dry season
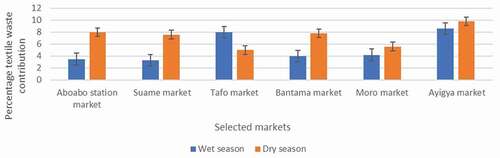
Increased textile waste fractions observed during the dry season could be attributed to many reasons. First, there is a rapid consumption of fabrics and tailor/hand-made clothing due to religious festivities in dry seasons. Christmas, for instance, is marked by the wearing of nice clothing for various feasts and gatherings. Comparatively, used clothing is cheaper than locally made clothing, and therefore it receives high patronage. Hence unsold clothing and other articles made from cloth easily add on to the waste generated. Furthermore, the utilization of local prints for outfits has recently gained much attention in Ghanaian society hence local prints are also patronized. Second, the reopening of educational institutions at the beginning of the year coincides with the dry season, raising MW textiles. During this period, students purchase locally-tailored articles including dresses, curtains, bedsheets, napkins, etc. The Tafo market however showed contrary results. The significantly lower content of textile waste from the Tafo market in the dry season could be explained by the influence of socio-economic factors such as the large extent of reuse of worn-out clothing for other purposes in the market. Similar findings were made by Denafas et al. (Citation2014) and Kamran et al. (Citation2015).
The study findings appeared to suggest that there is a seasonal influence on textile waste, however, the ANOVA indicates no significant difference between the wet and dry seasons (p = .142).
Further, it appears that textile waste in southern Ghana is higher than in the north, as comparatively lower values were recorded in the northern regions. The Wa central market for instance generated 3% textiles according to Bowam and Tierobaar (Citation2014) whiles Monney et al. (Citation2013) documented household textile waste to be 4%. This could be due to the economic downturns in the northern regions (Monney et al. Citation2013).
Fiber production from textile waste is the current trend globally (Centre Technique Cuir Chaussure Maroquinerie [CTC] Citation2000). Additionally, non-woven products such as covering blankets, waddings, absorbing blankets can also be generated from textiles (Dahlbo et al. Citation2016). The considerable quantities of textiles recorded in the Kumasi MW provide a potential business case for textile recycling in the markets, one that needs to be vigorously exploited in Ghana.
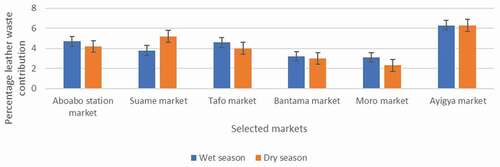
Leather composition
Market leather waste consisted of worn out, “used” leather products such as leather (synthetic, hybrid, and combination of the two) shoes, bags, belts, garments, wallets, residue from unsold, poor-quality leather goods, and residue from the cobblers, furniture and upholstery shops.
The Moro market made the highest contribution of leather waste (5.9%) during the wet season, recording values twice as much as values recorded in the other markets (). A relatively low percentage of contributions were received from the Bantama (1.5%) and Suame markets (1.4%) respectively. The comparatively low percentages recorded in the five other markets could suggest the relatively low number of cobbler shops as well as shops with leather products. Another reason could be the burning of this waste at the dumping sites.
Figure 8. Leather waste percentage for wet and dry season
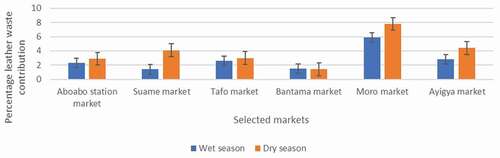
During the dry season, the Moro market again showed eminence (7.8%). Although the market is situated in a small-medium sub-metro with a relatively low population, it is associated particularly with the sale of various types of imported secondhand footwear, highly patronized by customers from within and outside the Manhyia sub-metro owing to their relatively low prices. The sales generate considerable quantities of leather waste arising from worn-out footwear that could not be sold. Also, the market teems with several cobbler and bag making shops that contribute to leather waste.
The dry season was observed to result in higher values of leather waste across the selected markets, except for Bantama market which experienced a marginal reduction of 0.1%. The increased values observed could be attributed to the escalated purchases made mostly by pupils/students at the beginning of the academic term/semester which falls in the dry season at the start of the year. Moreover, the beginning of the year sees a high demand for new footwear by the working population, particularly the workers in the formal sector.
Statistical analysis revealed a significant interaction between seasonal changes and leather waste composition (p = .041).
Studies on recycling of used leather products are lagging, although reports of production of value-added products from industrial leather wastes are not uncommon (Senthil and Hemalatha Citation2014). Production of regenerated leather from used leather wastes is an efficient way of recycling leather products. CTC (Citation2000) reported some solutions applied to leather scraps that have technical and sometimes commercial success viz., gelatin and chrome extraction, fiber and filler making, fertilizers, and non-woven materials. Since used leather goods contribute considerably to MW, ample research on their conversion into value-added products will be an economically beneficial way of reducing environmental pollution.
Miscellaneous composition
The Ayigya market notably obtained the same substantial fraction of miscellaneous waste (6.3%) in both seasons, and this was the largest contribution of miscellaneous waste across all markets (). A possible explanation for the high value could be the myriad of commercial enterprises that the Oforikrom sub-metro is distinguished with. This influences to a rather large extent, the different types of brisk commercial activities on the market as attested by Abylkhani et al. (Citation2019). They include schools, shops, hotels, restaurants, offices among others. The miscellaneous fraction constituted waste such as non-combustibles, construction, and demolition waste, nappies, sanitary napkins. The Aboabo station market also generated a significant portion (4.7%) of miscellaneous waste in the wet season.
Figure 9. Miscellaneous waste percentage for wet and dry season
For the dry season, the Bantama (3%) and the Moro markets (2.3%) again contributed the least fractions respectively. The predominance of the food and vegetable trade at the Bantama market could explain the low values recorded. Similarly, the Moro market, distinguished with imported “used” footwear merchandise could explain the low percentage of contributions made. Owing to the minimum variations in the fractions of waste generated in these markets, the low values of miscellaneous waste recorded are not surprising.
The ANOVA results indicate small variations in miscellaneous fractions that were not significant (p = .734) in the wet and dry seasons.
Inert composition
Unlike the usual gravel-like particles often reported in literature as inert waste, inert waste from the study differed slightly, comprising of FW scraps mixed with ash, soil-like materials, particles from sweepings, tiny plastic residue, broken glasses, and paper particles, among other fine materials. Tafo market was identified as the largest (8.2%) contributor to the inert waste, and this was in the wet season (). Contrary to expected findings, the least contribution was received from Aboabo station market (3%) although it is the most populated and patronized market in Kumasi.
Figure 10. Inert waste percentage for wet and dry season
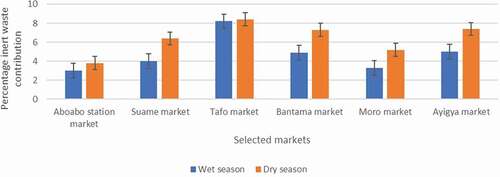
For the dry season, the greatest contribution of inert was from Tafo market (8.4%) due to the swarms of yam trade which the market is particularly associated with. The yam trade usually generates clay particles because they are root tubers mostly soiled with mud and dirt.
The study identified a relatively low percentage of inert materials (3% to 8.4%) as compared to 26%, 31.4%, and 33% inert recorded by Essumang (Citation2000), Asase (Citation2011), and Monney et al. (Citation2013), respectively in their MSW composition analysis using the household, from other parts of Ghana. A possible explanation was the deliberate exclusion of ash and sand resulting from market sweepings, from the MW stream. This practice by traders, which must be promoted, significantly reduced the fraction of inert materials, thereby decreasing the chance of deterioration of waste collection equipment. In contrast, Monney et al. (Citation2013), observed that sand from household sweepings formed a generous amount of the inert materials recorded in household waste. There was a notable increase in ash, sand, clay, and stone particles in waste fractions across selected markets in the dry season, which raised inert fractions recorded. Hence, as was expected, the difference was statistically significant (p= .007).
Chemical composition of MW organics and energy potential estimation
The total solids (TS) of the organics (19.4% to 28.2%) with volatile solids (VS) ranging between 80.0% and 87.4% indicated substantial conversion potential of these substrates (). Volatile Solids (VS) were higher in wet wastes. The moisture content of MW (71.8% – 80.6%) was observed to be relatively higher than household waste (25% – 76%) in Ghana (Adu and Lohmueller Citation2012; Fobil & Armah Citation2005) owing to the relatively larger quantities of FFVW which consist largely of water, as against household organic waste comprised of cooked kitchen waste. Likewise, Lopez et al. (Citation2016), found the moisture content (87.1%) of grocery store waste sampled from a street market to be higher than the FW (71.1%) of a university’s campus dining hall in North Carolina in the U.S.A.
Table 1. Chemical properties of MW organic fraction (wet season)
Phosphorus varied between 0.08% and 0.11%, much lower than phosphorus values of MSW organics recorded by Romero-cedillo et al. (Citation2017). Nitrogen content ranged between 0.8% and 2% and was also lower than nitrogen content (2.1% – 5.2%) of MSW organics reported by Alibardi and Cossu (Citation2015). Romero-cedillo et al. (Citation2017), who documented nitrogen levels (0.3% −3%) indicated that the organic fraction of MSW is typically poor in nutrients.
Hemicellulose ranged from 23.8% and 37.9% and cellulose varied between 16.2% and 29.4%. Edwiges et al. (Citation2018), found comparable cellulose values (13.8% to 26.9%) of market organic waste in Brazil. The lignin fraction of the MW was in the range of 19% to 33.9%. Tafo (33.9%) and Suame MW (33.4%) organics had the highest lignin values. Visually, waste from these two markets was observed to have considerable portions of high-fiber fruits and vegetables, corn cobs, plantain stalks and residues, yam, cassava, and sugarcane residues. The lignin values recorded were however higher than the lignin content (0.9% to 12%) of household FW reported by Pecorini et al. (Citation2016). The survey’s lignin values were equally higher than lignin values (8% – 10%) reported by Romero-cedillo et al. (Citation2017), and that (1.5% – 4.9%) observed by Lopez et al. (Citation2016). It must be noted that household organics do not always contain garden trimmings (seasonal) and other high-fiber vegetables (Rogoff and Screve Citation2019) that could lead to increased lignin levels as compared with organics from MW. Pecorini et al. (Citation2016) agree that lignocellulose is not only present in forest residues, agricultural residues, and energy crops but also MSW.
High calorific values (HCV) recorded in the study extended from 14.8 MJ kg−1 to 16.6 MJ kg−1. Also, Edwiges et al. (Citation2018), documented HCV of MW organics from 14.8 MJ kg−1 to 21.2 MJ kg−1. HCV can be determined more rapidly than overall chemical composition according to Edwiges et al. (Citation2018), hence very useful for predicting bio-methane potential in Anaerobic digestion (AD).
The average carbon content of organic fractions of the MW was 43.0%, which was lower than the values of the organics (45% – 52%) documented by Romero-cedillo et al. (Citation2017), and FW (45.3%) as recorded by Ayeleru et al. (Citation2018). This could result from the high concentration of vegetables (mainly composed of carbohydrates) and grains in market organics as compared to municipal and household organics mixed with higher concentrations of proteins (meat) and lipids.
Market organics have a theoretical biogas potential ranging from 775.5 l/kgVS to 828.9 l/kgVS. This was much higher than 476 ml/gVS obtained from FFVW (Li et al. Citation2013) using the Buswell’s equation but similar to 723 ml/gVS they obtained from kitchen waste. Similarly, results from the study were higher than pig manure (466 l/kgVS), cow manure (503 l/kgVS), and chicken manure (466 l/kgVS) obtained by Liu et al. (Citation2016). The biomethane content from the study ranged between 50% and 57%. Comparatively, the theoretical biomethane potential of market organic waste implies that market organic waste should be given serious consideration as a potential biomass feedstock for AD. shows the chemical composition of MW organics from this study and other reported studies.
Table 2. Chemical composition of MW organics from this study and other reported studies
Conclusion
The study determined the waste compositions of selected major markets in Kumasi and the seasonal effect on the compositions. The prominent MW fractions were organics, plastics, and paper and cardboard, for both seasons. An ANOVA indicated the significant variations of the organics (p = .002), plastics (p = .002), paper and cardboard (p = .001), leather (p = .041), and inert fractions (p = .007) for both seasons. Results show the dominance of organics for both wet (59.6%) and dry (45.8%) seasons which indicates the importance of resource recovery techniques targeting MW organics, especially as the void-space at the Oti landfill runs out of operational capacity. Plastic fractions (11.4% wet and 14.6% dry season) observed were lower than household waste plastics reported by Miezah et al. (Citation2015). The substantial quantities of plastics, paper, and cardboard recorded to give a good indication of the potential for sustainable operational activities of recycling projects in Kumasi. Since source separation is currently not practiced by households in Kumasi, the government and investors from the private sectors can target MW, taking advantage of their uniformity and long-term availability in larger amounts. The solid concentration (TS) of the wet season organics determined in the study was from 19.4% to 28.2%. Volatile solids (VS) ranged between 80.0% and 87.4% and calorific values ranged from 14.8 MJ kg−1 to 16.6 MJ kg−1. The cellulose, hemicellulose, and lignin values recorded suggest the need for the organic fraction of MW to undergo some pre-treatment processes to facilitate their use in bio-conversion technologies (as lignocellulosic substrates contain a high amount of sugar). The Kumasi MW data determined in the study has a wider, regional relevance and application as many Ghanaian cities are in need of improving their market management systems, and reliable MW data is critical if that need is to be met.
Acknowledgment
This study was funded by the Regional Water and Environmental Sanitation Centre Kumasi at the KNUST, with funding from the Ghana Government and the World Bank under the Africa Centre of Excellence project. Views expressed in this paper do not reflect those of the World Bank, Ghana Government, and KNUST. The authors thank the China section of the Air & Waste Management Association for the generous scholarship they received to cover the cost of page charges and make the publication of this paper possible.
Disclosure statement
No potential conflict of interest was reported by the author(s).
Additional information
Funding
Notes on contributors
Gloria Addae
Gloria Addae is a Ph.D. candidate at the Renewable Water and Environmental Sanitation, Kumasi (RWESCK) at the Civil Engineering department at Kwame Nkrumah University of Science and Technology.
Sampson Oduro-Kwarteng
Sampson Oduro-Kwarteng is an associate professor at the Civil Engineering department at the Kwame Nkrumah University of Science and Technology.
Bernard Fei-Baffoe
Bernard Fei-Baffoe is an associate professor at the Environmental Science department at the Kwame Nkrumah University of Science and Technology.
Mizpah Ama Dziedzorm Rockson
Mizpah Ama Dziedzorm Rockson is a senior lecturer at the Chemical Engineering department at the Kwame Nkrumah University of Science and Technology.
Joseph Xavier Francisco Ribeiro
Joseph Xavier Francisco Ribeiro is a lecturer of the Mechanical Engineering Department at the Kumasi Technical University, Ghana.
Edward Antwi
Edward Antwi is a scientific officer at the University of Rostock, Professorship of Waste and Resource Management.
References
- Abur, B. T., E. E. Oguche, and G. A. Duvuna. 2014. Characterization of municipal solid waste in the federal capital Abuja, Nigeria. Global J Sci. Front. Res. 14 (2):1–7.
- Abylkhani, B., B. Aiymbetov, A. Yagofarova, D. Tokmurzin, C. Venetis, S. Poulopoulos, Y. Sarbassov, and V. J. Inglezakis. 2019. Seasonal characterization of municipal solid waste from Astana city, Kazakhstan: Composition and thermal properties of combustible fraction. Waste Manage. Res. 37 (12):1271–81. doi:https://doi.org/10.1177/0734242X19875503.
- Achinas, S., G. Jan, and W. Euverink. 2016. Theoretical analysis of biogas potential prediction from agricultural waste. Resour-Effic. Technol. 2 (3):143–47. doi:https://doi.org/10.1016/j.reffit.2016.08.001.
- Adom, D. 2018. The role of good post-harvest management practices in the development of the agriculture sector in Ghana. In Trends & prospects in post-harvest management of horticultural crops, ed. I. Chakraborty, P. K. Paul, A. Mani, A. K. Tiwary, and K. Prasad, 169–88. New Deli: Today and Tomorrow’s Printers and Publishers.
- Adu, R. O., and R. Lohmueller. 2012. “The Use of Organic Waste as an Eco-Efficient Energy Source in Ghana.” 2012 (July):553–62.
- Alhassan, H., P. Adjei, and E. Owusu-sekyere. 2020. Households ’ source separation behavior and solid waste disposal options in Ghana’s Millennium City. J. Environ. Manage. 259 (December2019):110055. doi:https://doi.org/10.1016/j.jenvman.2019.110055.
- Alibardi, L., and R. Cossu. 2015. Composition variability of the organic fraction of municipal solid waste and effects on hydrogen and methane production potentials. Waste Manage. 36:147–55. doi:https://doi.org/10.1016/j.wasman.2014.11.019.
- Al-Khazali, O., E. Bouri, D. Roubaud, and T. Zoubi. 2017. The impact of religious practice on stock returns and volatility. Int. Rev. Financial Anal. 52:172–89. doi:https://doi.org/10.1016/j.irfa.2017.04.009.
- American Society for Testing and Materials. 2007. “Standard Test Method for Acid-Insoluble Lignin in Wood D1106-96.” ASTM International 96 (Reapproved): 1–2.
- American Society for Testing and Materials. 2008. Standard test method for determination of the composition of unprocessed municipal solid waste, ASTM D5231-92-2008, US.
- Antwi, E., N. Engler, M. Nelles, and A. Schüch. 2019. Anaerobic digestion and the effect of hydrothermal pretreatment on the biogas yield of cocoa pods residues. Waste Manage. 88:131–40. doi:https://doi.org/10.1016/j.wasman.2019.03.034.
- Asase, A. M. D. 2011. Solid waste separation at source: A case study of the Kumasi Metropolitan Area, a thesis submitted to the Chemical Engineering Department, Kwame Nkrumah University of Science and Technology, Kumasi, in partial fulfillment of the requirements for the Degree of Doctor of Philosophy, Faculty of Chemical and Materials Engineering, College of Engineering.
- Aye, L., and E. R. Widjaya. 2006. Environ. Econ. Anal. Waste Disposal Options Traditional Markets Indonesia 26:1180–91. doi:https://doi.org/10.1016/j.wasman.2005.09.010.
- Ayeleru, O. O., F. N. Okonta, and F. Ntuli. 2018. Municipal solid waste generation and characterization in the City of Johannesburg: A pathway for the implementation of zero waste. Waste Manage. 79:87–97. doi:https://doi.org/10.1016/j.wasman.2018.07.026.
- Balana, B. B., S. Sanfo, B. Barbier, T. Williams, and S. Kolavalli. 2019. Assessment of flood recession agriculture for food security in Northern Ghana: An optimization modeling approach. Agric. Syst. 173 (March):536–43. doi:https://doi.org/10.1016/j.agsy.2019.03.021.
- Bekiaris, G., S. Bruun, C. Peltre, S. Houot, and L. S. Jensen. 2015. “FTIR – PAS: A Powerful Tool for Characterising the Chemical Composition and Predicting the Labile C Fraction of Various Organic Waste Products.” Waste Management 39: 45–56. https://doi.org/https://doi.org/10.1016/j.wasman.2015.02.029
- Bouallagui, H., Y. Touhami, R. Ben Cheikh, and M. Hamdi. 2005. Bioreactor performance in anaerobic digestion of fruit and vegetable wastes. Process Biochem. 40 (3–4):989–95. doi:https://doi.org/10.1016/j.procbio.2004.03.007.
- Bowam, P. A., and M. T. Tierobaar. 2014. Characteristics and management of solid waste in Ghanaian markets - A study of WA municipality. Civil Environ. Res. 6 (1):114–19.
- Boyle, W. C. 1976. Energy recovery from sanitary landfills—A review. In Microbial energy conversion, ed. H. G. Schlegel and J. Barnea, 19–138. Oxford: Pergamon Press.
- Centre Technique Cuir Chaussure Maroquinerie (CTC). 2000. Waste generated in the leather products industry. 14th Session of the UNIDO Leather Products Industry Panel, Czech Republic.
- Chandrappa, R., and D. B. Das. 2012. Waste quantities and characteristics. Environ. Sci. Eng. (Subseries: Environ. Sci.) (9783642286803). doi:https://doi.org/10.1007/978-3-642-28681-0_2.
- Dahlbo, H., K. Aalto, H. Eskelinen, and H. Salmenperä. 2016. Increasing textile circulation — Consequences and requirements. Sustain. Prod. Consum. March. doi:https://doi.org/10.1016/j.spc.2016.06.005.
- den Boer, E., A. Jedrczak, Z. Kowalski, J. Kulczycka, and R. Szpadt. 2010. A review of municipal solid waste composition and quantities in Poland. Waste Manage. 30 (3):369–77. doi:https://doi.org/10.1016/j.wasman.2009.09.018.
- Denafas, G., T. Ruzgas, D. Martuzevičius, S. Shmarin, M. Hoffmann, V. Mykhaylenko, S. Ogorodnik, M. Romanov, E. Neguliaeva, A. Chusov, et al. 2014. Seasonal variation of municipal solid waste generation and composition in four East European cities. Resour. Conserv. Recycl. 89:22–30. doi:https://doi.org/10.1016/j.resconrec.2014.06.001.
- Edjabou, M. E., J. Møller, and T. H. Christensen. 2012. Solid waste characterization in Kétao, a rural town in Togo, West Africa. Waste Manage. Res. 30 (7):745–49. doi:https://doi.org/10.1177/0734242X12442741.
- Edwiges, T., L. Frare, B. Mayer, L. Lins, J. Mi, X. Flotats, M. Sarolli, and S. De Mendonça. 2018. Influence of chemical composition on biochemical methane potential of fruit and vegetable waste. Waste Manage. 71:618–25. doi:https://doi.org/10.1016/j.wasman.2017.05.030.
- Essumang, D. K. 2000. Effect of leachate from solid waste disposal site on Cape Coast Municipal environment, a thesis submitted to the Department of Chemistry, University of Cape Coast, Cape Coast, in partial fulfillment of the requirement for the award of a Master degree in philosophy (Chemistry).
- FAO. 2011. Continental programme on Post-Harvest Losses (PHL) reduction Ghana WORKING PAPER continental programme on Post-Harvest Losses (PHL) reduction rapid country needs assessment, 94.
- Fisgativa, H., A. Tremier, and P. Dabert. 2016. Characterizing the variability of food waste quality: A need for efficient valorization through anaerobic digestion. Waste Manage. 50 (February):264–74. doi:https://doi.org/10.1016/j.wasman.2016.01.041.
- Fobil, J. N., and N. A. Armah. 2005. “Evaluation of Municipal Solid Wastes (MSW) for Utilisation in Energy Production in Developing Countries Evaluation of Municipal Solid Wastes (MSW) for Utilisation in Energy Production in Developing Countries Derick Carboo,” no. January. https://doi.org/https://doi.org/10.1504/IJETM.2005.006508
- Ghana Statistical Service. 2012. “2010 Population and Housing Census, Ghana Statistical Service.” Accra-Ghana.
- Ghana Statistical Service. 2014. “2010 Population and Housing Census, District Analytical Report, Ghana Statistical Service.” 1–109.
- Gidarakos, E., G. Havas, and P. Ntzamilis. 2006. Municipal solid waste composition determination supporting the integrated solid waste management system in the island of Crete. Waste Manage. 26 (6):668–79. doi:https://doi.org/10.1016/j.wasman.2005.07.018.
- Gómez, G., M. Meneses, L. Ballinas, and F. Castells. 2009. Seasonal characterization of Municipal Solid Waste (MSW) in the city of Chihuahua, Mexico. Waste Manage. 29 (7):2018–24. doi:https://doi.org/10.1016/j.wasman.2009.02.006.
- Hussain, F., M. N. Chaudhry, and S. A. Batool. 2014. “Assessment of Key Parameters in Municipal Solid Waste Management: A Prerequisite for Sustainability.” International Journal of Sustainable Development and World Ecology 21 (6):519–25. https://doi.org/https://doi.org/10.1080/13504509.2014.971452
- Jnr, A. K., D. Yunana, P. Kamsouloum, M. Webster, D. C. Wilson, and C. Cheeseman. 2018. Recycling waste plastics in developing countries : Use of low-density polyethylene water sachets to form plastic bonded sand blocks. Waste Manage. 80:112–18. doi:https://doi.org/10.1016/j.wasman.2018.09.003.
- Kamran, A., M. N. Chaudhry, and S. A. Batool. 2015. Effects of socioeconomic status and seasonal variation on municipal solid waste composition: A baseline study for future planning and development. Environ. Sci. Europe 27 (1). doi: https://doi.org/10.1186/s12302-015-0050-9.
- Kitinoja, L., and A. A. Kader. 2015. Measuring postharvest losses of fresh fruits and vegetables in developing countries. Postharvest Edu. Found. February 1–26. doi:https://doi.org/10.13140/RG.2.1.3921.6402.
- Kumar, A., S. R. Samadder, N. Kumar, and C. Singh. 2018. Estimation of the generation rate of different types of plastic wastes and possible revenue recovery from informal recycling. Waste Manage. 79:781–90. doi:https://doi.org/10.1016/j.wasman.2018.08.045.
- Li, Y., R. Zhang, G. Liu, C. Chen, Y. He, and X. Liu. 2013. Comparison of methane production potential, biodegradability, and kinetics of different organic substrates. Bioresour. Technol. 149:565–69. doi:https://doi.org/10.1016/j.biortech.2013.09.063.
- Lim, L. Y., J. J. Klemeš, C. S. Ho, W. S. Ho, C. T. Lee, and C. P. C. Bong. 2017. The characterization and treatment of food waste for improvement of biogas production during anaerobic digestion – A review. J. Clean. Prod. 172:1545–58. doi:https://doi.org/10.1016/j.jclepro.2017.10.199.
- Liu, C., J. Wang, X. Ji, H. Qian, L. Huang, and X. Lu. 2016. The biomethane producing potential in China: A theoretical and practical estimation. Chin. J. Chem. Eng. 24 (7):920–28. doi:https://doi.org/10.1016/j.cjche.2015.12.025.
- Lopez, V. M., F. B. De La Cruz, and M. A. Barlaz. 2016. Chemical composition and methane potential of commercial food wastes. Waste Manage. 56:477–90. doi:https://doi.org/10.1016/j.wasman.2016.07.024.
- Lou, X. F., J. Nair, and G. Ho. 2013. Potential for energy generation from anaerobic digestion of food waste in Australia. Waste Manage. Res. 31 (3):283–94. doi:https://doi.org/10.1177/0734242X12474334.
- Masó, M. A., and A. B. Blasi. 2008. Evaluation of composting as a strategy for managing organic wastes from a municipal market in Nicaragua. Bioresour. Technol. 99 (11):5120–24. doi:https://doi.org/10.1016/j.biortech.2007.09.083.
- Masebinu, S. O., E. T. Akinlabi, E. Muzenda, A. O. Aboyade, and C. Mbohwa. 2018. Experimental and feasibility assessment of biogas production by anaerobic digestion of fruit and vegetable waste from Joburg Market. Waste Manage. 75:236–50. doi:https://doi.org/10.1016/j.wasman.2018.02.011.
- Miezah, K., K. Obiri-Danso, Z. Kádár, B. Fei-Baffoe, and M. Y. Mensah. 2015. Municipal solid waste characterization and quantification as a measure towards effective waste management in Ghana. Waste Manage. 46:15–27. doi:https://doi.org/10.1016/j.wasman.2015.09.009.
- Mohan, S. V., G. Mohanakrishna, R. K. Goud, and P. N. Sarma. 2009. Acidogenic fermentation of vegetable-based market waste to harness biohydrogen with simultaneous stabilization. Bioresour. Technol. 100 (12):3061–68. doi:https://doi.org/10.1016/j.biortech.2008.12.059.
- Monney, I., B. M. Tiimub, and H. C. Bagah. 2013. Characteristics and management of household solid waste in urban areas in Ghana: The case of WA. Civil Environ. Res. 3 (9):10–21. http://www.iiste.org/Journals/index.php/CER/article/view/7026.
- Oduro-kwarteng, S., T. Kumasi, and I. Monney. 2014. Characteristics of diverted solid waste in Kumasi : A Ghanaian City Characteristics of diverted solid waste in Kumasi : A Ghanaian city. February 2015. doi:https://doi.org/10.11648/j.ajep.20140305.13.
- Ofori-Boateng, C., K. T. Lee, and M. Mensah. 2013. The prospects of electricity generation from municipal solid waste (MSW) in Ghana: A better waste management option. Fuel Process. Technol. 110:94–102. doi:https://doi.org/10.1016/j.fuproc.2012.11.008.
- Okot-okumu, J. 2012. World’s largest science, technology & medicine open access book publisher solid waste management in African cities – East Africa. Open Sciences INTECH, 1–19. http://www.intechopen.com/books/waste-management-an-integrated-vision
- Okot-Okumu, J., and R. Nyenje. 2011. Municipal solid waste management under decentralization in Uganda. Habitat Int. 35 (4):537–43. doi:https://doi.org/10.1016/j.habitatint.2011.03.003.
- Pagliaccia, P., A. Gallipoli, A. Gianico, F. Gironi, D. Montecchio, C. Pastore, C. M. Braguglia, and C. M. Braguglia. 2019. Variability of food waste chemical composition : Impact of thermal pre-treatment on lignocellulosic matrix and anaerobic biodegradability. J. Environ. Manage. 236 (January):100–07. doi:https://doi.org/10.1016/j.jenvman.2019.01.084.
- Palaiogeorgou, A., N. Kopsahelis, C. M. De, and D. M. Guimar. 2017. Valorization of fruit and vegetable waste from open markets for the production of 2,3-butanediol. Food Bioprod. Process. doi:https://doi.org/10.1016/j.fbp.2017.10.004.
- Paode, R. D., J. I. Liu, and T. M. Holsen. 1996. “Modeling the Energy Content of Municipal Solid Waste Using Multiple Regression Analysis.” Journal of the Air and Waste Management Association 46 (7):650–56. https://doi.org/https://doi.org/10.1080/10473289.1996.10467499
- Pecorini, I., F. Baldi, E. Antonio, and A. Corti. 2016. Biochemical methane potential tests of different autoclaved and microwaved lignocellulosic organic fractions of municipal solid waste. Waste Manage. 56:143–50. doi:https://doi.org/10.1016/j.wasman.2016.07.006.
- Rafiee, A., E. Gordi, W. Lu, Y. Miyata, H. Shabani, S. Mortezazadeh, and M. Hoseini. 2018. The impact of various festivals and events on recycling potential of municipal solid waste in Tehran, Iran. J. Clean. Prod. 183:77–86. doi:https://doi.org/10.1016/j.jclepro.2018.02.118.
- Rogoff, M. J., and F. Screve. 2019. Solid waste composition and quantities. Waste-To-energy 57–73. doi:https://doi.org/10.1016/b978-0-12-816079-4.00004-9.
- Romero-Cedillo, L., H. M. Poggi-Varaldo, T. Ponce-Noyola, E. Ríos-Leal, A. C. Ramos-Valdivia, C. M. Cerda-García Rojas, and J. Tapia-Ramírez. 2017. “A Review of the Potential of Pretreated Solids to Improve Gas Biofuels Production in the Context of an OFMSW Biorefinery.” Journal of Chemical Technology and Biotechnology. https://doi.org/https://doi.org/10.1002/jctb.5116
- Saidan, M. N., A. A. Drais, and E. Al-Manaseer. 2017. Solid waste composition analysis and recycling evaluation: Zaatari Syrian Refugees Camp, Jordan. Waste Manage. 61:58–66. doi:https://doi.org/10.1016/j.wasman.2016.12.026.
- Senthil, R., and T. Hemalatha. 2014. Recycling of finished leather wastes : A novel approach. doi:https://doi.org/10.1007/s10098-014-0776-x.
- Shi, G., M. Zhong, Y. Liu, Y. Xie, D. Zeng, Y. Fei, Y. Zhang, Q. Li, and Z. Han. 2017. Influencing factors of domestic waste characteristics in rural areas of developing countries. Waste Manage. 72:45–54. doi:https://doi.org/10.1016/j.wasman.2017.11.039.
- Solomon, A. O. 2011. The role of households in solid waste management in East Africa capital cities. Environ. Policy 4. doi:https://doi.org/10.3920/978-90-8686-747-9.
- Tulashie, S. K., E. K. Boadu, F. Kotoka, and D. Mensah. 2020. Plastic wastes to pavement blocks: A significant alternative way to reducing plastic wastes generation and accumulation in Ghana. Constr. Build. Mater. 241:118044. doi:https://doi.org/10.1016/j.conbuildmat.2020.118044.
- UNEP. 2013. Municipal solid waste comparative analysis study in Juba, South Sudan, United Nations Environmental Program. Retrieved 27th March, 2019 from http://unep.org/SouthSudan/.
- Yang, N., A. Damgaard, C. Scheutz, L. M. Shao, and P. J. He. 2018. “A Comparison of Chemical MSW Compositional Data between China and Denmark.” Journal of Environmental Sciences (China) 74:1–10. https://doi.org/https://doi.org/10.1016/j.jes.2018.02.010