
 ?Mathematical formulae have been encoded as MathML and are displayed in this HTML version using MathJax in order to improve their display. Uncheck the box to turn MathJax off. This feature requires Javascript. Click on a formula to zoom.
ABSTRACT
Bilge water waste poses an environmental risk for humans and marine creatures by causing cancer and developmental disorders due to the toxic substances. This study aims to create a calculation method to calculate the amount of bilge that a ship can produce. The number of ships and the amount of bilge water that they have given the port waste reception facilities in the past years were collected to prevent marine pollution caused by ships in the Gulf of Antalya. The amount of possible future bilge water discharge in the gulf was estimated by using the collected data by linear regression method. The risk distribution of the amount of bilge water that a ship can produce was determined with the data obtained by the Monte Carlo method for the first time in this study. As a result, although the number of ships in the gulf will decrease in number, it is predicted that the amount of bilge water discharge and the needs of a waste receptions facility will increase in the coming years. It is found that the amount of bilge water that a ship can generate will vary in 0.78–3.16 m3, and this data can apply to every ship type. Since the calculation method used in this study can be used for each region with all ship types in calculating the amount of bilge waste a ship can produce, it ensures that the inspections made are more effective. Thus, the management of wastes originating from ships can be effectively and adequately implemented by those who carry out wastes, and marine pollution from ships can be prevented.
Implications: Bilge water waste poses an environmental risk for humans and marine creatures by causing cancer and developmental disorders due to the toxic substances. So, It’s crucial to manage bilge water waste properly. This study creates a calculation method to calculate the bilge water waste that a ship can produce for applying bilge water waste management. When the studies on the amount of bilge water being discharged into the sea, it is seen that the amount of bilge water that a ship can generate is identified for ships with certain characteristics. However, since the amount of bilge a ship can produce depends on many factors such as engine power, cruise time, and ship’s age, these data are insufficient and not usable because it is difficult to predict the type and number of ships in the coming years. This calculation model is simulated most realistically with the calculation to make with the linear regression and Monte Carlo method used for the first time in this study.
Introduction
Bilgewater accumulated in ships is heterogeneous waste consisting of fuel, hydraulic oils, solvents, and lubricating oils resulting from machine leaks and cleaning agents from washing processes. Annual bilge water discharge from ships into seas reaches 16,730 tons globally (NRC Citation2003).
When bilge water is discharged into a sea, it may result in severe damage by creating severe risks to marine life, terrestrial life, human health, and natural resources (Camphuysen and Heubeck Citation2001; NRC Citation2003; Olorunfemi, Duru, and Olorunfemi Citation2015; Radovic et al. Citation2012; Tiselius and Magnusson Citation2017).
Tiselius and Magnusson (Citation2017), in their study, determined that although the variables responsible for the negative effects of bilge waters could not be determined exactly, ecologically, discharge of bilge water from passenger ferries to the sea would create toxic effects for zooplankton and microbial communities in the surrounding waters. They also determined to reduce the adverse effects of bilge waters on the plankton ecosystem, and it is necessary to prevent the further discharge of surfactants into the sea via the bilge water.
Ninety-five percent of imports and 78% of exports in Turkey are seaborne. The average number of ships arriving at the ports during 2007–2018 is 75,000 (Republic of Turkey Ministry of Transport and Infrastructure (TMOTI) Citation2021). An increase in sea trade also increases the risk for the amount of future bilge water discharge.
Because the time and amount of the ships bilge water discharges are uncertain, sampling should also be random. The Monte Carlo risk assessment method that considers this factor can generate risk probability distributions for each variable. In the method, repetitive sampling of the probability distributions of each variable is performed (Rausand Citation2013). In the environmental risk model, the Monte Carlo method, based on statistics and probability theory, is used to eliminate uncertainty caused by random sampling and estimate the distribution of heavy metal concentrations in the following years (Qu et al. Citation2018).
Just as the Monte Carlo method, Bayesian statistics is an efficient methodology for elucidating a relationship between two variables, even though only a small amount of information is available. (Motoyoshi and Nishi Citation2020). Significant results have been accomplished by utilizing the Bayesian Compound Poison model method in the Baltic Sea to identify and estimate the ecological and environmental threats of petroleum and its derivatives. (Magnusson et al. Citation2018). Furthermore, numerous risk assessment studies have been conducted through environmental matching and species-specific methods in ballast water risk assessment (David, Gollasch, and Leppäkoski Citation2013); however, the Monte Carlo method has not been used in such studies.
With the multiple linear regression method; The R2 value determining the reliability rate in estimating chlorophyll and its concentration in coastal ecosystems is 84.8% (Franklin et al. Citation2020); the R2 value for engine power effect estimation on ship gas emissions is 85% (Lee et al. Citation2020); the R2 value ranged from 76% to 93% to estimate the heavy metals in marine sediment (Zhou, Guo, and Liu Citation2007).
In the study of calculating the risk of plastic waste pollution on ecological diversity in the Mediterranean region, which has gained importance in recent years, the linear regression method was used to estimate the exposure risk of 84 species (Compa et al. Citation2019).
The basic principle in the Monte Carlo method is to make simulations for the estimation of risks depending on randomly selected values from the probability distributions of the input parameters with uncertainty. Thus, the data obtained with the input parameters defined as probability distributions appear as probability distributions and can be evaluated (Ang and Tang Citation1984). It is seen that the linear regression method used in the calculation of the bilge water that a ship can produce, and the Monte Carlo Method, which takes this method into account, is a reliable and standard method used in similar studies on marine and environmental pollution.
When the studies on the amount of bilge water being discharged into the sea that has many effects on the environment and human health are examined, it is seen that the amount of bilge water that a ship can generate is identified for ships with certain characteristics ().
In a study on the production of bilge waste from fishing boats, they reported that the discharge of bilge water from fishing boats to the sea might be an essential source of chronic oil pollution in the coastal region of Thailand (Lin, Lin, and Jong Citation2007). Larger ships were not considered in their work. Similarly, on vessels shorter than 20 meters or yachts, in work by Fletcher et al. (Citation2017), the content of bilge water samples taken from 30 small ships was evaluated using traditional analysis methods. They stated that the diversification of the sampled boat types and sizes, the risks that will arise in terms of ship-borne waste can be calculated based on more robust data, and navigational information for different ship types should be calculated to determine the dimensional risk scales and how to manage them in the best way. They carried out a study on bilge water amount considering boats/yachts in specific sizes.
When the studies on the bilge water mentioned in Table-3 are examined, it is seen that the amount of bilge waste that a ship can produce is determined by using the data of port waste reception facilities or sampling from ships with specific characteristics. In addition, the amount of bilge waste produced by a ship with 10,000 HP engine power was determined, as an example for ships with only particular features. Therefore, studies (Table-3) are insufficient to determine the amount of bilge waste for each ship type. Linear regression and Monte Carlo methods, used together for the first time in this study to calculate the amount of bilge water, can apply to every region, port, or ship type. Thus, with this calculation method, waste reception facility requirements can determine quickly for the future.
In a study by Ulnikovic, Vukic, and Nikolic (Citation2012), on the estimation of the amount of bilge waste that may occur due to ship traffic, the necessary information about the ship traffic, ship types and numbers, and the number of berthings at the port were obtained from the surveys made to the ship owners and the interviews with the researchers.
This study aims to determine the risk distribution for the amount of bilge water discharge in the Gulf of Antalya in the coming years by the Monte Carlo method. With the data obtained, it is envisaged to determine the needs of the waste reception facility in Antalya to reduce the risk for bilge water discharge. In addition, with the proposed calculation model, waste reception facility needs at other ports and for strict control of ships’ bilge waste can also be determined.
Material and methods
In this section, the process of how the linear regression and Monte Carlo methods are used while estimating the risks for the amount of bilge water generated by a ship in the Gulf of Antalya is explained. Moreover, the number of ships arriving in the gulf in previous years that are used in the study and the amount of bilge water they generated are presented.
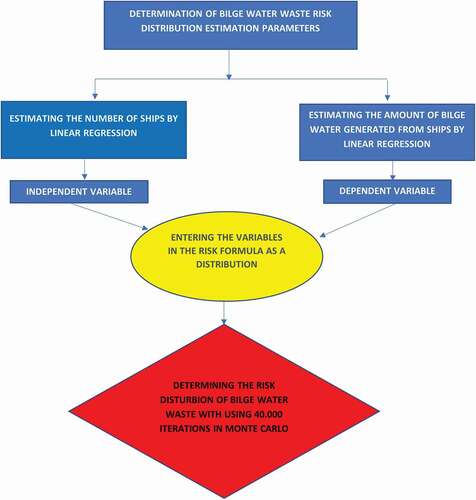
In this study, bilge water waste risk is calculated in two stages. In the first phase, the number of ships that will come to Antalya Bay and the amount of bilge waste generated accordingly was estimated with the linear regression method.
We determined the risk distribution of the amount of bilge that a ship can produce was with Monte Carlo simulation by selecting the estimated amount of bilge as the dependent variable and the number of ships as the independent variable. The flow diagram of the estimation model used in the study is given in .
Figure 1. Determining the bilge water waste risk model flow diagram
Study area
The coastal length of Antalya province, extending from Eşen Stream in the west to Kaledron (Kaldıran) Stream in the east, is 640 km. With such length, it constitutes 40% of the Mediterranean Region coastal line. The region covering the city center of Antalya, housing a population of approximately 2.5 million, is in the status of a tourism center to a certain extent. There is a “fisherman port” and a “harbor” that houses cargo ships, cruise ships, and a marina among the coastal structures within the area. There is a filling facility on the shore transported by oil pipelines. The world-famous Konyaaltı beach is one of the recreational areas for public use in the coastal region. (Antalya Provincial Directorate of Culture and Tourism Citation2019).
The Antalya port is among the top 10 ports where the most cargo is handled (Republic of Turkey Ministry of Transport and Infrastructure (TMOTI) Citation2021).
Determining the number of ships sailing in the gulf of Antalya
Fleetmon (Citation2019) supported the data that 437 ships over 100 m in length sailed in the Gulf of Antalya in 2018. In this study, the number of ships arriving in the Gulf of Antalya during 2013–2020 has been taken from the Republic of Turkey Ministry of Transport and Infrastructure reports and presented in (Republic of Turkey Ministry of Transport and Infrastructure (TMOTI) Citation2021). As seen in , the data from 2011 were used since there were no records in the years before 2013.
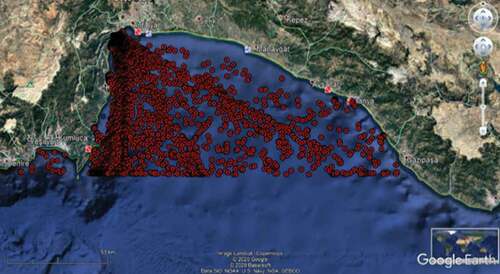
The number of ships in the coming years is estimated by the linear regression method using the data as mentioned above. Traces and density map of the ships sailing in the Gulf of Antalya in 2018 are shown in .
Figure 2. Traces and density map of the ships sailing in Gulf of Antalya in 2018
Linear regression Analysis
Linear regression models provide predictions for the future as they present an easy-to-interpret mathematical formula that can generate predictions.
With the data obtained from the study, regression analysis was performed to examine the relationship between a dependent variable and one or more independent variables. The performed regression analysis enabled us to figure out the relationship between the number of ships and the generated bilge water amount as dependent variables and varying years as independent variables; dependency of the relationship; and future predictions for the dependent variable.
In the studies conducted by Magnusson et al. (Citation2018) and Motoyoshi and Nishi (Citation2020) with Bayes, the probabilities for a single situation in one of the variables were determined, and in this case, since predictions could not be made for other situations, the results included the limited cases. However, via the linear regression method used in this study, the estimates were calculated as a distribution by considering all possibilities for the values, and the risk was determined as a distribution with the Monte Carlo method.
Calculation of ship sourced bilge water amount
The studies for the calculation of bilge water amount that a ship can generate considering the factors such as machine power, loading capacity, and ship type are summarized in . According to the literature summarized, it is observed that the amount of bilge water calculated as per the ship type and tonnage varies between 0.01 and 50 m3. The regression equation used for the calculation of bilge water amount is given below:
where, “x” indicates the bilge water amount varying through the years, “y” the estimated number of ships as per the selected bilge water amount and 1061.6 indicates the point where the line intersects with the ordinate axis, and 225.07 indicates the slope of the line. This equation was obtained from the estimation calculations made using the linear regression feature in the Microsoft Excel program.
There are a total of 21 port waste reception facilities in the Gulf of Antalya. The total amount of bilge water received by these waste reception facilities was 1604.73 m3 in 2018 and 1813.13 m3 in 2019. Ninety-nine percent of this waste amount was received by the Port Akdeniz Antalya Port Authority. The amount of bilge water waste versus years collected by Port Akdeniz Antalya Port Authority is presented in . These data were obtained from the Antalya Provincial Directorate of Environment. As seen in , since no records were kept in the years before 2013, the data from 2011 were used. The regression equation used for the calculation of the number of ships by Linear Regression is given below:
where, “x” indicates the bilge water amount varying through the years, “y” indicates the estimated bilge water amount as per the selected bilge water amount, and 1814.9 indicates the point where the line intersects with the ordinate axis and −123.52indicates the slope of the line. This equation was obtained from the estimation calculations made using the linear regression feature in the Microsoft Excel program.
Table 1. Number of ships arriving in the Gulf of Antalya in 2013–2020
Table 2. Amount of bilge water collected at the Antalya port in terms of years
Table 3. Studies on the amount of bilge water that ships can generate
Monte carlo risk assessment method
One of the methods used in risk assessment is the Monte Carlo method. The Monte Carlo method is widely used in environmental risk assessment (Safadi, Adrot, and Flaus Citation2015). Compared with the deterministic method, the Monte Carlo method provides a range estimation and a better understanding of the environmental behavior and uncertainties of pollutants (Cao et al. Citation2017; Koupaie and Eskicioğlu, Citation2015; Mari et al. Citation2009). Therefore, the Monte Carlo method has become common in environmental health and safety risk assessments in recent years.
It has been stated by the Environmental Protection Agency (EPA) that the primary purpose of the Monte Carlo method in environmental impact risk assessment is to characterize and quantify the uncertainty and variability in exposure or risk estimates (EPA (Enivronmental Protection Agency) Citation1997).
When conducting risk assessment, the amount of bilge taken from the ship arriving at the port will vary according to the type and size of the ship (Burgman Citation2005).
When the number of ships coming into the Gulf of Antalya is examined, it is observed that the number of ships to come next year is very variable. Therefore, the possibility of bilge water discharge from ships is also an uncertain random event.
Monte Carlo Simulation is the most widely used method in the literature on uncertainty. In this method, parameters are defined by probability distributions instead of a single value. In engineering analysis, the Monte Carlo method evaluates environmental uncertainties (Yegnan, Williamson, and Graettinger Citation2002).
In this study, as specified in the literature, the Monte Carlo method, being the best method to assess the risks for random and uncertain events, was used. Monte Carlo simulation was performed using Oracle Crystal Ball loaded in Microsoft Excel to run 40.000 times to obtain risk distribution outputs. The risk equation used for the calculation of bilge water amount risk distribution is given below:
where “SBWR” indicates ship bilge water risk distribution, “BW” indicates bilge water waste amount distribution that may produce by ship in a certain sea area in the coming years, “S” indicates the distribution of the number of ships that may come to a certain sea area in the coming years, and “i” indicates the estimated years.
Results
In this section, the risk for the amount of bilge water generated by a ship in the Gulf of Antalya is calculated using the linear regression and Monte Carlo methods. Further, the formulas used in the performed calculations are presented.
Estimating the amount of bilge water generated from ships by linear regression
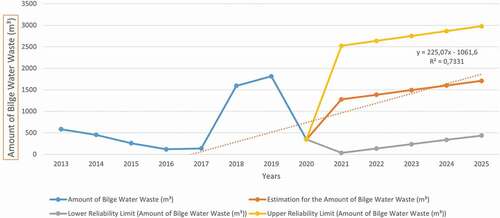
Ninety-nine percent of the bilge water waste in the Gulf of Antalya during 2021–2025 will be collected by the Port Akdeniz Antalya Port Authority. Using the data on the amount of collected bilge water waste by this port authority during 2013–2020, the amount that may occur in 2021–2025 is estimated by the linear regression method in Microsoft Excel and presented in .
Table 4. Estimated amount of bilge water waste in the Gulf of Antalya in coming years
The equation and diagram of the linear regression analysis performed for the estimation of bilge water waste are shown in . Considering the R2 value that is the correlation coefficient of performed linear regression, it shows that the bilge water waste values estimated to be 0.7331 are meaningful.
Figure 3. The estimated amount of bilge water waste in the Gulf of Antalya in the coming years calculated by linear regression
Estimating the number of ships by linear regression
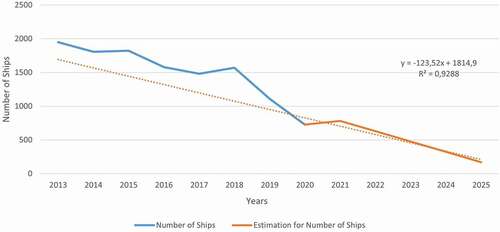
The number of ships that will arrive in the Gulf of Antalya between 2021 and 2025 has been estimated by the linear regression method using the data on the number of ships that arrived during 2013–2020 years and presented in . In conclusion of the performed linear regression analysis in Microsoft Excel, it is observed that the number of ships in Antalya will decrease over the years. Accordingly, the estimated number of ships between 2020 and 2025 will reduce by 1.6–21.7%, while the change in bilge waste will increase between 6.5–20%.
Table 5. Estimation of the number of ships coming into the Gulf of Antalya
The main reason for the decrease in the number of ships is that with the developing technology, more cargo can be transported on the new generation ships, and therefore, it is expected that the amount of bilge water that the ships generate will not change dramatically since the size of the ships and their machine power will increase respectively. The equation and diagram of the linear regression analysis performed for the estimation of the number of ships are shown in . Considering the R2 value that is the correlation coefficient of the performed linear regression, it is approximately 1; therefore, the estimated number of ships is 93% accurate. In the study conducted on the marine accident risk model for the leakage amount, the number of ships that will arrive in the Gulf of Antalya in the coming years was estimated by the linear regression method, and it was stated that the number would increase by approximately 80 ships annually (Küçükosmanoğlu Citation2008).
Figure 4. Number of ships that may come into the Gulf of Antalya by linear regression
Determination of the risk distribution of bilge water waste generated from a ship by the monte carlo method
Using the designated probability of bilge water formation and the number of ships distribution, it is aimed to model the actual sea conditions as close to reality, and the risk distribution of bilge water formation in the Gulf of Antalya was generated by 40.000 × 40.000 affinity simulations by the Monte Carlo method.
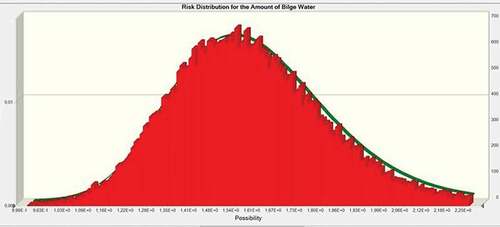
Through the Monte Carlo simulation, determining the risk distribution for the amount of bilge water that a ship could generate in the Gulf of Antalya during 2021–2025 is aimed, and it is assessed that the risk distribution is a normal distribution. According to the risk distribution calculated for the Gulf of Antalya, it is found that the amount of bilge water that a ship can generate will vary in0.78–3.16 m3, where its standard deviation and mean are 0.24 and 1.60, respectively. The risk distribution of the Monte Carlo simulation is shown in .
Figure 5. Risk distribution for the amount of bilge water
The probability distributions for the number of ships and amount of bilge water by years are calculated and presented in . It is observed that the standard deviation for the number of ships is found as 206.82, whereas the standard deviation for the bilge water amount is found as 275.63 m3.
Table 6. Estimations for the number of ships coming into the Gulf of Antalya and bilge water amount
Discussion
In this study, it is determined that the amount of bilge water that a ship can generate in the Gulf of Antalya will vary between 0.78 and 3.16 m3. Using this data, the amount of bilge water waste to be received by the waste reception facility as per the number of ships can be calculated, and legal regulations can be made to impose penal sanctions if the received amount of bilge water waste is less than the determined amount, and therefore, it will be possible to prevent ships originated marine pollution. In addition, it is assessed that the amount of bilge water waste in the Gulf of Antalya within the next years will vary between 196.84– 2401.63 m3 (), and the existing waste reception facilities will be sufficient as they are currently.
Examining the studies in the literature on the amount of bilge water a ship can generate, it is seen that they are based on the ship’s tonnage and machine power ().
Regarding the bilge water production of fishing boats, Lin, Lin, and Jong (Citation2007) and on ships and yachts less than 20 meters Fletcher et al. (Citation2017) tried to determine the amount of bilge waste that may occur with the bilge waters taken from 30 small ships. Regarding the estimation of the amount of bilge waste that may be produced by ships, Ulnikovic, Vukic, and Nikolic (Citation2012) obtained the information from the questionnaires made to the ship owners and the interviews with the researchers. In the other studies in , the amount of bilge waste calculated, with engine power (NRC Citation2003; Andersson et al. Citation2016.; Kallel et al. Citation2017), size of ships (De Osés Citation2006), and ship types (Onwuegbuchunam et al. Citation2017). But the calculation model created in this study is suitable for every ship type. There is no study found available on the amount of bilge water that may occur in the Gulf of Antalya.
The calculation model created in this study is suitable for every ship type. No research has been found in the scanned literature, and the estimation of the amount of bilge water is related to this calculation model in Antalya Bay.
Future predictions can be made by the multiple linear regression method using seawater quality index values (Samsudina et al. Citation2019), and since the R2 value (0.7113) is approximately 1, estimation accuracy becomes 71%. Mu et al. (Citation2018) used the linear regression method to estimate the toxicity of metals in coastal seas and found the R2 value as 0.987. Considering the found R2 value in the present study, derived with a similar method for estimating the amount of bilge water that may occur in the gulf, it is observed that it is approximately 1. Consequently, the estimations for the number of ships are 87% accurate.
In a study carried out in the Klaipeda port, it is found that bilge water constitutes 73% of ship sourced wastes and amounts to 10,609 m3 for 2008 (Dvarioniene et al. Citation2013). However, the bilge waste estimated to be generated in Antalya port for 2021 was calculated as 1270 m3. Although there is a twelve-year difference between the data, it appears to be 100 times greater at the port of Klaipeda.
Although the Gulf of Alaska is also situated in a critical region, it is stated as 1800–7200 m3 per year in a study on the amount of bilge water waste generated by cruise ships (Alaska Department of Environmental Conservation Citation2000). Although the amount of bilge water waste in the Gulf of Antalya is low, considering the tanker traffic, it should be considered as a critical and risky region.
In the study carried out by the Monte Carlo method for modeling the discharge of bilge water from ships into the sea, bilge water samples were taken according to the ship types and age of the ship, and it was revealed that container ships generated a high amount of bilge water (Motoyoshi and Nishi Citation2020). The risk distribution for the amount of bilge water that a ship can generate is calculated by the Monte Carlo method for the first time in this study, and it is contributed to the literature.
In summary, when the studies on the amount of bilge water generated by a ship are examined, it is observed that the calculations are generally made as per the ship types, and there is no study available for determining the amount of bilge water that may occur in future periods for a particular sea area. It is thought that with this study, risk assessment for bilge water will contribute to the determination of future needs and for strict control.
When examining other studies on bilge water waste in the literature, the amount of bilge that the ship can produce is given as a single value. However, since the amount of bilge a ship can produce depends on many factors such as engine power, cruise time, and ship’s age, these data are insufficient and not usable. Because it is difficult to predict the type and number of ships in the coming years, this estimation used in this study has been simulated as closely as possible by the calculation to be made with the linear regression and Monte Carlo method used for the first time.
Conclusion
This study determined that the amount of bilge waste that a ship can produce varies between 0.78–3.16 m3. However, the amount of bilge waste originating from excursions and fishing boats that are stationary at the ports and making cabotage in Antalya Bay was not calculated. The calculated risk of bilge water amount only covers the ships longer than 100 meters and the ships coming from outside of Antalya Bay. Therefore, in Antalya Bay, it is expected that more bilge waste will be produced by ships than the amount of bilge water waste calculated in this study.
In addition, by diversifying the sample boat types and sizes and adding navigational information for ship types in future studies, it will be possible to calculate the risks of ship-borne waste based on more robust data. The data obtained from this study will determine the risk of bilge water waste in terms of human and environmental health in future studies, supported by measurements and analyses to be made in seawater and on the ship. It is of great importance to keep accurate records in the control and inspection of the amount of bilge water. For example, there is no clear information in any source on how much waste is received by a waste reception facility from each ship. The illegal discharge of bilge water into the sea can be prevented by conducting inspections at the waste reception facilities and determining their needs using the calculation model created in this study. Ensuring clean seas with safe ships will only be possible by strict control and enforcement.
Acknowledgment
Ship movement information in 2018 in the Gulf of Antalya was provided by Fleetmon.
Disclosure statement
No potential conflict of interest was reported by the author(s).
Additional information
Notes on contributors
Ömer Harun Özkaynak
Ömer Harun Özkaynak is a Ph.D. candidate at Environmental Engineering at the Akdeniz University. Research area: Marine Pollution, risk assessment, and management.
Gönül Tuğrul İçemer
Gönül Tuğrul İçemer is Ph.D., an associate professor at Environmental Engineering at the Akdeniz University. Research area: Environmental Microbiology, Marine Biology, Marine Protected Areas, Marine Pollution.
References
- Alaska Department of Environmental Conservation. 2000. alaska cruise ship initiative Part 1 final report. Juneau: Alaska Department of Environmental Conservation (ADEC).
- Andersson, K., S. J. Brynolf, F. Lindgren, and M. Wilewska-Bien. 2016. Shipping and the environment, 434. Berlin, Heidelberg.: Springer.
- Ang, A. H. S., and W. H. Tang. 1984. Probability concepts in engineering planning and design. Vol. 2 of Decision, risk, and reliability, 608. John Wiley & Sons, Inc., 605 THIRD AVE., NEW YORK, NY 10158, USA
- Antalya Provincial Directorate of Culture and Tourism. 2019. Antalya from yesterday to today. Vol. 1. Part 2. Antalya: Geographical Situation.
- Burgman, M. 2005. Risks and decisions for conservation and environmental management. UK: Cambridge University Press.
- Camphuysen, C. J., and M. Heubeck. 2001. Marine oil pollution and beached bird surveys: The development of a sensitive monitoring instrument. Environ. Pollut. 112 (3):443–61. doi:https://doi.org/10.1016/S0269-7491(00)00138-X.
- Cao, S., X. Duan, Y. Ma, X. Zhao, Y. Qin, Y. Liu, S. Li, B. Zheng, and F. Wei. 2017. Health benefit from decreasing exposure to heavy metals and metalloid after strict pollution control measures near a typical river basin area in China. Chemosphere 184:866–78. doi:https://doi.org/10.1016/j.chemosphere.2017.06.052.
- Caric, H. 2016. Challenges and prospects of valuation-cruise ship pollution case. J. Clean. Prod. 111:487e498. doi:https://doi.org/10.1016/j.jclepro.2015.01.033.
- Compa, M., C. Alomar, C. Wilcox, E. V. Sebille, L. Lebreton, B. D. Hardesty, and S. Deudero. 2019. Risk assessment of plastic pollution on marine diversity in the Mediterranean Sea. Science of the Total Environment 678:188–96. doi:https://doi.org/10.1016/j.scitotenv.2019.04.355.
- David, M., S. Gollasch, and E. Leppäkoski. 2013. Risk assessment for exemptions from ballast water management - The Baltic Sea case study. Journal of Marine Pollution Bulletin 75 (1–2):205–17. doi:https://doi.org/10.1016/j.marpolbul.2013.07.031.
- De Osés, F. X. M. 2006. Analysis of oil pollution at sea by means of sea craft in Spain. Department of Nautical Engineering and Science, Technical University of Catalonia, Spain.
- Dvarioniene, J., G. Zobe, N. Laite, J. Kruopiene, and Z. Stasiskiene. 2013. Application of the life-cycle assessment method for pollution prevention in Klaipeda Sea Port, Lithuania. J. Coast. Res. 29 (5):1083–91. doi:https://doi.org/10.2112/JCOASTRES-D-11-00167.1.
- EMSA (The European Maritime Safety Agency). 2016. The Management of Ship-Generated Waste On-board Ships report.
- EPA (Enivronmental Protection Agency) 1997. guiding principles for monte carlo analysis. https://www.epa.gov/sites/production/files/2014-11/documents/montecar.pdf
- Fleetmon. 2019. Ships sailing report in the Gulf of Antalya in 2018. Germany.
- Fletcher, L. M., A. Zaiko, J. Atalah, I. Richter, C. M. Dufour, X. Pochon, … G. A. Hopkins. 2017. Bilge water as a vector for the spread of marine pests: A morphological, metabarcoding and experimental assessment. Biol. Invasions 19 (10):2851–67. doi:https://doi.org/10.1007/s10530-017-1489-y.
- Franklin, J. B., T. Sathish, N. V. Vinithkumar, and R. Kirubagaran. 2020. A novel approach to predict chlorophyll-a in coastal-marine ecosystems using multiple linear regression and principal component scores. Mar. Pollut. Bull. 152:110902. doi:https://doi.org/10.1016/j.marpolbul.2020.110902.
- Kallel, A., M. Ksibi, H. B. Dhia, and N. Khélifi. 2017. Recent advances in environmental science from the euro-mediterranean and surrounding regions, proceedings of euro-mediterranean conference for environmental integration (EMCEI-1), 1759. Tunisia: Springer.
- Koupaie, E. H., and C. Eskicioglu. 2015. Health risk assessment of heavy metals through the consumption of food crops fertilized by biosolids: A probabilistic-based analysis. J. Hazard. Mater. 300:855–65. doi:https://doi.org/10.1016/j.jhazmat.2015.08.018.
- Küçükosmanoğlu, A. 2008. Research of the spill quantity by the sea accident risk model (MARISK). Ph.D. Thesis, Gazi University Science Sciences Institute, Ankara, 554.
- Lee, H., D. Park, S. Choo, and H. T. Pham. 2020. Estimation of the non-greenhouse gas emissions inventory from ships in the port of Incheon. Sustainability 12 (19):8231. doi:https://doi.org/10.3390/su12198231.
- Lin, B., C. Y. Lin, and T. C. Jong. 2007. Investigation of strategies to improve the recycling effectiveness of waste oil from fishing vessels. Marine Policy 31 (4):415–20. doi:https://doi.org/10.1016/j.marpol.2007.01.004.
- Magnusson, K., J. Jalkanen, L. Johansson, V. Smailys, P. Telemo, and H. Winnes. 2018. Risk assessment of bilge water discharges in two Baltic shipping lanes. Journal of Marine Pollution Bulletin 126:575–84. doi:https://doi.org/10.1016/j.marpolbul.2017.09.035.
- Mari, M., M. Nadal, M. Schuhmacher, and J. L. Domingo. 2009. Exposure to heavy metals and PCDD/Fs by the population living in the vicinity of a hazardous waste landfill in Catalonia, Spain: Health risk assessment. Environ Int 35 (7):1034–39. doi:https://doi.org/10.1016/j.envint.2009.05.004.
- Motoyoshi, M., and Y. Nishi. 2020. Statistical modeling of bilge water discharge from ships during normal operation. Journal of Marine Science and Engineering 8 (5):320. doi:https://doi.org/10.3390/jmse8050320.
- Mu, Y., Z. Wang, F. Wu, B. Zhong, M. Yang, F. Sun, C. Feng, X. Jin, K. Leung, and J. P. Giesy. 2018. Model for predicting toxicities of metals and metalloids in coastal marine environments worldwide. Environ. Sci. Technol. 52 (7):4199–206. doi:https://doi.org/10.1021/acs.est.7b06654.
- NRC. 2003. Oil in the sea III: Inputs, fates, and effects, 278. Washington DC, USA: The National Academies Press.
- Olorunfemi, D. I., L. Duru, and O. P. Olorunfemi. 2015. Genotoxic effects of bilge water on mitotic activity in allium cepa L. Caryologia 68 (4):265–71. doi:https://doi.org/10.1080/00087114.2015.1032574.
- Onwuegbuchunam, D. E., T. E. Midwife, L. I. Okoroji, and A. E. Essien. 2017. An analysis of ship-source marine pollution in Nigeria seaports. Journal of Marine Science and Engineering 5 (3):39. doi:https://doi.org/10.3390/jmse5030039.
- Qu, L., H. Huang, F. Xia, Y. Liu, R. A. Dahlgren, M. Zhang, and K. Mei. 2018. Risk analysis of heavy metal concentration in surface waters across the rural-urban interface of the Wen- Rui Tang River, China. Environ. Pollut. 237:639–49. doi:https://doi.org/10.1016/j.envpol.2018.02.020.
- Radovic, J. R., D. Rial, B. P. Lyons, C. Harman, L. Vinas, R. Beiras, J. W. Readman, K. V. Thomas, and J. M. Bayona. 2012. Post-incident monitoring to evaluate environmental damage from shipping incidents. J. Environ. Manage. 109:136–53. doi:https://doi.org/10.1016/j.jenvman.2012.04.042.
- Rausand, M. 2013. Risk assessment: Theory, methods, and applications, Vol. 115. New Jersey: John Wiley & Sons.
- Republic of Turkey Ministry of Transport and Infrastructure (TMOTI). 2021. https://denizcilikistatistikleri.uab.gov.tr/gemi-istatistikler.
- Safadi, E. A. E., O. Adrot, and J. Flaus. 2015. Advanced monte carlo method for model uncertainty propagation in risk assessment. IFAC-Papers Online 48 (3):529–34. doi:https://doi.org/10.1016/j.ifacol.2015.06.135.
- Samsudina, M. S., A. Azida, S. I. Khalita, M. S. A. Sani, and F. Lananana. 2019. Comparison of prediction model using spatial discriminant analysis for marine water quality index in mangrove estuarine zones. Mar. Pollut. Bull. 141:472–81. doi:https://doi.org/10.1016/j.marpolbul.2019.02.045.
- Tiselius, P., and K. Magnusson. 2017. Toxicity of treated bilge water: The need for revised regulatory control. Mar. Pollut. Bull. 114 (2):860–66. doi:https://doi.org/10.1016/j.marpolbul.2016.11.010.
- Tomaszewska, M., A. Orecki, and K. Karakulski. 2005. Treatment of bilge water using a combination of ultrafiltration and reverse osmosis. Desalination 185 (1–3):203–12. doi:https://doi.org/10.1016/j.desal.2005.03.078.
- Ulnikovic, V. P., M. Vukic, and R. Nikolic. 2012. Assessment of vessel-generated waste quantities on the inland waterways of the Republic of Serbia. J. Environ. Manage. 97:97–101. doi:https://doi.org/10.1016/j.jenvman.2011.11.003.
- Yegnan, A., D. G. Williamson, and A. J. Graettinger. 2002. Uncertainty analysis in air dispersion modeling. Environ. Model. Softw. 17 (7):639–49. doi:https://doi.org/10.1016/S1364-8152(02)00026-9.
- Zhou, F., H. Guo, and L. Liu. 2007. Quantitative identification and source apportionment of anthropogenic heavy metals in marine sediment of Hong Kong. Environmental Geology 53 (2):295–305. doi:https://doi.org/10.1007/s00254-007-0644-7.