
 ?Mathematical formulae have been encoded as MathML and are displayed in this HTML version using MathJax in order to improve their display. Uncheck the box to turn MathJax off. This feature requires Javascript. Click on a formula to zoom.
ABSTRACT
The effects of pH, particle size, adsorbent mass and stirring time on the adsorption efficiency were investigated. The univariate linear regression algorithm was applied on experimental data to rank the most effective parameters on the Ni(II) removal percentage. Response surface method (RSM) was then applied to model and optimize the operating conditions of the removal process. Results revealed that the most effective operation parameters on Ni(II) removal is the solution’s pH. It has been concluded that the highest removal of 94.13% is obtained with stirring time of 29.15 min, particle size 137.81 µm, added mass absorbent of 0.346 g and pH of 12.04. Experimental verification showed removal percentage of 93.5% concluding agreement with that obtained by model prediction.
Implications: The removal of Ni(II) ions from wastewater utilizing the agricultural waste of date seed powder is dominated by many parameters; solution pH, initial Ni(II) concentration, adsorbent mass, particle size, operational temperature and contact time. This research classifies these parameters to define the ones that significantly impacts the removal process. Modeling of these parameters was then conducted to study the impact of every set on the removal efficiency thus defining the optimum operating conditions. The findings of this study can be used to create optimal operating conditions that are capable of achieving higher removal percentages than are currently available.
Introduction
Background
Date (Phoenix dactylifera) seeds are very widely spread within the Arabian Peninsula. They are mainly composed of lignin, hemicellulose, and cellulose. Date seed powder is a well-known economical biosorbent material that has many applications. A number of researchers investigated the application of date seeds in the form of powders in the removal of various contaminants (Ahmad et al. Citation2012; Elkhaleefa et al. Citation2020). Date seeds were transformed to activated carbon – famously known for its ability to act as an adsorbent – either by physical or chemical activation. Physical activation can be achieved by applying different techniques, among them, but not limited to, carbonization or calcination of the raw materials that can be attained at elevated temperatures within the range of 500–900°C with an inert atmosphere, followed by mild oxidation (gasification) of the substance with steam, air and/or carbon dioxide at relatively high operating temperatures (800–1,000°C). Moreover, chemical activation was also tested numerously. The process involves impregnation with chemical activating agents (mostly dehydrating agents like KOH, ZnCl2, phosphoric acid (H3PO4), etc.). The process is then followed by pyrolysis at low temperatures in comparison to that of the physical activation temperature (Ahmad et al. Citation2012; Elkhaleefa et al. Citation2020; Jibril et al. Citation2008). Conversely, date seed stones were investigated on the removal of methylene blue dye from aqueous solution (Belala et al. Citation2011; Patel Citation2012), the biosorption capacity recorded for date stone biomass was found to be 43.5 mg/g. The thermodynamic assessment concluded that the dye sorption process for the waste biomass was an endothermic and spontaneous operation (Patel Citation2012). Removal of 2,4-dinitrophenol (DNP) adsorption onto microwave irradiated date seeds was also reported (Al-Mutairi Citation2010). Results defined the optimum operating range for pH between 4 and 5 for the removal of DNP. Compared to 85% removal obtained by activated carbon, the use of date seed has reported a removal of 96% confirming superiority as an absorbent. The use of physically and chemically activation microporous and carbonaceous adsorbents generated from plum stones were used as NO2 adsorbents. The reported sorption capacity for NO2 using such materials reached 65 and 37.5 mg/g in dry and wet conditions respectively (Patel Citation2012).
The application of the date pit was documented after pretreatment with calcium oxide, [7] where the alteration provided a strong basis for Cu(II) and aqueous Ni(II) ions with higher biosorption for positively charged Cu(II) and Ni(II) ions from aqueous suspensions. Moreover, different forms of date palm (DP) were tested for the removal of Cu+2 under a number of operating conditions, namely initial metal concentration, contact time, pH, ratio of adsorbent to solution and adsorbent particle size (Shafiq, Alazba, and Amin Citation2018). The results indicated that it takes approximately two hours to reach equilibrium, resulting in a significant removal of copper ions. During the first hour, the solution is reported to be acidic, with a pH value of 5–6. The use of raw DP trunk fiber was also investigated with an added adsorbent dosage in the range of 0.4–5.0 g.L−1 and initial particle sizes in the range of 75–251 µm. The best adsorption efficiency was reported with the maximum dosage and the smallest particle sizes. The use of different initial Cu+2 concentrations resulted in a 10% decrease in removal, but the adsorption capacity was noted to increase three-times with an initial concentration of 20–100 mg.L−1. A noticeably greater removal efficiency of Cu+2 was obtained by chemically modified DP waste than with the raw trunk fiber when using the same experimental operational conditions and parameters which was justified by the increased functional groups on the tested modified adsorbents (Shafiq, Alazba, and Amin Citation2018).
The removal of Ni(II) from artificial wastewater using date seed powder (DSP) was experimentally investigated comprehensively under various of operating conditions of alternating temperatures, particle size, pH and initial Ni(II) concentration and contact time (Elkhaleefa et al. Citation2020). Moreover, different adsorption models; particularly Langmuir, Dubinin–Radushkevich (D–R), Freundlich and Temkin were applied to assess the obtained data. Obtained results defined maximum removal of 90% for 50 ppm initial concentration under pH 7, with 0.3 g of added adsorbent after and 30 min. The adsorption system was noted to obey the Freundlich model with pseudo second-order kinetic model thus concluding that the process is an exothermic spontaneous phenomenon (Elkhaleefa et al. Citation2020).
Wakkel, Khiari, and Zagrouba (Citation2019) used the central composite design to model and then optimized the operating condition of removing of two industrial dyes, basic red 2 (BR2) and methyl violet (MV), from artificial solution by employing date pits as an adsorbent. Response surface methodology (RSM) was also employed to developed the model of the conditions for the removal (Wakkel, Khiari, and Zagrouba Citation2019). Experiments were conducted by investigating four parameters namely; initial dye concentration, contact time, pH, and temperature (Wakkel, Khiari, and Zagrouba Citation2019). A second-order quadratic model was also applied. Results revealed that the pH and initial dye concentrations are the most dominant variables within the adsorption process (Shafiq, Alazba, and Amin Citation2018; Wakkel, Khiari, and Zagrouba Citation2019). The central composite design was also used in studying the removal of 2,4-dichlorophenol from aqueous solution using activated carbon produced via thermal activation of oil palm bunches (Zahangir, Muyibi, and Toramae Citation2007). Results concluded the highest adsorption of phenolic compound with agitation rate of 100 r/min, initial adsorbate concentration of 250 mg/L, pH 4 and contact time of 8 hr. Langmuir adsorption isotherm was more favorable in this study with higher regression value (R2 = 0.93) than that obtained by Freundlich adsorption isotherm (R2 = 0.88) (Zahangir, Muyibi, and Toramae Citation2007).
Problem statement
The removal of different heavy metals under various operating conditions was studied using economical, available, and environmentally friendly natural adsorbents. Moreover, a variety of modeling techniques were applied to simulate these findings, however, no literature review was found to address the modeling of such data using response surface method in conjunction with the use of untreated date seed powder as an absorbent for Ni(II) removal
Research objectives
This study investigates the operating conditions of Ni(II) ions adsorption using date seed powder. The adsorbent was used without physical nor chemical alterations. Experimental data used in this work is presented by (Elkhaleefa et al. Citation2020). The univariate regression algorithm was used to rank the parameters affecting the removal efficiency of Ni(II) ions from artificial wastewater based on their importance. The RSM method was then applied to model the removal process. The parameters affecting the adsorption process efficiency which were tested are pH, adsorbent mass, adsorbent particle size and stirring time between sorbent and solution.
Materials and methods
Local date seeds collected from Abha City, Saudi Arabia were used in this study. The seeds underwent a number of pretreatment processes before being used, namely; rinsing with tap and deionized water, drying at room temperature, grinding to powder using a ball mill before being sieved.
Experiment
A stock solution of 1000 ppm Ni(II) ions solution from NiNO3 (LOBA Chemie, Laboratory Reagents and Fine Chemicals, India) was prepared using deionized water (> 18 Ω/cm, Milli-Q). Date seed powder was added to batches of 50 mL from the stock solution which acted as an adsorbent. Solutions were then analyzed under different operating conditions of stirring time, adsorbent doses, and particles size, pH by adding the desired amount of DSP. The pH of the solution was monitored and controlled by adding NaOH (0.25 M) and/or HCl (0.25 M). Homogeneity of the solution was maintained by using a mechanical thermostatic shaker (WSB, Witeg, Germany) throughout the study. At the end of each run, obtained solutions were filtered before characterized for Ni(II) traces using atomic absorption spectroscopy (AAS) (SpectrAA 220, Varian, Australia). The efficiency of the adsorption process was assessed by calculating (R%) based on EquationEquation (1)(1)
(1)
where Co and Ce are the initial and equilibrium Ni(II) ion concentrations, respectively. Data obtained from experimental work is presented in (Elkhaleefa et al. Citation2020).
Modeling and classification techniques
Univariate regression algorithm
In the world of statistics, univariate linear regression was established and is studied as a framework for understanding the relationship between numerical variables of input and output, and as a means of classification and ranking for number of parameters affecting particular responses. It is both a statistical algorithm and an algorithm for machine learning. The advantages of using the univariate regression algorithm can be summarized as follows:
In general, the univariate regression algorithm is a simple approach in finding relationships between dependent and independent variables
The univariate regression algorithm provides a significance level of each attribute contributing to the prediction of the dependent variable.
However, the primary limitation is that its performance is inadequate when dealing with nonlinear relationships. This may be influenced by missing data in the dataset. The presence of a high correlation among the variables also contributes to the regression model’s poor performance.
The univariate regression algorithm is defined in EquationEquations 2(2)
(2) and Equation3
(3)
(3) . The logit Y, which takes values from –7 to +7, is a nearly abstract calculation for all but the professional model manufacturer. Fortunately, a simple transformation leads to the possibility of a person of Class 1, Prob (Y = 1). The transition in the logit likelihood is in EquationEquation 3
(3)
(3) .
If Y is a binary dependent variable, assuming two effects or groups (typically labeled 0 and 1) Then the algorithm classifies an individual into one of the classes dependent on X1, X2, …, and Xn values for the predictor variables. The univariate regression algorithm calculates the Y logit is in EquationEquations 2(2)
(2) and Equation3
(3)
(3) .
In EquationEquations 2(2)
(2) and Equation3
(3)
(3) the relation of prediction values to an individual result in an estimated (“predicted”) probability of class 1.
The b’s are the logistic regression coefficients calculated by the most probable calculus-based procedure. Unlike the other variables, b0 does not have the associated predictor component (referred to as the intercept). The univariate regression algorithm is readily used as a benchmark for reaction modeling, because the yes/no reaction variable is an example of a binary type variable.
The classification using the univariate regression algorithm was performed in this work using Python 3.7. This was one of the most popular preprocessing algorithms to date and then the RSM was applied, which was first created to determine the optimal operating conditions for chemical processes. In a number of industrial applications, this technique is used to classify the rates of design factors or variables that maximize a response. RSM provides efficient and effective solutions for its flexibility and efficiency. In addition, it was commonly used for other engineering issues [13–16].
Response surface methodology (RSM)
Response surface methodology is a mathematical and statistical techniques assist in develop a fitting of a polynomial equation to the experimental data, which must describe the behavior of a data set with the objective of making statistical previsions. Before applying the RSM methodology, it is necessary to choose an experimental design that defines which experiments should be carried out in the experimental region being studied such as the three level factorials, Box–Behnken, central composite, and Doehlert designs.
Box–Behnken is still considered to be the most powerful and more proficient than other designs such as the three-level full factorial design, central composite design (CCD) and Doehlert design, despite its poor coverage of the corner of nonlinear design space, which can be considered a technique drawback (Ferreira et al. Citation2007; Marasini et al. Citation2012). Moreover, it demands fewer experimental runs than three-level full factorial design and CCD, and consequently is less exclusive.
In this paper Box–Behnken design is used because it is more efficient and economical than their corresponding 3k designs, particularly for a large number of variables it requires a smaller number of experimental sets, its principal characteristics are:
(1) Requires an experiment number according to N = 2k(k – 1)+ c where k is the number of factors and (c) is the number of the central points.
(2) All factor levels have to be adjusted only at three levels (−1, 0,+1) with equally spaced intervals between these levels.
The RSM model consists of a polynomial equation to represent Y (Removal percent) as a function of any individual (X2, X3, and … Xn), as follows (Osman Citation2018; Osman, Shigidi, and Elkhaleefa Citation2016):
where β0, βi, βii and β are the correlation coefficients, and evaluations X1 = A, X2 = B and X3 = C …
Xn = H are the independent variables; a least square formulas are used to determine RSM parameters.:
Design-Expert 10.0.1 software was employed for developing all the regression models.
The removal response is affected by independent variables. The four independent variables considered here are added dates mass (X1), stirring time in minutes (X2), particle size of added seeds in microns (X3), and pH of solution (X4).
Model validation and evaluation
The R2 and error analysis were conducted in the model between the experimental and predicted results, to assess the accuracy of the model fitting and the performance of the predicted models. Some of the validation approaches outlined in the literature are used for an examination of errors, some of which are identified by (Gendy et al. Citation2018; Haitham, Jamel, and Ihab Citation2020).
In this paper, modern and high-precision methods are used to evaluate the precision of the model using the error as the output index. Various tests of the model’s precision are possible.
The two first are the root mean square error (RMSE) and the R2.
In general, the smaller the RMSE value, the more accurate the fit of the model. The root mean square error can be calculated as:
where p is the number of nonconstant terms in the RSM model, SSE is the sum square error, and SST is the total sum square. The SSE and SST are given by:
Generally,
Where fi is the estimated function value at the i-th design point, f is the determined function value from the polynomial design point I, and f’ is the fi mean in the other hand, the higher the R2 values and the adjusted R2 values, and the lower the RMSE value, the stronger the match between the model and the experimental results. In cases where the amount of design variables is high. It is more appropriate to look at R2adj, because R2 always rises when the amount of terms in the model grows, whereas R2adj usually declines as unnecessary terms are applied to the model as it can be defined:
In fact, R2adj reduces if the model is added to unnecessary terms,
R2pred measures the percentage of variation presented by the model in new data.
where PRESS is demonstrating the fitness of each design point with the developed model.
where e–i is a residual deletion that is determined by fitting a model in an i-th run to estimate the i-th observation using the resulting model. The discrepancy from R2adj and R2pred must be within 0.20.
It is important to use similar techniques for statistical analysis, i.e. the ANOVA test to validate the efficacy of the RSM model, thereby identifying the primary results of the design variables. F-test, R2, R2adj and root mean square error are primary statistical parameters used to assess model fitness (Elkhaleefa and Shigidi Citation2015; Osman Citation2019; Osman, Shigidi, and Arabi Citation2019; Osman, Shigidi, and Elkhaleefa Citation2016).
When the number of design variables is high, R2adj is taken in place of R2 because with the increasing number of terms in the model, the later value often increases.
In the selection of models, Akaike’s knowledge criterion for a small design (AIC) is applied to validate measurements within a cohort of nonlinear models; it is given by the term:
where p corresponds to the number of parameters and ln(L), the maximum log likelihood of the calculated model (Akaike), which is given as
where x1, …, xn are the residuals from the nonlinear least-square fit and N is their number.
Whenever the samples tested are smaller in dimension, the models with too many words are selected by AIC. This is where the corrected AIC (AICc) is used as a substitute to fix such miss-selections by increasing the penalty on additional terms for smaller designs.
where n and p are the sample size and the number of parameters respectively.
Conversely, because of its superior performance in such situations, BIC is viewed as an alternative to AICc when larger designs are combined. Calculated to be:
where p, n and L are the number of parameters, sample size and the maximum likelihood of the estimated model successively.
Results and discussion
Univariance regression algorithms for ranking
As the analyzed parameters (namely, pH, stirring time, mass and particle sizes) vary widely in range, classification of these parameters using univariate linear regression was applied. Results showed that the pH has a higher value (29.821) as presented in . This finding indicates the highest domination on the removal efficiency compared with the other tested parameters. The second most dominant parameter was the stirring time followed by the mass of date seeds added, however, the least impact was noted to be caused by the particle size.
Figure 1. SEM images of the DSP surface (a) before and (b) after adsorption
Response surface methodology approach
The model prediction is developed using Design-Expert 10 (DoE), statistical visualization, and optimization techniques to efficiently deliver high-quality Ni(II) removal calibrations model built-in Windows 10 platform with i7 16GB RAM. To assess the computational efficiency and accuracy of the built models, the functions above are regarded as good indicators. The small R2adj and R2 values and large RMSE values suggest poor fittings for RSM models. The calculated regression coefficients of the predicted response surface models and statistical analysis are shown in .
Table 1. Process variables and their coded levels for the RSM design
Table 2. ANOVA for response surface reduced quadratic model analysis of variance table
Table 3. Statistical indices for the development model of Ni(II) removal
Final equation in terms of actual factors:
The equation in terms of actual factors can be used to provide predictions of the response for given levels of each factor.
Model F-value of 50.10 indicates significant model. There is just a 0.01% probability this high F-value will arise due to noise. Model terms are important for “Prob > F” values less than 0.0500. A, B, C, D, B2, D2 are important model names. Values over 0.1000 suggest that models are not relevant. If there are several insignificant terms of the model (not counting those needed to help hierarchy), the model reduction can improve model efficiency.
The “pred R-squared” of 0.8893 agrees with the “adj R-squared” of 0.9218, i.e. the difference is less than 0.2. The signal-to-noise ratio calculate “Adeq precision” A ratio above 4 is ideal. This 32,013 ratio shows an acceptable signal. Use this model to navigate design space.
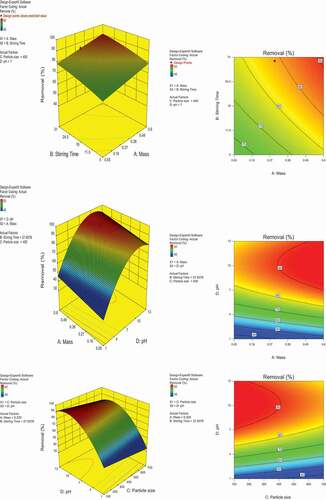
Response surface contour plots were carried out and presented in . Result reveals that the most influencing parameters affecting the removal percentage within its optimum values at the highest contour level. The maximum predicted yield is presented by the surface confined in the smallest curve of the contour diagram
Figure 2. 2D and 3D models for different parameters of the Ni(II) removal
Optimization of the developed model
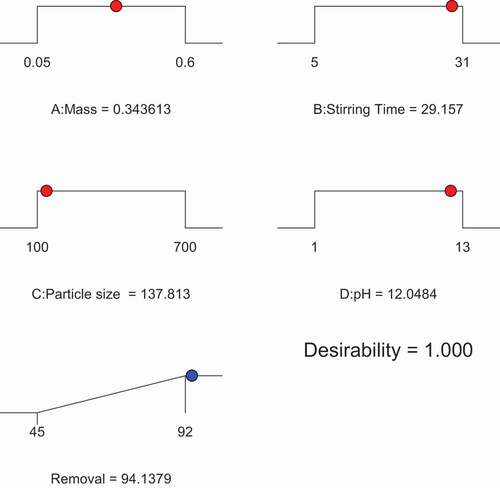
The removal of Ni(II) can be achieved with a maximum efficiency of 94.1379% using date seed powder with optimum operation conditions of added DSP Mass = 0.346 g., stirring time of 29.157 minutes, particle size =137.813 µm and pH = 12.04 as presented in . In comparison with experimental data carried for model prediction verification removal of 93.5% was obtained for Ni(II) ion solution concentration of 50 ppm was attained at pH 7 after 30 min and with 0.30 g of an added adsorbent mass.
Design-Expert® was used to optimize the investigated parameters Obtained results showed competitiveness between the two approaches confirming finds for the same removal percentage.
demonstrates the layout of the impact on Ni(II) removal percentage when investigating the stirring time and absorbent mass added. The optimum removal obtained was 94.1379% with a stirring time of 29.157 min and an added absorbent mass of 0.3436 g compared to 0.3 g as reported experimentally.
Figure 3. Optimization of absorbent mass, pH, particle size and stirring time parameter on Ni(II) removal efficiency
The particle size plays an important role in the removal percentage of Ni(II) ions from the artificial wastewater. shows the optimum values for particle size of 137.813 µm with 0.3436 g of adsorbent mass generating a removal of 94.1379%. Experimental data, however, showed a removal of 90% with particle size of 100 µm.
When looking at the effect of pH on the removal in conjunction with the added mass of absorbent, it is clear that removal is achieved at high values of pH whereas acidic range proved lower removal efficiency. An optimum value of 94.1379% removal percentage was achieved at pH 12.04 with the same optimized mass value of 0.346 g of added absorbent. The literature shows a removal of 90% only with a pH value of 7 (Elkhaleefa et al. Citation2020).
Conclusion
Date seeds, an available, cheap, and environmentally friendly adsorbent, were used in powder form in this study for the removal of Ni(II) ions from artificial wastewater by studying the impact of particle size, stirring time, pH, and adsorbent mass.
For a better understanding of the individual effect of these processing parameters, the univariate regression algorithm is used to rank the parameters based on the most effective operation condition variables on the Ni(II) removal. This algorithm is applied in preprocessing step of the data before the model is developed. Results obtained revealed that the pH dominating the removal separation process.
The RSM model was then developed and verified by monitoring nine statistical indices namely: RMSE, p-value, F-value, R2, R2adj, R2pred, BIC, PRESS and AICc. Results concluded that the model is significant based on these statistical indices values. Optimization analysis of process specified the true optimum process parameters for maximum removal percentage of 94.1379% with mass of absorbent of 0.346 g and stirring time of 29.157 minutes with pH of 12.04 and particle size of 137.813 µm.
Supplementary_Material.docx
Download MS Word (16 KB)Disclosure statement
The authors declared no potential conflicts of interest with respect to the research, authorship, and/or publication of this paper.
Supplementary materials
Supplemental data for this paper can be accessed on the publisher’s website.
Additional information
Funding
Notes on contributors
Haitham Osman
Haitham Osman is an Assistant Professor at King Khalid university, graduated from Newcastle University (UK). His research interests included but not limited to process modeling and optimization, advance process control, separation processes, and machine learning. He has published papers in journals and conferences in the area of process statistical modeling, numerical analysis,advance process control, optimization, and artificial intelligence.
Ihab Shigidi
Ihab Shigidi is an Assistant Professor at King Khalid University, Graduated from Loughborough University; he undertook a number of posts within King Khalid University. Dr. Shigidi works in different areas within the Chemical engineering arena, among them but not limited to separation processes, desalination, transport phenomena and mathematical modeling.
Abubakr Elkhaleefa
Abubakr Elkhaleefa is a lecturer at King Khalid University. Graduated from the University of Gezira– Sudan. He works in the area of water and wastewater treatment and related topics.
Ismat Ali
Ismat Ali is an Associate Professor of physical chemistry at King Khalid University. He graduated from the University of Khartoum, Sudan. He published tens of scientific papers in international journals. Dr Ali works in various research areas such as; chemical kinetics, corrosion, electrochemistry and removal of toxic material from wastewater.
Eid Brima
Eid Brima (PhD in Analytical Chemistry 2007 –De Montfort University, UK) is an Associate Professor at King Khalid University, College of Science. He is an expert in Analytical Chemistry with the main focus on bioscience. This includes teaching, research, curriculum set up and supervision of undergraduate and postgraduate students.
Basem Al Alwan
Basem Al Alwan is an assistant professor at Chemical Engineering Department in King Khalid University, who graduated from Wayne State University, Detroit, MI, USA. Dr. Al Alwan works in several areas such as heterogeneous catalysis, biofuels, nanoparticles, and hydrogen production.
Related Research Data
References
- Ahmad, T., M. Danish, M. Rafatullah, A. Ghazali, O. Sulaiman, R. Hashim, and M. N. M. Ibrahim. 2012. The use of date palm as a potential adsorbent for wastewater treatment: A review. Environmental Science and Pollution Research 19:1464–84. doi:https://doi.org/10.1007/s11356-011-0709-8.
- Al-Mutairi, N. 2010. 2, 4-Dinitrophenol adsorption by date seeds: Effect of physico-chemical environment and regeneration study. Desalination 250:892–901. doi:https://doi.org/10.1016/j.desal.2008.10.035.
- Belala, Z., M. Jeguirim, M. Belhachemi, F. Addoun, and G. Trouvé. 2011. Biosorption of basic dye from aqueous solutions by date stones and palm-trees waste: Kinetic, equilibrium and thermodynamic studies. Desalination 271:80–87. doi:https://doi.org/10.1016/j.desal.2010.12.009.
- Elkhaleefa, A., I. H. Ali, E. I. Brima, A. Elhag, and B. Karama. 2020. Efficient removal of Ni (II) from aqueous solution by date seeds powder biosorbent: Adsorption kinetics, isotherm and thermodynamics. Processes 8:1001. doi:https://doi.org/10.3390/pr8081001.
- Elkhaleefa, A., and I. Shigidi. 2015. Optimization of sesame oil extraction process conditions. Advances in Chemical Engineering and Science 5:305. doi:https://doi.org/10.4236/aces.2015.53031.
- Ferreira, S. C., R. Bruns, H. Ferreira, G. Matos, J. David, G. Brandão, E. P. da Silva, L. Portugal, P. Dos Reis, and A. Souza. 2007. Box-Behnken design: An alternative for the optimization of analytical methods. Analytica chimica acta 597:179–86. doi:https://doi.org/10.1016/j.aca.2007.07.011.
- Gendy, T. S., S. A. El-Temtamy, R. A. El-Salamony, and S. A. Ghoneim. 2018. Comparative assessment of response surface methodology quadratic models and artificial neural network method for dry reforming of natural gas. Energy Sources, Part A: Recovery, Utilization, and Environmental Effects 40:1573–82. doi:https://doi.org/10.1080/15567036.2018.1486476.
- Haitham, O., M. Jamel, and S. Ihab. 2020. Statistical analysis and mathematical modeling of modified single slope solar still. Energy Sources, Part A: Recovery, Utilization, and Environmental Effects 43, 2021(21): 1–19.
- Jibril, B., O. Houache, R. Al-Maamari, and B. Al-Rashidi. 2008. Effects of H3PO4 and KOH in carbonization of lignocellulosic material. Journal of Analytical and Applied Pyrolysis 83:151–56. doi:https://doi.org/10.1016/j.jaap.2008.07.003.
- Marasini, N., Y. D. Yan, B. K. Poudel, H. G. Choi, C. S. Yong, and J. O. Kim. 2012. Development and optimization of self–nanoemulsifying drug delivery system with enhanced bioavailability by Box–Behnken design and desirability function. Journal of Pharmaceutical Sciences 101:4584–96. doi:https://doi.org/10.1002/jps.23333.
- Osman, H. M. 2018. Comparative study of modeling sesame oil extraction process by using Hexane. 18th International Conference on Control, Automation and Systems (ICCAS), 2018 South Korea, IEEE, 1663–66.
- Osman, H., I. Shigidi, and A. Arabi. 2019. Multiple modeling techniques for assessing sesame oil extraction under various operating conditions and solvents. Foods 8:142. doi:https://doi.org/10.3390/foods8040142.
- Osman, H., I. Shigidi, and A. Elkhaleefa. 2016. Optimization of sesame seeds oil extraction operating conditions using the response surface design methodology. Scientific Study & Research. Chemistry & Chemical Engineering, Biotechnology, Food Industry 17:335.
- Osman, H. 2019. Model prediction and optimization of waste lube oil treated with natural clay. Processes 7:729. doi:https://doi.org/10.3390/pr7100729.
- Patel, S. 2012. Potential of fruit and vegetable wastes as novel biosorbents: Summarizing the recent studies. Reviews in Environmental Science and Bio/Technology 11:365–80. doi:https://doi.org/10.1007/s11157-012-9297-4.
- Shafiq, M., A. Alazba, and M. Amin. 2018. Removal of heavy metals from wastewater using date palm as a biosorbent: A comparative review. Sains Malaysiana 47:35–49. doi:https://doi.org/10.17576/jsm-2018-4701-05.
- Wakkel, M., B. Khiari, and F. Zagrouba. 2019. Basic red 2 and methyl violet adsorption by date pits: Adsorbent characterization, optimization by RSM and CCD, equilibrium and kinetic studies. Environmental Science and Pollution Research 26:18942–60. doi:https://doi.org/10.1007/s11356-018-2192-y.
- Zahangir, A., S. A. Muyibi, and J. Toramae. 2007. Statistical optimization of adsorption processes for removal of 2, 4-dichlorophenol by activated carbon derived from oil palm empty fruit bunches. Journal of Environmental Sciences 19:674–77. doi:https://doi.org/10.1016/S1001-0742(07)60113-2.