
 ?Mathematical formulae have been encoded as MathML and are displayed in this HTML version using MathJax in order to improve their display. Uncheck the box to turn MathJax off. This feature requires Javascript. Click on a formula to zoom.
ABSTRACT
Residents tend to close the doors and windows of their residential kitchens in severe cold conditions, making insufficient outdoor air supply and aggravating indoor air pollution. In order to understand the ventilation and pollution status of the residential kitchens in a severe cold region and improve the ventilation system, this study used questionnaires, on-site tests, and Computational Fluid Dynamics (CFD) simulation to analyze a pollution and ventilation case in Shenyang, China. The method of using ceiling openings to compensate for outdoor air supply was proposed and optimized to improve air distribution in the residential kitchen. The average CO2 concentration in the breathing region, air velocity, and temperature levels in the kitchen, before and after the improvement, were compared. The results indicated that the kitchen pollution in severe cold area of Shenyang is serious, and the ventilation habit has regional characteristics. Furthermore, the overall kitchen environment including air velocity, temperature, pollutant levels, static pressure, CO2 concentration, indoor airflow fluctuation, and cooking fire were obviously improved for the ceiling make-up air cases. These findings provide a basis for improving the reasonable air distribution of residential kitchens in cold regions and for building a thermally comfortable environment.
Implications: In order to understand the ventilation and pollution status of the residential kitchens in a severe cold region and improve the ventilation system, this study used questionnaires, on-site tests, and Computational Fluid Dynamics (CFD) simulation to analyze one pollution and ventilation case in Shenyang, China. The method of ceiling openings to compensate for outdoor air supply was proposed and optimized to improve air distribution in the residential kitchen. The average CO2 concentration in the breathing region, air velocity, and temperature levels in the kitchen, both before and after the improvement, were compared. The results indicated that the kitchen’s air velocity, temperature, and pollutant levels are much better for the ceiling make-up air case compared with permeation and opening window cases. The static pressure, CO2 concentration, indoor airflow fluctuation, and cooking fire showed remarkable improvement in the residential kitchens. These findings provide a basis for improving the reasonable air distribution of residential kitchens in cold regions and for building a thermally comfortable environment.
INTRODUCTION
The residential kitchen is an important functional area in the house, and cooking is a major cause of indoor air pollution (Chang Citation2016). Chinese cooking behavior is characterized by stir-fry and long cooking time. The common Chinese residential kitchen is narrow in space with no air conditioning system inside it. These factors compound the air quality problem in the kitchen. The oil smoke produced by the fuel combustion and cooking process in the kitchen produces several organic and inorganic gas pollutants, including a variety of harmful chemical components, which are highly toxic to our lungs and immune system and even have carcinogenic effects (Zhang Citation2016). More than 300 products are generated in this high-temperature process, including fatty acids, alkanes, alkenes, aldehydes, ketones, alcohols, esters, aromatic compounds, heterocyclic compounds, etc. (Wang and Xiang et al. Citation2017). Several studies have established a positive correlation between cooking frequency and lung cancer. Incidence of both lung squamous cell carcinoma (51.6%) and lung adenocarcinoma (61.0%) were related to the harmful substances produced in cooking (Liu Citation1999).
Mechanical ventilation of residential kitchens can prevent the cooking smoke from entering the room since they are in certain negative pressure. However, too large negative pressure resulting from insufficient outdoor air supply causes indoor pollution problems and affects the normal use of the stove. A certain amount of fresh air is required to ensure better air quality in the kitchen, reduced room temperature, an improved working environment, and balance the air pressure (Wan, Likui, and Hou Citation2005). When the range hood is opened while doors and windows are closed during cooking, the infiltration of their gaps often fails to meet the air supplement required by the kitchen, leading to a state of large negative pressure and a decrease of the range hood’s discharge capacity in the kitchen. Resultantly, the air quality of the kitchen becomes poor (Wang Citation2015). Gao et al. (Gao and Cao et al. Citation2013) combined experimental and mathematical methods to determine the dynamic intake fraction of smoke particles from a particular cooking process under different ventilation conditions. They found that the ventilation conditions of the kitchen space significantly affected the exposure level. Saha et al. (Saha and Guha et al. Citation2012) in their experimental and numerical studies, found that the distribution of pollutants in the kitchen depended on the structure of the building, the location of the objects, and the type of ventilation.
Since the airflow was not well organized, oil smoke still spread even if the range hood alone was used (Zhao, Li, and Tao et al. Citation2013). In order to remove the waste heat and particles produced by cooking, the air curtain can be formed by introducing fresh air into the gas stove by opening holes around the gas stove. The air curtain needs to maintain a certain angle and wind speed for blocking oil smoke. The change of these parameters will lead to the reduction of the capture efficiency of the smoke exhauster (Cascetta Citation1996; Chen, Xin, and Liu Citation2020). The improvement of the range hood itself and its application can also improve the capture efficiency to a certain extent, such as adding separation plate/side plate under the range hood (Yi, Kim, and Bae Citation2016), inducing local air exhaust ventilation (Swierczyna, Sobiski, and Fisher Citation2006), optimizing the position and size of the opening of the range hood (Han, Li, and Kosonen Citation2019), and changing the installation height and type of the range hood (Liu, Cao, and Zhao et al. Citation2020; Zhao and Zhao Citation2020). The use of air conditioning equipment in the kitchen can effectively improve the thermal comfort. The air treated by air conditioning is introduced into the cabinet under the stove, and the upward air curtain can be added, which can produce a good effect of pollution control and thermal comfort improvement (Du, Gao, and Chen et al. Citation2017). However, the existing methods do not consider the difficulty of introducing fresh air under the stove, especially in the existing residential kitchen. It is found that opening the range hood combined with using mask is a reasonable consideration (Du, Gao, and Chen et al. Citation2017). The uncaptured heat flow from the range hood rises and transfers to the ceiling. Ceiling ventilation provides an efficient solution for kitchen ventilation (Kosonen Citation2007). However, it is difficult to install fan equipment in the ceiling space of Chinese style kitchen, and it is difficult to clean the oil smoke.
Zhou et al. (Zhou, Wei, and Tan et al. Citation2019) evaluated the distribution of CO2 concentration in the residential kitchen through experiments and observed uneven distribution of CO2 concentration in the kitchen when the range hood worked alone, and the kitchen window was kept open. Solution on air supplements in residential kitchens are not well established in the real application yet, especially in the very cold regions since residents tend to close the doors and windows in cold winter. Zhou et al. explored the application effect of push-pull ventilation system in the residential kitchen by combining experiment with simulation (Zhou and Chen et al. Citation2016; Zhou, Wei, and Tan et al. Citation2019), and the performance of ventilation systems with mechanical and natural supply methods, as well as the combined effect with door seam, is also evaluated experimentally and numerically (Lu, Zhou, and Zhang et al. Citation2021). Liu et al. proposed a new ventilation system that had upward air curtains around the gas stove and conditioned air from the cabinet under the stove (Liu, Cao, and Zhao et al. Citation2020). These methods need to set up a make-up air system in the lower cabinet area, which is troublesome to implement and narrow the space of cabinet. The positions of their make-up air ducts are under the stove, and the effect of air supplement is satisfactory. However, in their actual application of residential kitchen, the installation of make-up air duct is troublesome and occupies the storage space under the stove.
The main difference between our research and them is that our make-up air flows naturally in the ceiling driven by negative pressure and there is no make-up air duct. The method of using ceiling openings to compensate for outdoor air supply is characterized by ceiling openings above the human head and external wall openings next to ceiling space. The exterior wall opening is opened when the smoke exhaust fan is turned on and closed when there is no smoke exhaust. Under the negative pressure caused by exhaust, the outdoor cold air entering through the ceiling can be preheated by the ceiling, which is more suitable for the application in severe cold areas.
In order to discover the ventilation and pollution states of residential kitchens in severe cold regions and improve the ventilation system, 81 online questionnaires in the Shenyang were collected. A typical residential kitchen was selected to monitor the change of CO2 concentration during cooking. Simultaneously, CFD was used to simulate the kitchen temperature, wind velocity, and pollutant concentration under closed, variable-scale windowing and ceiling make-up air conditions. The objective of this study was to understand the ventilation habits of residents in the cold region during cooking and explore the form of ceiling make-up air suitable for this area.
Materials and Methods
Questionnaire and pollutants test
In order to understand the cooking style and ventilation habits of the residents, this study surveyed the kitchen behavior in a severe cold region by employing questionnaire. The questionnaire software was used to design an online questionnaire about the kitchen habits of residents in northern China. Family members who often cook or are familiar with cooking habits at home were required to complete the questionnaire. The problems encountered were the windowing situations during cooking, the use of range hood, cooking methods, thermal comfort, fire habits, and personnel stay time.
The tested kitchen pollutants included particulate matter with a diameter of 2.5 µm (PM2.5) and 10 µm (PM10), formaldehyde (HCHO), and volatile organic compounds (VOCs) in which the pollution level of PM2.5 was a new test finding and the pollution of HCHO and VOCs were our previously published results (Wag, Huang, and Feng et al. Citation2020). The average PM2.5 and PM10 concentrations of 30 representative kitchens in winter were recorded by the TSI Nanoparticle Emission Tester (NPET) with an accuracy of ± 5%. Tracking tests were conducted in these typical residential kitchens during cooking to understand the kitchen comprehensively (GB/T 18204.18-Citation2013 2013). The concentrations of HCHO and VOCs in 19 residential kitchens under closed conditions before cooking were determined to understand the degree of pollution in residential kitchens. Cooking style, window-opening practices, range hood-opening habits, and other relevant information were also documented. Further details about the test house can be found in Jun Wag et al (Wag, Huang, and Feng et al. Citation2020).
The test included a group of concentration monitoring of PM2.5 in kitchens for different ventilation modes of residents in Shenyang. During the test, variable-scale windowing (at 15°, 30°, and 45° angles) was arranged using the built-in fixture. The TSI particle tester was used and it has accuracy of ±5%. The data was collected every minute. The measurement location was set at 1.4 height above the ground to provide data for validation simulations according to the former experience (Jiasen Citation2019).
Air change rate test
The air change rate in the indoor space of kitchens was determined using the method of measuring the fresh air volume of building interior space as given by the Chinese testing standard GB/T 18204.1–2013,‘public health inspection methods part 1: physical factors’ (GB/T 18204.18-Citation2013 2013). shows the instruments used in the test.
Table 1. Test instruments required to test air change rate.
The tracer gas concentration attenuation method with CO2 as the tracer gas was employed. The average method was used to analyze the results and calculate the air change rate in the kitchen. The attenuation of CO2 concentration was recorded by the Telaire 7001 CO2 sensor. Before scene measurements, the kitchen doors and windows were closed, and the gas tank was opened to release CO2. The measurement point was selected at 1.2 m above the floor (Kim, Walker, and Delp Citation2018). Using fans mix tracer gases with indoor air. The release of CO2 was stopped when its concentration in the kitchen reached 2500 ppm. After 5 min, the range hood was turned on (the usual gear for the household). One data point was collected every min. The measurement ended when the CO2 concentration reached the background value. The number of air change rate, N, was determined using equation (1):
Where C0 denotes the environment background concentration of the tracer gas; C1 denotes the mass concentration of the tracer gas in the room at the initial time (ppm); Cτ denotes the mass concentration of the tracer gas in the room at time τ (ppm); and τ denotes the measurement time, h.
The air supply quantity Q was calculated by using formula (2).
Where V represents the room volume (m3), and N represents the air change. The test designed a group of kitchen make-up air experiments based on the CO2 tracer gas method for different ventilation modes of residents in severe cold regions. Variable-scale windowing (at 15°, 30°, and 45° angles) was done to carry out the air change rate. We used CO2 in the tracer gas concentration attenuation method. The make-up air and air change rates were calculated.
Mathematical model
The zero-equation turbulence model is used to conduct the transient calculation of the ventilation process. Momentum equation were as follows:
Where p is the static pressure, is the stress tensor and
is the gravitational body force.
Energy equation were as follows:
Where k is the molecular conductivity; is the conductivity due to turbulent transport (
), and the term
includes the volumetric heat sources.
To simulate the CO2concentrations inside the kitchen, Species transport were as follows:
where is the local mass fraction of each species;
is the diffusion flux of species i;
is the generation rate by addition from user-defined sources.
Based on the Boussinesq approximation, the Reynolds stresses induced by turbulent fluctuation can be represented in the same way as the viscous stresses, represented in EquationEq. (6)(6)
(6) :
where µt denotes the turbulence viscosity, and it represents the velocity fluctuation:
Where is the local average velocity;
is the characteristic dimensions of turbulent fluctuations.
The flame burning produces high temperature radiation effect on human body and the surrounding environment. Therefore, the simulation should consider the corresponding heat radiation. Based on the study of Xing et al (Zibo Citation2019). the DO model was chosen as the radiation model. After obtaining the convergence solution of the steady flow field on FLUENT, the drift flux model is calculated to obtain the ultrafine particle concentration. Improved drift flux model was used (Wang, Li, and Feng Citation2020). The improved model was developed by Zhao et al. (2009) and had been experimentally verified to provide great prediction accuracy to simulate the distribution of ultrafine particles.
Geometry model and grid generation
In this study, the software Fluent (ANSYS version 19.2) was used to simulate the air distribution in the kitchen. The airflow in the kitchen remains turbulent by using the standard k-ԑ unsteady turbulent flow model and transmission model of components for the kitchen air three-dimensional incompressible flow numerical simulation. The SIMPLE algorithm was employed to discretely solve the model of a natural ventilation residential kitchen (Xu, Li, and Feng Citation2017). The kitchen uses radiant floor heating and exhaust air with a range hood. After simplifying some electrical appliances, the physical model is shown in ,
Figure 1. Test sample (left) and laboratory layout (right).
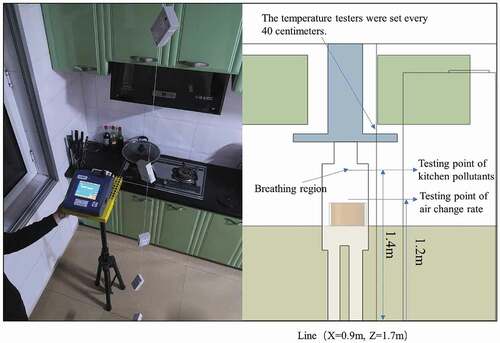
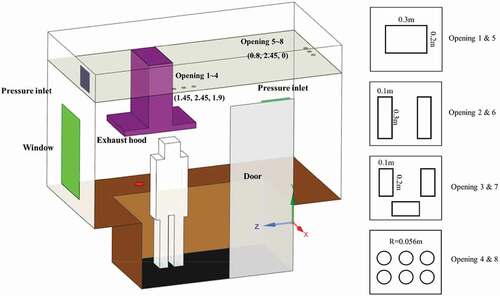
Figure 2. Typical residential kitchen model.
In order to compare the kitchen environment with or without make-up air, reference and design conditions were set in the simulation process. shows the ventilation forms and initial conditions under each of the simulated conditions. The CO2 concentration, temperature at the point (X = 0. 7 m, Y = 1.4 m, Z = 1.9 m) inside the kitchen with the different grids are compared and reflected in ,
Figure 3. Comparison of CO2 concentration, temperature at the point (X = 0.7 m, Y = 1.4 m, Z = 1.9 m) for different grids. (a) Temperature; (b) CO2 mass fraction.
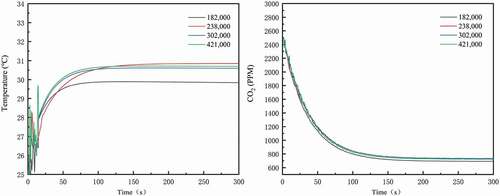
Figure 4. Results of ventilation habits questionnaire and of cooking methods.
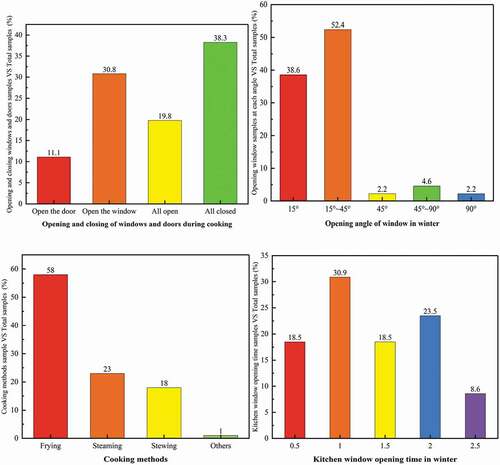
Table 2. Simulated condition.
A residential kitchen should be equipped with an air inlet to meet the requirement that the cold air does not pass through the working area of people as far as possible. Importantly, to block the pollutants generated by cooking in the kitchen on time, it is suggested to make up for the fresh air volume, improve the indoor air quality, and meet the fresh air requirements. The position of the kitchen inlet area can affect to make-up air effect. Most of the people accept opening the inlet in the appropriate position of the ceiling to communicate with the outdoor atmosphere. In a severe cold region, the air distribution, personal thermal comfort, and pollutant control levels are optimum at an air inlet area of 0.06 m2 (Pang Citation2013). Under the condition that the air intake area is fixed, the air intakes are located at the rear of the person, and the innermost part of the room, each of the four air intakes shown in was used at one time at each location. Levels of the pressure, temperature, velocity, and pollutant of each design condition were analyzed by simulation.
The quality of the mesh directly determines the accuracy and results of the calculation. The maximum X, Y, and Z size of the grid cell was 1/20 of the corresponding size of the space (Bjorn and Nielsen Citation2002). For the places with large temperature gradient and velocity gradients, such as exhaust outlet, air inlet, and gap, the meshes were locally refined. The gap, windows, and air inlet are all set as pressure inlet. A range hood was set as a velocity outlet. Solid wall boundary conditions (walls and door) and other boundary surfaces were set as no-slip boundary conditions. The time step was set at 0.05s. The number of grids and time steps passed the mesh independence.
RESULTS ANALYSIS
Ventilation and pollution status
Residential kitchen space in the cold region is small, so winter window ventilation causes a lot of heat loss in the kitchen. Residents sometimes use frying and long-term cooking methods such as steaming and stewing. Natural gas burns for a long time, and the firing position is high. Incomplete combustion products and particulate matter produced by cooking can produce serious air pollution in the kitchen. According to the questionnaire, most of the family cooks are women, mainly aged between 30 and 45. 38.3% of the family cooks in the Shenyang chose to close their doors and windows during cooking, and 52.4% of the respondents chose to open their windows but kept their angles at ~15° – 45°, which would lead to poor thermal environment in the kitchen. Moreover, the indoor and outdoor pressure difference in the cold region is relatively large. Under the action of thermal pressure, opening the window leads to a large amount of wind entering the room, resulting in poor airflow distribution in the kitchen and thermal discomfort of the kitchen staff.
According to the survey results on cooking methods and residents’ stay in their kitchens, the main cooking methods used by residents in the north are frying (58%) and steaming (23%). 30.9% of the residents stayed in the kitchen for more than 1 h. Intense and prolonged cooking is also a major contributor to air pollution in kitchens in the frigid region.
The results showed that the average PM2.5 and PM10 concentration of 30 representative kitchens in winter was 82.7 µg/m3 and 84 µg/m3, respectively. The equation for calculating the average value is shown in EquationEq. (8)(8)
(8)
Where ρ denotes the daily average PM2.5 concentration value in the kitchen, and n denotes the number of households being experimented.
PM2.5 exceeds the standard limits primarily because the northeast region of China entered the centralized heating period, thereby increasing the concentration of outdoor and indoor PM2.5 in winter. The formula for calculating the exceedance rate is given by EquationEq. (9)(9)
(9) :
Where N1 is the number of tested users whose indoor pollutants exceed the specified limit value; N is the total number of tested users.
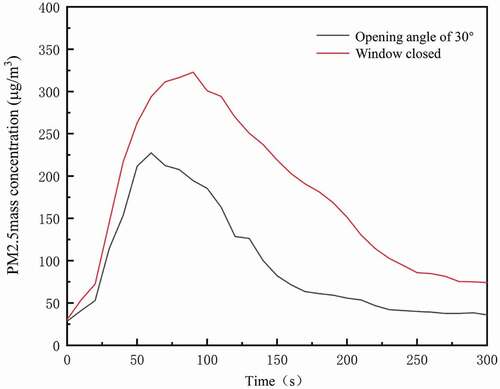
show the measurements of PM2.5 mass concentration in the breathing zone during the cooking. The data were from the measurements during the same participant’s cooking under the different ventilation condition. The emissions from the cooking under the different ventilation condition saw a similar trend as they both rose dramatically after the oil was heated and ingredients were added, reaching the peak point in the middle of cooking. However, the mass concentration of PM2.5 is significantly higher when the window is closed. Opening-window ventilation is more conducive to the discharge of indoor pollutants.
Figure 5. PM2.5 concentration change under different ventilation conditions.
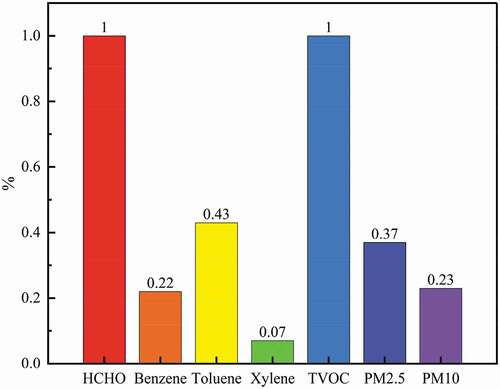
shows the exceedance rate of the concentrations of HCHO, benzene, toluene, xylene, Total Volatile Organic Compounds (TVOCs), PM2.5 and PM10, which were 100%, 22%, 43%, 7%, 100%, 37%, and 23%, respectively. The problem of kitchen pollution is obvious, even after turning on the range hood. The TVOC pollution in the winter was serious in the kitchen, and the average VOC concentration in the kitchen reached up to 1.2 mg/m3 (Wag, Huang, and Feng et al. Citation2020). The average HCHO concentrations during the initial cooking condition (i.e., firing for 5 min) and the cooking period were 0.154 and 0.194 mg/m3, respectively. Cooking activity did produce HCHO pollution, while frying produced more pollution than stewing. The phenomenon of HCHO and TVOC exceeding the standard limit often occurred during cooking. It was impacted by several factors, but insufficient ventilation is the primary reason.
Figure 6. Exceedance rate of pollutants of the residential kitchen.
Experimental validation of the simulation
shows the test results of the air change rate and the concentration of PM2.5 during cooking of a typical kitchen having only door and window infiltration and variable-scale window openings. Since residents were not used to keeping open doors and windows when cooking in winter, the demand for kitchen make-up air volume only by infiltration could not be met, and the kitchen remained in a state of negative pressure. According to the test results of make-up air volume, the window angle has a significant influence on the make-up air volume. When the window angle is larger, both the kitchen air change rate and the make-up air volume are increased. There is little difference in air change rate between window opening at 30° and window opening at 45° angle. The make-up air volume was 458 m3/h and 445 m3/h, respectively. The nameplate of the range hood indicated the exhaust air volume of 450 m3/h at low speed.
Table 3. Test results of the air change rate and the concentration of PM2.5 during cooking of ventilation by infiltration and variable-scale windowing ventilation.
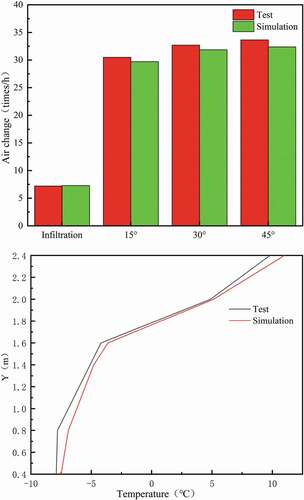
The CFD numerical simulations were performed according to the abovementioned four experimental conditions. shows the comparison between experimental and simulated results. The root-mean-square error between experimental and simulated data of air changes was 2.32, and the average relative error was 5.8%. The root-mean-square error between experimental and simulated data of the temperature distribution along the line (X = 0.9 m, Z = 1.7 m) was 0.69. The overall trend is almost similar. This showed good agreement between the experimental and simulation results. The discrepancy between the experimental result under the variable-scale windowing condition and simulation result, which could have resulted from the test error. During the infiltration test, CO2 was released into the kitchen for the first time. The CO2 concentration in the kitchen was unevenly distributed. The air change rate in the variable-scale windowing condition was much higher than that under the infiltration condition. Both the experiment and the simulation showed that the window opening angle of 30° could meet the needs of kitchen make-up air volume.
Figure 7. Comparison between experimental data and simulated data.
Simulation result
Simulation results of the airtight condition
When the range hood was turned on, only the air in the adjacent room could be infiltrated into the kitchen from the gap. No fresh air could enter the kitchen. The static pressure in the kitchen dropped instantly and stabilized at −667.75 Pa. The whole was under negative pressure, which affected the cooking effect. illustrates the distribution cloud map of temperature and CO2 mass fraction in the z = 1.4 m plane under the reference condition 1. Because of no fresh outdoor air in the kitchen, the temperature was higher during the cooking, resulting in high temperature in the kitchen, bringing a strong sense of discomfort to the cooking staff. The overall CO2 concentration was reduced to 729.02 ppm.
Figure 8. The distribution cloud map of z = 1.4 m cross-section temperature (left) and CO2 mass fraction (right) under the reference condition 1.
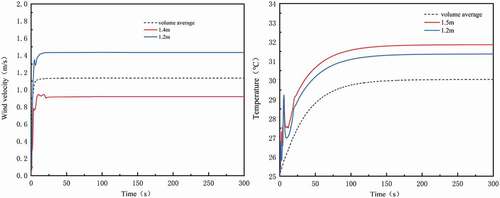
, . shows the simulation results of wind velocity and temperature in the kitchen room under infiltration conditions. The average wind velocity in the kitchen was stable at 1.1 m/s. The maximum wind speed reached 1.43 m/s at the position z = 1.2 m. The wind velocity at the person’s breathing point z = 1.4 m was 0.92 m/s. As per the GB/T 18883–2002 Indoor air quality standard, the comfortable indoor wind velocity during winter heating is 0.2 m/s (Pang Citation2013). The test showed a large amount of fresh air infiltration around the door. The gap of the wind speed-produced noise was larger. The average temperature around the body in the kitchen stabilizes at 30.04°C after 150 s, and the temperature at the breathing point z = 1.4 m is up to 31.85°C. During cooking, when the range hood is turned on, the infiltration effect alone cannot meet the air make-up requirement in the kitchen. The kitchen remains under negative pressure, affecting the discharge effect of pollutants. The temperature and wind velocity in the breathing area were high. The thermal comfort in the kitchen was poor.
Figure 9. Simulation results of wind velocity (left) and temperature (right) in the kitchen room under infiltration condition.
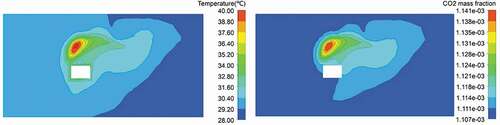
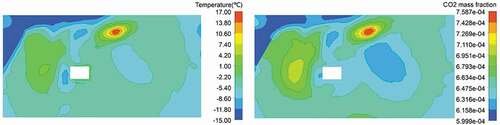
Figure 10. Distribution of z = 1.4 m section temperature (left) and CO2 mass fraction (right) when the window angle is 30°.
Simulation results of variable-scale windowing
When ventilation was carried out through variable-scale windowing, the pressure in the kitchen was stable at −1.59 Pa, −0.53 Pa, and −0.26 Pa. shows the distribution cloud map of temperature and CO2 mass fraction in section z = 1.4 m at the window angle of 30°. The experiment shows that the window opening- angle with the best air make-up effect in winter was 30°. The department analyzes the cloud map only when the window was opened at 30°. When the range hood is turned on, a large amount of fresh air enters the kitchen from the window, where the temperature and pollutant concentrations remain very low. However, because of an unstable airflow, the temperature in the cooking area, and the CO2 mass fraction change in a large step, and the eddies occur in small spaces.
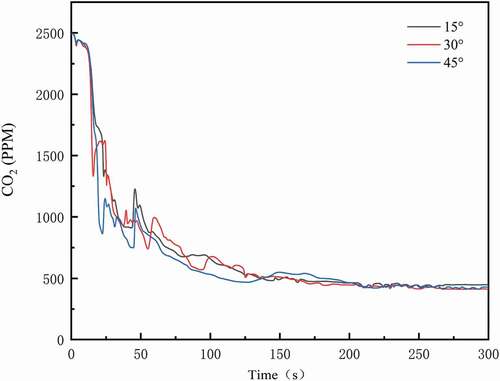
shows the simulation result of the change of CO2 concentration in the respiratory zone during variable-scale window ventilation. When fresh outdoor air enters the kitchen from the window, the decrease range of CO2 concentration increases with an increase of window opening angle and finally stabilizes at 450 ppm, 415 ppm, and 432 ppm, respectively. Window venting has a significant effect on the removal of contaminants from the kitchen.
Figure 11. Variation of CO2 concentration in the respiratory zone under variable-scale windowing ventilation.
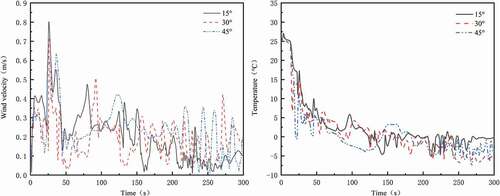
shows the simulation results of both wind velocity and temperature changes in the respiratory zone during variable-scale window ventilation. The wind velocity in the breathing area undergoes significant fluctuations due to the large amount of fresh outdoor air pouring in from the window. Outdoor weather conditions are severe in cold regions in winter. The indoor temperature drops rapidly when a window is opened. The most obvious drop is when the window is opened at 45°angle. The heat loss in the kitchen is remarkable.
Figure 12. Variation of wind velocity (left) and temperature (right) in the respiratory zone in variable-scale windowing ventilation.
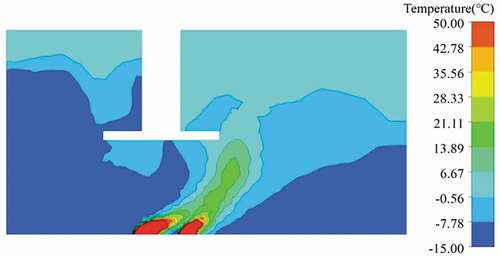
shows the temperature change cloud map of cross-section x = 0.3 m when the window is opened. Outdoor air enters the kitchen from the left side of the kitchen. The overall room temperature remains low. Because of the influence of air distribution, the cooking flame has a great swing. Although the opening of the window can quickly reduce the concentration of indoor pollutants, the airflow is unstable, which makes the cooking effect. Therefore, it is essential to explore the method of make-up air in a suitable cold area.
Figure 13. Temperature change cloud map of cross-section x = 0.3 m when the window is opened.
Simulation results of under design conditions
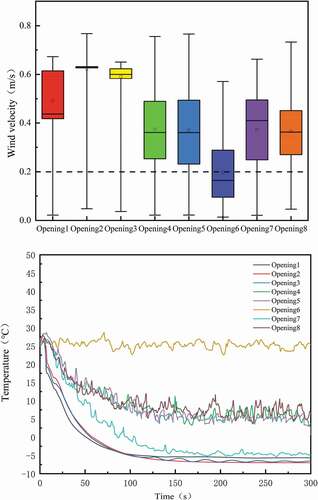
The design condition was to simulate the air distribution of the kitchen after the air inlet is set. In the eight make-up air forms, the pressure in the kitchen was maintained at – 0.21 Pa, – 20.01 Pa, – 19.66 Pa, – 116.01 Pa, – 18 Pa, – 16 Pa, – 0.1 Pa, – 102 Pa, respectively. The indoor CO2 concentration was stabilized at 464.65 ppm, 444.70 ppm, 443.75 ppm, 517.36 ppm, 597.41ppm, 464.65 ppm, 451.37 ppm, and 602.23 ppm, respectively. The temperature of the ceiling make-up air outlet is −11.2°C, −11.2°C, −10.6°C, −11.3°C, 6.3°C, 7.2°C, 6.3°C and 6.5°C respectively. This shows that the temperature at the ceiling make-up air vent is higher than the outdoor temperature. Opening 3 provides the best contaminant control compared to other operating conditions. Both opening 4 and opening 8 in the kitchen still had high negative pressure. As the pollution control situation was not ideal, the analysis was not discussed. The control of pollutants was better in the case of make-up air than in the case of infiltration. depicts the simulation results of wind velocity in the breathing zone under different design conditions. These results show that the temperature in the respiratory zone of opening 6 is almost kept at 25.5°C as compared with other working conditions, and the wind speed variation interval of the working conditions was small, and the mean value met the specification requirements.
Figure 14. Variation of wind velocity and temperature in the respiratory zone under different design conditions.
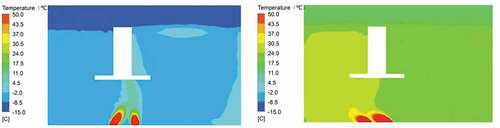
shows the CO2 mass fraction distribution clouds for the Z = 1.4 m section of opening 3 and opening 6, respectively. Since the air intake is directly associated with the outdoor atmosphere, the overall temperature in the kitchen becomes lower when the hood is turned on. Air from adjacent rooms seeps in from the right side of the kitchen, so the CO2 concentration is higher on the right side of the breathing zone and above the stove in the third working condition. Although the CO2 concentration is higher in opening 6 than in opening 3, it is more evenly distributed.
Figure 15. z = 1.4 m cross-sectional CO2 mass fraction at opening 3 (left) and opening 6 (right).

In order to better compare the air make-up of opening 1 and opening 3, the temperature cloud maps of both opening 1 and opening 3 at x = 0.3 m cross-section were compared. shows the temperature field of opening 1 and opening 3 at cross-section x = 0.3 m. Under the effect of pressure difference, a large amount of fresh gas enters the room from the air inlet. Opening 3 impacted cooking fires less. However, the relative temperature field of opening 6 is more suitable for human comfort. There is no obvious temperature gradient change in the temperature field in the kitchen. Overall, opening 3 was found more suitable for removing pollutants from the room, and opening 6 was found more suitable for people working in the kitchen.
Figure 16. Temperature field of oening 3 and opening 6 at cross-section x = 0.3 m.
shows the temperature and CO2 concentrations in the respiratory zone under the reference and the design conditions. Opening 3 and opening 6 experience a more uniform temperature distribution than the reference conditions. The difference in pollutant removal ability between the two openings make-up air methods compared to opening the window was small, though windows and make-up air are very good at removing pollutants from the house. However, opening windows can lead to uneven airflow distribution and unstable CO2 concentrations in the kitchen.
Figure 17. Comparison of respiration zone temperature (left) and CO2 concentration (right) under reference and design conditions.
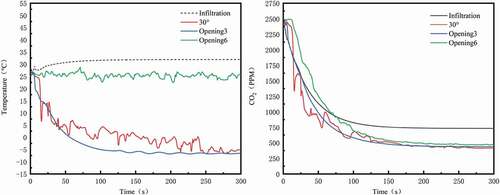
The difference between opening 3 and opening 6 is small for the average CO2 concentration across the room, even though opening 3 has a more reasonable distribution of CO2 on the breathing surface. In summary, it is better to open an air inlet in the ceiling than infiltration and opening 3. Under several conditions, such as temperature, pollutant concentration, wind speed, and negative room pressure, opening 6 helps optimize the indoor air quality, making it the most suitable make-up air method for residential areas in cold regions.
Conclusion
In the current study, questionnaires, on-site tests and CFD simulation were used to examine a pollution and ventilation case in Shenyang, China. The method of using ceiling openings to compensate for outdoor air supply was proposed and optimized in order to improve the air distribution in the residential kitchen. Different forms of ceiling air inlet are discussed in this study. The causes of serious pollution in residential kitchens in the severe cold region were revealed, and some important findings are as given below:
Experiment and numerical simulation showed that the air change rate in the kitchen with variable-scale window ventilation is much higher than that in the kitchen with infiltration ventilation alone. Ventilation could improve the emissions of pollutants and heat. When the window was opened at 30°, it could effectively control the concentration of pollutants in the kitchen.
The results of the questionnaire showed that residents’ cooking habits and ventilation habits are important factors that contribute to kitchen pollution in the severe cold region. The test results for pollutants, whether during cooking or in a closed state before cooking in the kitchen, showed that various pollutants in the residential kitchen in the severe cold region were present more than the standard limits. Especially, the exceedance rate of HCHO and TVOC standard was by up to 100% in all test subjects under closed conditions before cooking. Therefore, future studies on the reduction of kitchen pollutants would be of immense significance to alleviate the problem of kitchen pollution in Northeast China.
Through the numerical simulation of the air quality, temperature field, and wind velocity fields of the kitchen, it is observed that irregular airflow causes diffusion of the smoke. A kitchen is under uncomfortable negative pressure under infiltration. The pollutant concentration and temperature are relatively higher. Although the pollutant is well controlled when the window remains open, the airflow fluctuates greatly, significantly influencing the cooking flame. After opening the air inlet in the ceiling, the static pressure of the kitchen was stable at −19.66 Pa, without odor. Temperature, wind velocity, and pollutant concentration remained stable. The reasonable air distribution could create a more suitable kitchen-cooking environment for the residents in cold regions.
When the ceiling is set up two areas of
make-up air outlet, and its location arranged in the innermost room, the ceiling can prove to be an excellent fresh air preheating system, thereby ensuring an optimal working area in terms of temperature, air velocity, pollutant concentration, and room pressure. The CO2 concentration is stable at 464.65 ppm. From the viewpoint of thermal comfort and capability to control the pollutant, this ventilation strategy is the most suitable for severe cold regions, space-saving make-up air.
Disclosure statement
No potential conflict of interest was reported by the author(s).
Additional information
Funding
Notes on contributors
Kailiang Huang
Kailiang Huang is a professor at the School of Municipal and Environmental Engineering, Shenyang Jianzhu University in Shenyang, China.
Runsheng Wang
Runsheng Wang is in the Master's program at the School of Municipal and Environmental Engineering, Shenyang Jianzhu University, China.
Guohui Feng
Guohui Feng is a professor at the School of Municipal and Environmental Engineering, Shenyang Jianzhu University in Shenyang, China.
Jun Wang
Jun Wang is in the Master's program at the School of Municipal and Environmental Engineering, Shenyang Jianzhu University in Shenyang, China.
Minghui Yu
Minghui Yu is in the Master's program at the School of Municipal and Environmental Engineering, Shenyang Jianzhu University in Shenyang, China.
Na He
Na He is in the Ph.D. program at the School of Municipal and Environmental Engineering, Shenyang Jianzhu University in Shenyang, China.
References
- Bjorn, E., and P. V. Nielsen. 2002. Dispersal of exhaled air and personal exposure in displacement ventilated rooms[J]. Indoor Air 12 (3):147–64. doi:10.1034/j.1600-0668.2002.08126.x.
- Cascetta, F. 1996. Experimental evaluation of the velocity fields for local exhaust hoods with circular and rectangular openings[J]. Building and Environment 31 (5):437–49. doi:10.1016/0360-1323(96)00011-X.
- Chang, K. 2016. Current situation and improvement measures of air quality in residential kitchen in chongqing [D]. Chongqing: Chongqing University.
- Chen, Z., J. Xin, and P. Liu. 2020. Air quality and thermal comfort analysis of kitchen environment with CFD simulation and experimental calibration [J]. Building and Environment 172:106691. doi:10.1016/j.buildenv.2020.106691.
- Du, B., J. Gao, J. Chen, et al. 2017. Particle exposure level and potential health risks of domestic Chinese cooking[J]. Building and Environment 123:564–74. doi:10.1016/j.buildenv.2017.07.031.
- Gao, J., C. Cao, et al. 2013. Determination of dynamic intake fraction of cooking-generated particles in the kitchen[J]. Building and Environment 65:146–53. doi:10.1016/j.buildenv.2013.04.006.
- GB/T 18204.18-2013. 2013. Public health testing methods - part 1: Physical factors [S].
- Han, O., A. Li, and R. Kosonen. 2019. Hood performance and capture efficiency of kitchens: A review[J]. Building and Environment 161:106221. doi:10.1016/j.buildenv.2019.106221.
- Jiasen, S. 2019. Research on indoor air quality monitoring and window opening strategy of residential buildings in Liaoning [D]. In Shenyang Jianzhu University.
- Kim, Y. S., I. S. Walker, and W. W. Delp. 2018. Development of a standard capture efficiency test method for residential kitchen ventilation[J]. Science and Technology for the Built Environment 24 (2):176–87. doi:10.1080/23744731.2017.1416171.
- Kosonen, R. 2007. The effect of supply air systems on the efficiency of a ventilated ceiling[J]. Building and Environment 42 (4):1613–23. doi:10.1016/j.buildenv.2005.09.030.
- Liu, S., Q. Cao, X. Zhao, et al. 2020. Improving indoor air quality and thermal comfort in residential kitchens with a new ventilation system[J]. Building and Environment 180:107016. doi:10.1016/j.buildenv.2020.107016.
- Liu, S. 1999. The invisible killer in the kitchen [J]. China Health Nutrition (5):23–23.
- Lu, S., B. Zhou, J. Zhang, et al. 2021. Performance evaluation of make-up air systems for pollutant removal from gas stove in residential kitchen by using a push-pull ventilation system[J]. Energy and Buildings. 240(1–3):110907. doi:10.1016/j.enbuild.2021.110907.
- Pang, L. 2013. Study on kitchen ventilation and energy saving in residential buildings [D]. Shenyang: Shenyang Jianzhu University.
- Saha, S., A. Guha, et al. 2012. Experimental and computational investigation of indoor air quality inside several community kitchens in a large campus[J]. Building and Environment 52:177–90. doi:10.1016/j.buildenv.2011.10.015.
- Swierczyna, R., P. Sobiski, and D. Fisher. 2006. Effects of appliance diversity and position on commercial kitchen hood performance. Ashrae Transactions 112:591–602.
- Wag, J., K. Huang, G. Feng, et al. 2020. Analysis of winter formaldehyde and volatile organic compound pollution characteristics of residential kitchens in severe cold regions of northeast China[J]. Indoor and Built Environment:1420326X2093746.
- Wan, X., Y. Likui, and H. Hou. 2005. Effect of kitchen smoke on indoor air quality and its improvement methods [J]. Building Thermal Ventilation and Air Conditioning 24:3.
- Wang, L., Z. Xiang, et al. 2017. Role of Chinese cooking emissions on ambient air quality and human health[J]. Science of the Total Environment 589:173–81. doi:10.1016/j.scitotenv.2017.02.124.
- Wang, M. 2015. Simulation study on the influence of kitchen structure and layout on kitchen air quality [D]. In Xi’an University of Architecture and Technology.
- Wang, Y., H. Li, and G. Feng. 2020. Simulating the influence of exhaust hood position on ultrafine particles during a cooking process in the residential kitchen[J]. Building Simulation 13 (6):6. doi:10.1007/s12273-020-0640-3.
- Xu, A., H. X. Li, and G. H. Feng. 2017. Numerical simulation analysis of temperature and pollutant concentration diffusion in the open kitchen cooking area[J]. Procedia Engineering 205:1165–72. doi:10.1016/j.proeng.2017.10.186.
- Yi, K. W., Y. I. Kim, and G. N. Bae. 2016. Effect of air flow rates on concurrent supply and exhaust kitchen ventilation system[J]. Indoor and Built Environment 25 (1):180–90. doi:10.1177/1420326X14541558.
- Zhang, C. 2016. Environmental and health risk assessment of point high-rise residential buildings in chongqing in winter [D]. Chongqing: chongqing University.
- Zhao, Y., A. Li, P. Tao, et al. 2013. The impact of various hood shapes, and side panel and exhaust duct arrangements, on the performance of typical Chinese style cooking hoods[J]. Building Simulation. 6(2):139–49. doi:10.1007/s12273-012-0096-1.
- Zhao, Y., and B. Zhao. 2020. Reducing human exposure to PM2. 5 generated while cooking typical Chinese cuisine [J]. Building and Environment 168:106522. doi:10.1016/j.buildenv.2019.106522.
- Zhou, B., F. Chen, et al. 2016. Study on pollution control in residential kitchen based on the push-pull ventilation system[J]. Building and Environment 107:99–112. doi:10.1016/j.buildenv.2016.07.022.
- Zhou, B., P. Wei, M. Tan, et al. 2019. Capture efficiency and thermal comfort in Chinese residential kitchen with push-pull ventilation system in winter-a field study[J]. Building and Environment 149:182–95. doi:10.1016/j.buildenv.2018.12.017.
- Zibo, X. 2019. Environmental simulation study for residential kitchens in hot summer and cold winter regions[D]. Harbin Institute of Technology.
APPENDIX
Questionnaire
Thank you very much for taking the time to participate in this survey organized by School of Municipal and Environmental Engineering, Shenyang Jianzhu University. The main content of this questionnaire is ventilation status of the residential kitchens in winter in severe cold region of China. Please answer the following questions according to your situation. This questionnaire is of great significance to the research on improving kitchen air quality in severe cold region. We will also keep your personal information confidential.
What is your home address? – –
What is the age of the person who usually cooks in your family? – –
What is the gender of the family member who often cooks at home? – –
What is the floor number of your house? – –
What is the floor area of your kitchen? – –
Is there a range hood in the kitchen? (yes or no)
Does the kitchen have external windows? (yes or no)
Do the family member who often cook usually choose to open and close doors and windows during cooking?
All closed
All open
Open the window
Open the door
What is the common cooking style?
Frying
Stewing
Steaming
Others
How long does the kitchen window stay open in winter?
0.5 hour
1 hour
1.5 hours
2 hours
>2.5 hours
What is the opening Angle of the kitchen window in winter?
15°
15°~45°
45°~90°
90°