
ABSTRACT
Air pollution is one of the major risk factors contributing to adverse public health outcomes worldwide. Fine particulate matter (PM2.5) has been repeatedly associated with increased risk of cardiovascular events, including heart attacks. Because PM2.5 is unequally distributed with elevated concentrations near high-traffic and industrial zones, PM2.5 is an environmental justice issue of major public health concern. In this study, we reviewed the relationship between PM2.5, emergency visits due to heart attacks, and environmental justice in San Diego County using data from CalEnviroScreen 3.0. Our results indicate that PM2.5, diesel PM emissions, and emergency visits due to heart attacks are weakly, but positively correlated (r = 0.3, R2 < 0.1). Areas classified as environmental justice communities, communities comprised more dominantly of nonwhite populations, and communities closer to the San Diego-Tijuana border are exposed disproportionately to air pollution in San Diego County. Overall, this work demonstrates that there is an association between elevated local PM concentrations in San Diego County communities with emergency hospital visits due to heart attacks, and that these associations are an environmental justice issue disproportionally affecting disadvantaged communities.
Implications: Particulate matter is an adverse contributor to overall health throughout the lifespan, contributing to diseases such as asthma, hypertension, stroke, and increased risk of cardiovascular events. Here, we assess the relationship between particulate matter and heart attacks in San Diego County using CalEnviroScreen3.0. Using these tools, we also examine correlations between this relationship and different sociodemographic indicators such as age, race, income, and proximity to the high-traffic U.S.–Mexico border. Overall, we show that specific communities around San Diego are more highly exposed to particulate matter, and that these relationships may be disproportionately contributing to heart attacks in disadvantaged communities.
Introduction
San Diego is the fifth largest county in the U.S. with nearly 3.4 million residents in approximately 4300 square miles (Viswanathan et al. Citation2006). San Diego County is comprised of 18 cities with variety of neighborhoods. Historically, air quality of the greater San Diego was and remains a concern due to presence of higher concentrations of ozone and Particulate Matter (PM) of aerodynamic diameter of 2.5 µm, widely known as PM2.5 (Aguilera et al. Citation2021; Lurmann, Avol, and Gilliland Citation2015). PM2.5 is defined as any inhalable solid or liquid substance with an aerodynamic diameter ≤2.5 µm (Du et al. Citation2016), and along with ozone are key pollutants used to determine air quality indexes. The worsening air quality is perhaps compounded by the topography of the region, with air currents frequently flowing inland off of the Pacific Ocean and somewhat bound by mountains on the eastern county border. Major factors that influence air quality include emissions associated with border activity, eastern mountain gate, occasional Santa Ana wind and Southern California’s fire hazard (Aguilera et al. Citation2021). Particulate matter, especially PM2.5 is one of the most important drivers of poor air quality around San Diego County (Du et al. Citation2016). Different sources have been identified as responsible for PM2.5, including factors such as diesel combustion and wildfire emissions. Diesel exhaust PM, from now on referred as diesel PM in this study, is an important component of PM2.5 which is the emission from trucks, buses, trains, ships and other transportation and equipment with diesel engine, and has been hypothesized as responsible for increase in susceptibility to adult cardiovascular disease (Weldy et al. Citation2013). Diesel PM are PM2.5 particles typically smaller than 1 µm in size (California Air Resources Board Citation2021a).
PM2.5 and diesel PM are common air pollutants and when inhaled, can penetrate alveoli within the lungs, cross into bloodstream and cause detrimental effects on human health such as asthma, chronic lung disease, emphysema, and pneumonia. However, some of the most dangerous consequences of PM2.5 are cardiovascular issues, such as heart attacks (Du et al. Citation2016). The association between PM2.5 and heart attacks has been studied in several epidemiological research over the last few decades (Brook et al. Citation2010). Many of the existing studies have taken the short-term exposure of PM2.5 and have taken cross-functional dependency on personal characteristics such as body mass index and preexisting diseases (Brook et al. Citation2010; Zeka et al. Citation2006) into account. Extensive studies have been done on how much these personal characteristics have altered the relation between cardiovascular hospitalization and PM2.5 (Zeka et al. Citation2006). Like PM2.5, diesel PM has been hypothesized to contribute to increased susceptibility of adult cardiovascular disease (Weldy et al. Citation2013). The California Air Resources Board estimated that diesel PM contributed to approximately 1,400 premature cardiovascular deaths annually between the years 2009–2011, and also that PM2.5 contributed to 7,300–11,000 premature cardiovascular deaths annually between 2006 and 2008 (California Air Resources Board Citation2018, Citation2021b).
Air pollution, especially PM2.5, has been widely linked with environmental inequity (Morello-Frosch and Jesdale Citation2006; Morello-Frosch, Pastor, and Sadd Citation2001; Pastor, Morello-Frosch, and Sadd Citation2005; Quintana et al. Citation2014), and has been a focus for many programs and studies assessing environmental justice. According to California statutory law, environmental justice can be defined as “Fair treatment of people of all races, cultures, and incomes with respect to the development, adoption, implementation, and enforcement of environmental laws, regulations, and policies” (California Government Code Section 65,040.12, 2019). Environmental justice considers disproportionate impacts of air pollution by demography, including factors such as race, age, and poverty. Environmental inequity in distribution of particulate matter emission sources in the U.S. is a well-documented environmental justice issue (Mikati et al. Citation2018). For instance, black children and children living under poverty line experience higher Asthma rates compared to national average (13.4% and 11.1%, respectively), and has 10 times greater rates of death than non-Hispanic white children (Population Reference Bureau Citation2019). To improve the public health of disadvantaged communities, California Senate Bill 535 (SB535) was introduced in 2012, authorized by California Global Warming Solutions Act of 2006 (California Office of Environmental Health Hazard Assessment, Citation2017). SB535 bill mandates that 25% of proceeds coming from Greenhouse Gas Reduction Fund will be utilized in projects which provides benefit to disadvantaged communities. Disadvantaged communities are those who suffer most due to environmental, health and economic burden, and are identified by the state of California by collecting (California Public Utilities Commission Citation2021) census tract-specific information using CalEnviroScreen tool and assigning a score against the specific burden.
The border between California and Baja California is an extensive manufacturing and agricultural trade path between U.S. and Mexico, and heavily depends on migrant workers. The combined transborder metropolitan population of San Diego-Tijuana and Imperial Valley-Mexicali border area is nearly 5.5 million and suffers from poor air and water quality and toxic chemical disposal (NSCEP Citation2010). Extensive trade commodities exchange, transportation via heavy duty diesel trucks, and low-wage jobs which generally have higher exposure to toxic materials, have made the population around that region more vulnerable to environmental pollution, motivating research of the equity and impacts of the pollution burden.
Though PM2.5 is linked individually with heart attacks hospitalization and environmental justice, little is known about the inter-dependent relationship among PM2.5, emergency visit due to heart attacks and environmental justice in San Diego County. In this study, we examine the association between localized PM2.5 and diesel PM with emergency visit due to heart attacks in San Diego County. We used CalEnviroScreen 3.0, a census tract based cumulative impact screening methodology used by Office of Environmental Health Hazard Assessment (OEHHA) at the California Environmental Protection Agency (CalEPA). Here, we used CalEnviroScreen 3.0 data for analysis and assess the relationship between ambient PM2.5 and diesel emission with demographic indicators of health disparities throughout San Diego County, especially in the regions where environmental justice is a concern such as the border communities of San Ysidro and Otay Mesa. We hypothesized that the relationship between PM2.5, diesel PM, and emergency visit due to heart attack may disproportionally affect SB535 communities and racial minorities in San Diego County.
Methods
Background of the data
This study analyzed the association between PM2.5 and the emergency hospital visit for the heart attacks in San Diego County. The primary components of the data are PM2.5 values and rates of hospitalization, both of which were used as secondary data collected from CalEnviroScreen 3.0, a screening tool developed by OEHHA in California and CalEPA. Mean data was downloaded from CalEnviroScreen 3.0 website and later post-processed for data analysis of variables including, but not limited to, census tract, zip code, distance from the US–Mexico border, PM2.5, and diesel PM. The distribution of data was not provided by CalEnviroScreen 3.0, hence was not considered for data analysis. The base data is estimated for 2012, when diesel PM (2012), and PM2.5 (2006–2012; 2012–2014) and emergency visits for heart attacks (2011–2013) were all available.
PM2.5 data collection
CalEnviroScreen 3.0 tool uses a Negative Binomial mixed model to quantify PM2.5. To compute quarterly means of PM2.5 concentration, CalEnviroScreen 3.0 tool accounted for data from 8 air monitoring sites in San Diego County (Alpine, Camp Pendleton, Chula Vista, El Cajon, Otay Mesa and San Diego) from 2012 to 2014 (California Air Resources Board Citation2021a). Then the tool used spatial/geostatistical modeling (Ordinary Kriging) to estimate PM2.5 within 50 km of the air monitoring station. Satellite data for the years 2006–2012 was used to predict PM2.5 for location beyond 50 km of the station. Out of 107 zip codes in San Diego County, CalEnviroScreen 3.0 covers data from 93 zip codes and 628 census tracks (California Air Resources Board Citation2021a).
Diesel PM data collection
California Air Resources Board (CARB) takes on-road and non-road sources into account to calculate diesel PM data based on a summer day in July 2012. For on-road sources, EMFAC2013 model was utilized to do a county-wide estimate of diesel PM emissions on a July weekday with a spatially distributed 4 × 4 km grid cell based on regional vehicle activity distribution (California Air Resources Board Citation2014). For non-road emission, the source of emission is CARB’s emission inventory forecasting program, which uses California Emission Projection and Analysis Model (CEPAM) where emission estimates are 4 × 4 km grids based on gridded spatial surrogate datasets, also for a July weekday (California Air Resources Board Citation2009). For census tracts overlapping multiple grids, diesel PM weighted averages across the entire census tract were used, based on the populated portion of each census tract (California Office of Environmental Health Hazard Assessment Citation2017). Since the U.S.–Mexico border area is a high diesel PM zone, the emission data received from the above methods are compared with PM measurements estimated diesel PM measurement from Calexico and Otay Mesa monitors using measured NOx as a surrogate for 2012 (Rodriquez and Zeise Citation2017).
Emergency visits due to heart attacks
The California Office of Statewide Health Planning and Development collects information on emergency department visits and hospitalizations from different causes in California, including heart attacks (Office of Statewide Health Planning and Development Citation2020). For CalEnviroScreen 3.0, cardiovascular hospitalizations are characterized by emergency hospital visits specifically for heart attacks during the period (2011–2013). Therefore, these represent all emergency visits where the principal diagnosis was heart attack. Age-adjusted rates of emergency hospital visits for heart attacks were calculated for different zip codes, which were later reapportioned to census tracts. Zip codes with at least 12 emergency visits are considered for calculation.
Socioeconomic and racial community data
In this study, we used five socioeconomic vulnerability variables to assess the relationship of different demographic indicators with PM2.5 and heart attacks. These variables include educational attainment (percentage of population not having a high school degree), linguistic isolation (percentage of limited English-speaking household), poverty (percentage of the population living below half the federal poverty level), unemployment (percentage of population over age 16 that is unemployed and eligible for the labor force) and housing (percentage of households in a census tract that are both low incomes, and severely burdened by housing costs). These indicators were scored and indexed statewide in CalEnviroScreen 3.0, and they were originally sourced from the U.S. Census Bureau’s American Community Survey (2011–2015) and U.S. Housing and Urban Development’s Comprehensive Housing Affordability Strategy Data (2009–2013) (California Office of Environmental Health Hazard Assessment Citation2017).
California Senate Bill (SB) 535 is a California bill introduced in 2012 under Global Warming Solution Act of 2006 to reduce greenhouse gas emission in California. According to this bill, companies operating in California must purchase extra credit for exceeding allotted greenhouse gas emission limit, and 25% of that revenue need to be spent for disadvantaged communities. CalEPA used CalEnviroScreen 3.0 tool to determine disadvantaged communities in 2017 and published updated list in 2018. The factors considered to identify disadvantaged communities include ozone and PM concentration in the air, diesel PM emission, traffic density, drinking water quality and many others (California Senate Bill No. 535 Citation2012). In this study, the effect of PM2.5 and heart attacks hospitalization have been analyzed in disadvantaged communities.
We evaluated potential associations between populations of different age and racial groups with different socioeconomic factors using data from the 2010 decennial census () for overall San Diego County and District 8 of San Diego County. District 8 is a combination of locations in San Diego County with high traffic volume and close vicinity to border; and consists of four zip codes (92102, 92113, 92154, 92173) which includes communities such as Barrio Logan, Logan Heights, Otay Mesa, and San Ysidro (The City of San Diego Citation2021). The age groups are categorized as children under 10 years old; population 10–64 years old; and elderly age 65 and older. Racial categories considered are: American Indians/Alaska Natives, Asian Americans, Blacks/African Americans, Hispanics/Latinos, Native Hawaiians and other Pacific Islanders, and White (non-Hispanic), as per the National Institute on Minority Health and Health Disparities population list (NIMHD Citation2021). Socioeconomic factors considered are education, linguistic isolation, poverty, unemployment, and low-income households. provides a baseline for understanding the relationship and further data analysis regarding environmental justice.
Table 1. Sociodemographic population data for San Diego County (based on US 2010 Census data)
The traffic at the U.S.–Mexico border in San Ysidro is significant, and to assess whether it contributes to increased PM2.5 and corresponding disparities, latitude distance from U.S.-Mexico border in San Ysidro has been calculated in km. CalEnviroScreen 3.0 provides the latitude of each census tract, along with the latitude of San Ysidro border. The distance of each census to the border has been calculated by linear difference of their respective latitudes and converting them to km.
Statistical analysis
Data obtained from CalEnviroScreen 3.0 were analyzed using RStudio version 1.3.959 and SPSS statistical modeling software. Results were analyzed using Microsoft Excel plots, and plots were generated using R, SPSS, and Excel. Linear regression was used to characterize the relationships among variables such as PM2.5, emergency visits due to heart attacks hospitalizations, ethnicity, race, and other demographic factors. A Pearson correlation matrix has been created to observe the relationship between ambient PM2.5 and demographic indicators to demographic indicators. Environmental data were stratified into quantiles to further assess environmental justice relationships.
Results and discussion
Relationship between particulate matter pollution and emergency visits due to heart attack
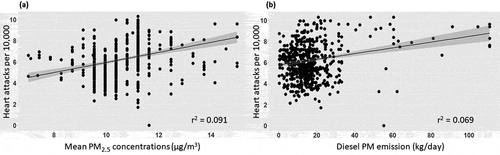
According to the World Health Organization (WHO), every year about 17.3 million people die because of cardiovascular disease where inhaling PM2.5 is a prominent factor besides the genetic and behavioral risk factor such as unhealthy diet, physical activity, and smoker status (Wang et al. Citation2015). In this study, we explored the emergency visit for heart attacks with exposure to PM2.5 and diesel PM in San Diego County. The age-adjusted rate of emergency visit for heart attacks per 10,000 people is positively but only weakly correlated with both PM2.5 (R2 = 0.091; regression coefficient = 0.476) and diesel PM (R2 = 0.069; regression coefficient = 0.272) in San Diego County ().
Figure 1. Relationship between particulate matter and heart attack in San Diego County. Data was obtained and analyzed using CalEnviroScreen 3.0. Scatter plots and the corresponding regression lines for the relationship between (a) age-adjusted rate of emergency visit for heart attacks per 10,000 and annual mean PM2.5 concentration, and (b) age-adjusted rate of emergency visit for heart attacks per 10,000 and diesel PM emissions from on-road and non-road sources
Numerous studies indicate that asthma is highly correlated with particulate matter pollution (Baldacci, Citation2015; Zhang et al. Citation2016). Likewise, the positive association between asthma and heart attacks is well-documented (Xu, Xu, and Yang Citation2017). For this reason, we assessed the relationship between emergency department visit for asthma and heart attack rates per 10,000 in San Diego County (Figure S1), and as expected, a positive correlation between these variables (R2 = 0.563) was observed. Asthma may be a modifying factor behind our observed relationship between PM and heart attacks in San Diego County.
Correlations between particulate matter, heart attack, and demographic indicators
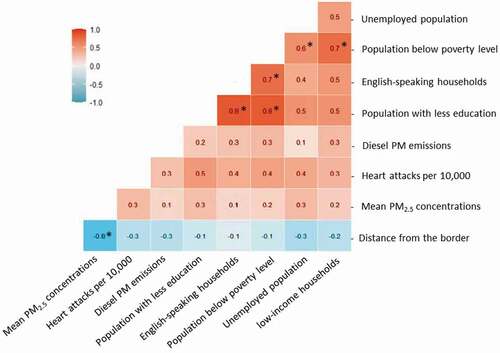
A correlation coefficient matrix was constructed to observe relationships between demographic indicators and pollution burden (). The dark orange boxes indicate that there is a strong positive correlation between population over 25 with less than a high school education and limited English-speaking households and population who are living below the federal poverty level. Most of the boxes represent little association between the variables. A strong negative association has been observed between mean PM2.5 concentration and distance from the San Ysidro border.
Figure 2. Correlation matrices of demographic indicators and different variables. Data was collected from CalEnviroScreen 3.0. The value in each boxes displays the correlation coefficient (R) between two variables. The legend on the left side shows the values range between −1.0 and 1.0. Asterisks (*) denotes a strong correlation between variables (R2 ≥ 0.6)
Associations between particulate matter, heart attack, and race
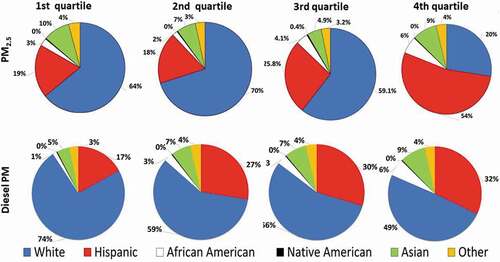
We stratified the PM2.5 and diesel PM concentration estimate for census tracts into quartiles and characterized the racial and ethnic diversity characteristics of tracts in the context of air pollution (). As air pollution burden increases with each quartile, the percentage of the population identifying as white decreases. Comparing the first and fourth quartiles, the percent of the population identifying as white decreases from 64% to 20% for PM2.5, and decreases from 74% to 49% from diesel PM. For PM2.5, Hispanics constitute the majority of the 4th quartile, suggesting that Hispanics are most likely to be exposed to the greatest concentrations of PM2.5 in San Diego County.
Figure 3. Particulate matter pollution exposure by different race/ethnicity. Data was gathered and assessed using CalEnviroScreen 3.0. PM2.5 and diesel PM values grouped in four quartiles from low to high. The above Pie charts represent the percentage change among six different ethnicities due to exposure to different PM2.5 quartiles and diesel PM, respectively
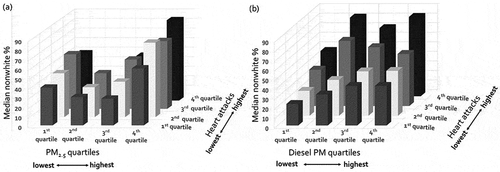
We also assessed the relationship between particulate matter, emergency visit due to heart attacks, and population racial characteristics to better visualize the contributions of sociodemographic influences to this relationship (). To quantify such contributions, we stratified the data into quartiles for both air pollution and heart attacks hospitalizations, resulting in 16 distinct hierarchical groups. For both PM2.5 and diesel PM, the nonwhite percent of the population tended to increase with increasing PM and emergency visit due to heart attacks. This data suggests that the odds of elevated PM2.5 exposure (>10 µg/m3) were 67% higher in nonwhite communities than white communities.
Figure 4. Nonwhite percentage of population based on PM and heart attack quartiles. Data was collected and plotted using CalEnviroScreen 3.0.The 3-dimesional bar plots for emergeny visit due to heart attack for different (a)PM2.5 quartiles and (b) diesel PM quartiles with respect to median nonwhite percentage
We brought demographic indicators as another variable to break down the analysis and showed racial diversity plays an important role in heart attack rates (). Studies found that exposure to PM2.5 in different ethnic group is disproportionately linked (Yitshak-Sade et al. Citation2020). Our data indicates that Hispanic communities are more exposed to PM2.5 and diesel PM than primarily White communities (). shows a clear relationship between PM2.5/diesel PM, heart attack and racial profile (median nonwhite percentage) where each data is presented as quartiles. Overall, this data demonstrates the disproportionate pollution burden and negative health outcomes that nonwhite communities face, which is consistent with our hypothesis.
Relationship between particulate matter, heart attack, and distance to the U.S.–Mexico border
Because of the high volume of vehicular traffic at the U.S.–Mexico border in Tijuana-San Ysidro, we also explored the relationship between PM2.5, diesel PM, and heart attacks and distance to the U.S.–Mexico border (). The San Ysidro Port of Entry is the busiest land border crossing in the world, with more than 70,000 vehicles entering the US from Mexico daily (US General Services Administration Citation2021). For this reason, PM2.5 concentrations are highest near the San Ysidro border, and decrease in census tracts moving northward and away from the border (R2 = 0.724, ). Though there is a similar decreasing relationship between diesel PM and distance to the border, this is a weak association (R2 = 0.066; ). The high peak observed () at just less than 20 km is likely to be caused by high downtown and naval port traffic around that area (). Similarly, the number of heart attacks is only weakly decreased as distance from the border is increased (R2 = 0.065; ). District 8 is comprised of neighborhoods at the border such as San Ysidro and Otay Mesa, and this district has greater racial diversity than other San Diego regions (as detailed in ). Because PM2.5 is greatest near the border, this demonstrates a basis for environmental unequality ().
Figure 5. Association between PM, heart attacks and distance to the U.S.-Mexico border. Data obtained and analyzed using CalEnviroScreen 3.0. The scatterplots display negative correlation between (a) mean PM2.5 and distance from San Ysidro border (in kilometers) (b) diesel PM emission and distance from the San Ysidro border (in kilometers). (c) heart attack per 10,000 and distance from the San Ysidro border (in kilometers). (d-f) Heat maps showing the geographic distribution of PM2.5 (d), diesel PM (e), and heart attack rates (f) in San Diego County
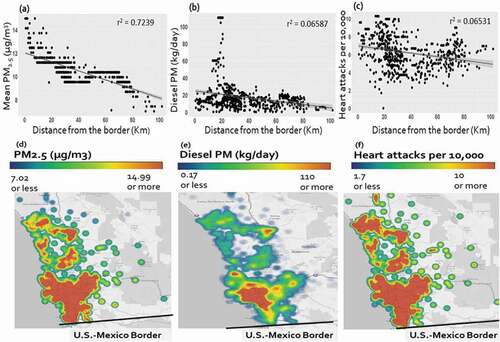
Furthermore, the relation between PM, emergency visits due to heart attacks and distance to San Diego-Tijuana San Ysidro border has been explored. The San Ysidro border crossing between the U.S and Mexico is a high-traffic area, and the neighboring San Ysidro community is primarily Hispanic and with per capita income well below the U.S. average. The community members of this area are unequally affected by particulate matter pollution (PM2.5 and diesel PM) concentrated at the border port of entry (Quintana et al. Citation2015). is a clear indicator that the vicinity to border areas has high PM concentration, leading to higher emergency visits for heart attacks. This outcome also emphasizes the need for better and stricter public health policy regulations close to U.S.–Mexico border, which is clearly the habitat of disadvantaged communities.
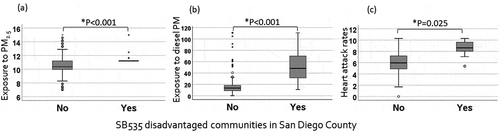
SB535 disadvantaged communities and environmental justice
Lastly, we explored the relationship between particulate matter, heart attacks, and SB535 classified disadvantaged communities (). Both PM2.5 and diesel PM were significantly higher in disadvantaged communities (p < .001). Emergency visit due to heart attack rates are also higher in disadvantaged communities (p = .025; ). It is evident from ) that pollution burden is not equally distributed among communities. Since exposure to PM can cause asthma and other respiratory illness (Baldacci, Citation2015), the population in disadvantaged communities are more likely to suffer from other issues which have higher implications related to breathing, such as Covid-19. Hence, to protect disadvantaged communities, stricter and more meaningful public health actions and policies are needed.
Figure 6. Particulate matter exposure and heart attack rates in SB535 disadvantaged communities. Data was collected from CalEnviroScreen 3.0. Above boxplots with standard error plotted to depict the distribution of SB535 disadvantaged communities against different social burden. The top line, the center bolded line, and the bottom line in each box represent the 75%-ile, 50%-ile (median), and the 25%-ile of the distribution along with their respective p-values. The center bolded line represent the mean and the dots that are outside of the data points outside five standard deviations from the mean
Limitations and future directions
As all the census tracts do not have their own air monitors, CalEnviroScreen tool rely on geostatistical modeling to interpolate PM2.5 data where there is no air monitor. This data is based on average annual PM concentration, and may miss periods of peak ambient PM, such as during wildfire season. These periods of immense air pollution are likely to impact the emergency visit due to heart attack significantly and cannot be captured using CalEnviroScreen 3.0. CalEnviroScreen version 4 is currently under review, and once published, is expected to provide improved spatial resolution and more recent data sets for analysis. In CalEnviroScreen 4.0, PM2.5 concentration data are estimated for 1 km satellite grid cell within 50 Km of the center of the grid cell and diesel PM are estimated for 1 km satellite grid cell for cartesian grid system. This satellite-based CalEnviroScreen 4.0 data is derived from AOD (Aerosol Optical Depth) measurements, land use, and meteorological data from the air monitor (Draft CalEnviroScreen 4.0 Citation2021). The overall PM values are calculated using satellite data and air monitor data with assigned weight values. Since CalEnviroScreen 4.0 increases frequency and spatial resolution of PM assessment, it is expected that it will help uncover additional environmental inequity and analysis based on CalEnviroScreen 4.0 will help introduce more accurate and stringent public health policies. Hence, analysis based on CalEnviroScreen 4.0 remains a topic for further future research.
Conclusion
Our study discussed the impacts of air pollution, particularly PM2.5 and diesel PM, on human health and explored whether there is an association between particulate matter pollution, emergency visits due to heart attacks, and social factors in San Diego County. We hypothesized that PM increases incidence of emergency visit due to heart attack, and that these relationships are worse in racially diverse and disadvantaged communities. With the help of CalEnviroScreen 3.0 tool, we establish a baseline environmental justice assessment for public health policy in San Diego County. Our study observed positive associations between PM2.5, diesel PM, and heart attacks where PM concentration is high near the San Ysidro border. We found that the nonwhite population faces a higher level of PM concentration than white (non-Hispanic) and more likely to have heart attacks, and so does the people close to the border areas, which indicate that the burden of PM is unequally distributed. We also observed that SB535 disadvantaged communities are highly exposed to particulate matter and more likely to experience heart attacks (P < .001), thus it is an environmental justice issue. As a result, it is imperative that public health policies are not adequate to protect people of those areas and further actions need to be taken to mitigate such environmental injustice. Reducing exposure, improving environmental equity, and protecting the health of disadvantaged communities is a public health priority.
20210903_-_SUPPLEMENTAL_INFORMATION.docx
Download MS Word (120.3 KB)Disclosure statement
No potential conflict of interest was reported by the authors.
Supplementary material
Supplemental data for this paper can be accessed on the publisher’s website
Additional information
Funding
Notes on contributors
Saleha Khanum
Saleha Khanum, MPH is a Research Scientist in the San Diego State University School of Public Health. Saleha’s research investigates environmental health disparities and toxicology. She is currently studying the developmental toxicity of novel environmental pollutants.
Zohir Chowdhury
Zohir Chowdhury is an Associate Professor in the Environmental Health (EH) Division at the San Diego State University School of Public Health. Dr. Chowdhury completed a Ph.D. in Atmospheric Chemistry from Georgia Institute of Technology in 2004. Prior to joining SDSU, he was a Postdoctoral Researcher and a Lecturer in the School of Public Health at UC Berkeley. Dr. Chowdhury’s research interests are in Air Pollution focusing on particulate matter (PM)-both in urban and in rural regions as well as in indoor and in outdoor environments. Particulate matter air pollution has been of concern not only in the US but all over the world since it causes respiratory and cardiac problems, visibility reduction, and a documented effect on global warming. Dr. Chowdhury’s research seeks to characterize this particulate matter (PM) air pollution, develop instruments and methods to measure it, and understand its health effects.
Karilyn E. Sant
Karilyn E. Sant is an Assistant Professor of Environmental Health in the San Diego State University School of Public Health. She is a toxicologist who specializes in the health consequences resulting from developmental exposures to common water pollutants. Most of her research has examined how exposures to endocrine disrupting chemicals (EDCs) affect embryonic and juvenile development, and predispose to metabolic diseases such as diabetes and obesity later in life. She currently uses the zebrafish model to investigate how emerging surface and drinking water contaminants influence both human and marine reproduction and health throughout the lifespan.
References
- Aguilera, R., T. Corringham, A. Gershunov, and T. Benmarhnia. 2021. Wildfire smoke impacts respiratory health more than fine particles from other sources: Observational evidence from Southern California. Nat. Commun. 12 (1):1493. doi:https://doi.org/10.1038/s41467-021-21708-0S.
- Baldacci, S., S. Maio, S. Cerrai, G. Sarno, N. Baïz, M. Simoni, I. Annesi-Maesano, and G. Viegi; HEALS Study. 2015. Allergy and asthma: Effects of the exposure to particulate matter and biological allergens. Respir. Med. 109 (9):1089–104. doi:https://doi.org/10.1016/j.rmed.2015.05.017.
- Brook, R. D., S. Rajagopalan, C. A. Pope III, J. R. Brook, A. Bhatnagar, A. V. Diez-Roux, F. Holguin, Y. Hong, R. V. Luepker, M. A. Mittleman, et al.; American Heart Association Council on Epidemiology and Prevention, Council on the Kidney in Cardiovascular Disease, and Council on Nutrition, Physical Activity and Metabolism. 2010. Particulate matter air pollution and cardiovascular disease: An update to the scientific statement from the American Heart Association. Circulation. 121 (21):2331–78. doi:https://doi.org/10.1161/CIR.0b013e3181dbece1.
- California Air Resources Board. 2009. CEPAM: 2009 Almanac - Standard emissions tool. Accessed May 5, 2021. https://www.arb.Ca.gov/app/emsinv/fcemssumcat2009.php.
- California Air Resources Board. 2014. CA.gov. Accessed May 5, 2021. https://ww2.arb.ca.gov/our-work/programs/mobile-source-emissions-inventory/msei-modeling-tools.
- California Air Resources Board. 2018. Exposure to fine particulate matter (PM2.5) increases health risks for Californians. Res. Synth. 16 (1 1–2), April.
- California Air Resources Board. 2021a. Quality assurance air monitoring site search. Accessed May 5, 2021. https://ww2.arb.ca.gov/applications/quality-assurance-air-monitoring-site-search-1.
- California Air Resources Board. 2021b. Summary: Diesel particulate matter health impacts. Accessed August 30, 2021. https://ww2.arb.ca.gov/resources/summary-diesel-particulate-matter-health-impacts.
- California Office of Environmental Health Hazard Assessment. 2017. CalEnvironScreen 3.0: Update to the California Communities Environmental Health Screening Tool. Accessed January, 2017. https://oehha.ca.gov/media/downloads/calenviroscreen/report/ces3report.pdf.
- California Public Utilities Commission. 2021. Disadvantaged communities. Accessed May 5, 2021. https://www.cpuc.ca.gov/discom/.
- California Senate Bill No. 535. 2012. SB-535 California Global Warming Solutions Act of 2006: Greenhouse gas reduction fund. Accessed May 5, 2021. https://leginfo.legislature.ca.gov/faces/billNavClient.xhtml?bill_id=201120120SB535.
- City of San Diego. 2021. Councilmember Vivian Moreno (District 8). https://www.sandiego.gov/citycouncil/cd8/communities.
- Draft CalEnviroScreen 4.0. 2021. CA.gov, April 28. https://oehha.ca.gov/calenviroscreen/report/draft-calenviroscreen-40.
- Du, Y., X. Xu, M. Chu, Y. Guo, and J. Wang. 2016. Air particulate matter and cardiovascular disease: The epidemiological, biomedical and clinical evidence. J. Thorac. Dis. 8 (1):E8–E19. doi:https://doi.org/10.3978/j.2072-1439.2015.11.37.
- Lurmann, F., E. Avol, and F. Gilliland. 2015. Emissions reduction policies and recent trends in Southern California’s ambient air quality. J. Air Waste Manage. Assoc. 65 (3):324–35. doi:https://doi.org/10.1080/10962247.2014.991856.
- Mikati, I., A. F. Benson, T. J. Luben, J. D. Sacks, and J. Richmond-Bryant. 2018. Disparities in distribution of particulate matter emission sources by race and poverty status. Am. J. Public Health 108 (4):480–85. doi:https://doi.org/10.2105/AJPH.2017.304297.
- Morello-Frosch, R., and B. M. Jesdale. 2006. Separate and unequal: Residential segregation and estimated cancer risks associated with ambient air toxics in U.S. metropolitan areas. Environ. Health Perspect. 114 (3):386–93. doi:https://doi.org/10.1289/ehp.8500.
- Morello-Frosch, R., M. Pastor, and J. Sadd. 2001. Environmental justice and Southern California’s “Riskscape”: The distribution of air toxics exposures and health risks among diverse communities. Urban Aff. Rev. 36 (4):551–78. doi:https://doi.org/10.1177/10780870122184993.
- NIMHD. 2021. Racial and ethnic categories and definitions for NIH diversity programs and for other reporting purposes. https://www.nimhd.nih.gov/about/overview/.
- NSCEP. 2010. A blueprint for action on the U.S. Mexico Border, GNEB.
- Office of Statewide Health Planning and Development. 2020. The Office of Statewide Health Planning and Development (OSHPD). https://oshpd.ca.gov/data-and-reports/.
- Pastor, M., R. Morello-Frosch, and J. L. Sadd. 2005. The air is always cleaner on the other side: Race, space, and ambient air toxics exposures in California. J. Urban Aff. 27 (2):127–48. doi:https://doi.org/10.1111/j.0735-2166.2005.00228.x.
- Population Reference Bureau. 2019. Analysis of data from the U.S. Census Bureau, Census 2000 Supplementary Survey, 2001 Supplementary Survey, 2002 through 2019 American Community Survey. https://www.census.gov/programs-surveys/acs.
- Quintana, P. J., J. J. Dumbauld, L. Garnica, M. Z. Chowdhury, J. Velascosoltero, A. Mota-Raigoza, and L. T. Molina. 2014. Traffic-related air pollution in the community of San Ysidro, CA, in relation to northbound vehicle wait times at the US–Mexico border Port of Entry. Atmos. Environ. 88:353–61. doi:https://doi.org/10.1016/j.atmosenv.2014.01.009.
- Quintana, P. J., P. Ganster, P. E. Stigler Granados, G. Muñoz-Meléndez, M. Quintero-Núñez, and J. G. Rodríguez-Ventura. 2015. Risky borders: Traffic pollution and health effects at US–Mexican ports of entry. J. Borderlands Stud. 30 (3):287–307. doi:https://doi.org/10.1080/08865655.2015.1066697.
- Rodriquez, M., and L. Zeise. 2017. CalEnviroScreen 3.0, Office of Environmental Health Hazard Assessment, Sacramento.
- US General Services Administration. 2021. San Ysidro land port of entry. Accessed August 30, 2021. https://www.gsa.gov/about-us/regions/welcome-to-the-pacific-rim-region-9/land-ports-of-entry/san-ysidro-land-port-of-entry.
- Viswanathan, S., L. Eria, N. Diunugala, J. Johnson, and C. McClean. 2006. An analysis of effects of San Diego wildfire on ambient air quality. J. Air Waste Manage. Assoc. 56 (1):56–67. doi:https://doi.org/10.1080/10473289.2006.10464439.
- Wang, C., Y. Tu, Z. Yu, and R. Lu. 2015. PM2.5 and cardiovascular diseases in the elderly: An overview. Int. J. Environ. Res. Public Health 12 (7):8187–97. doi:https://doi.org/10.3390/ijerph120708187.
- Weldy, C. S., Y. Liu, Y. C. Chang, I. O. Medvedev, J. R. Fox, T. V. Larson, W. M. Chien, and M. T. Chin. 2013. In utero and early life exposure to diesel exhaust air pollution increases adult susceptibility to heart failure in mice. Part. Fibre Toxicol. 10 (1):59. doi:https://doi.org/10.1186/1743-8977-10-59.
- Xu, M., J. Xu, and X. Yang. 2017. Asthma and risk of cardiovascular disease or all-cause mortality: A meta-analysis. Ann. Saudi Med. 37 (2):99–105. doi:https://doi.org/10.5144/0256-4947.2017.99.
- Yitshak-Sade, M., K. J. Lane, M. P. Fabian, I. Kloog, J. E. Hart, B. Davis, K. C. Fong, J. D. Schwartz, F. Laden, and A. Zanobetti. 2020. Race or racial segregation? Modification of the PM2.5 and cardiovascular mortality association. PloS One 15 (7):e0236479. doi:https://doi.org/10.1371/journal.pone.0236479.
- Zeka, A., J. R. Sullivan, P. S. Vokonas, D. Sparrow, and J. Schwartz. 2006. Inflammatory markers and particulate air pollution: Characterizing the pathway to disease. Int. J. Epidemiol. 35 (5):1347–54. doi:https://doi.org/10.1093/ije/dyl132.
- Zhang, Y. X., Y. Liu, Y. Xue, L. Y. Yang, G. D. Song, and L. Zhao. 2016. Correlational study on atmospheric concentrations of fine particulate matter and children cough variant asthma. Eur. Rev. Med. Pharmacol .Sci. 20 (12):2650–54.