
 ?Mathematical formulae have been encoded as MathML and are displayed in this HTML version using MathJax in order to improve their display. Uncheck the box to turn MathJax off. This feature requires Javascript. Click on a formula to zoom.
ABSTRACT
This project investigated passive adsorbent sampling of light (C2-C5) hydrocarbons which are sensitive tracers of fugitive emissions from oil and natural gas (O&NG) sources. Stronger adsorbent materials, i.e. Carboxen 1000 and Carboxen 1016, than those typically used in adsorbent sampling were considered. Experiments were conducted in laboratory and field settings using thermal desorption – gas chromatography analysis. Uptake of water vapor and system blanks were challenges inherent to the increased affinity of these adsorbents. Carboxen 1000 exhibited the best signal-to-noise ratio for the target compounds after optimizing conditioning parameters to reduce blanks, and by reducing the adsorbent mass loaded in the cartridge. This strategy reduced blanks to equivalent ambient air mole fractions of <0.05 nmol mol−1 (ppb), and allowed determination of these O&NG tracers over three-day sampling intervals with a lower detection limit of ≥0.5–1 ppb. Linear VOCs uptake was observed in dry air. Water uptake was as high as 0.65 gH2O g−1adsorbent at relative humidity (RH) above ≈ 75%. The water collection passivates adsorbent sites and competes with the uptake rates of VOCs; under the worst case relative humidity level of 95% RH, VOCs uptake rates dropped to 27–39% of those in dry air. This effect potentially causes results to be biased low when cartridges are deployed at high relative humidity (RH), including overnight, when RH is often elevated over daytime levels. Nonetheless, representative sampling results were obtained under ambient conditions during three field studies where cartridges were evaluated alongside whole air sample collection in canisters. Agreement varied by compound: Ethane and alkenes correlated poorly and could not be analyzed with satisfactory results; results for C3-C5 alkanes were much better: i-butane correlated with R2 > 0.5, and propane, n-butane, i-pentane, and n-pentane with R2 > 0.75, which demonstrates the feasibility of the passive sampling of these latter O&NG tracers.
Implications: Oil and natural gas development has been associated with emissions of petroleum hydrocarbons that impact air quality and human health. This research characterizes and defines the application possibilities of solid adsorbent sampling for atmospheric passive sampling monitoring of low molecular weight volatile organic compounds (i.e. ethane through pentane isomers) that are most commonly emitted from natural gas drilling and well sites. The passive sampling of these pollutants offers a simple, low cost, and readily applicable monitoring method for assessing emissions and air quality impacts in the surroundings of oil and gas operations.
Introduction
The invention of hydraulic fracturing and horizontal drilling techniques has led to drilling in areas previously unexplored by oil and natural gas operations (O&NG). In 2010, there were over one million producing oil and gas wells in the United States (EIA Citation2012), and with this production increase, the United States has become the world’s top producer of petroleum and natural gas hydrocarbons (EIA Citation2021). The large number of wells, along with a continued interest in drilling new wells, has led to O&NG operations increasingly approaching populated areas. Concerns regarding O&NG operations led Colorado legislators in 2012 to mandate O&NG drilling not to take place within 500 feet of residences, or within 1000 feet of high-occupancy buildings such as schools or day care facilities (COGCC Citation2012). This setback was increased to 2000 feet to any occupied building in 2020 (Tanner Citation2020). Despite this legislation, conflicts abound between homeowners and O&NG companies over proximity of operations to residential areas (Arndt et al. Citation2017; CPR Citation2017; Urbina Citation2011).
Much of the controversy is centered on the association of negative health effects with nearby O&NG wells. Residing near to O&NG sites has been shown to increase the likelihood of birth defects, low birth weight, preterm birth, congenital heart defects, and cancer (Ballester et al. Citation2010; Bowen et al. Citation2009; Dadvand et al. Citation2013; Ghosh et al. Citation2012; Lupo et al. Citation2011; McKenzie et al. Citation2018, Citation2019, Citation2014, Citation2015; Wennborg et al. Citation2005). Ground-level air near O&NG operations has been shown to have elevated concentrations of volatile organic compounds (VOCs), including hazardous air pollutants such as benzene and toluene (Macey et al. Citation2014; Sovacool Citation2014), both of which are known carcinogens (Huff Citation2007; Verma, Johnson, and McLean Citation2000). Further, VOCs contribute to the photochemical formation of ozone and secondary aerosols (Bowman and Seinfeld Citation1994; Chameides et al. Citation1992), which are additional pollutants arising from O&NG operations that are impacting human health (Colborn et al. Citation2014; Fann et al. Citation2018; Helmig Citation2020; McKenzie et al. Citation2018).
Assessing the exposure to O&NG emissions begs for a monitoring strategy that has high spatial and temporal resolution, and is robust, cheap, and easily deployable in myriad environments. Passive sampling devices have been used to monitor workplace exposure to gaseous compounds for a long time (Brown Citation2000; Palmes and Gunnison Citation1973). They are small and durable enough to be deployed in industrial environments, or worn on one’s person in such environments, and typically cost less than US $100 each. Additionally, these devices can be deployed without expert supervision, power, or other equipment, and can sample several target compounds simultaneously. Samples are integrated over the time for which samplers are deployed. This presents a more characteristic measurement than whole-air grab samples that collect a snapshot measurement of air quality. Multiple passive sampling devices can be deployed to the same location sequentially to increase temporal resolution, or to neighboring locations to investigate the spatial distribution of exposure. Devices that have been used include badge-type samplers with an adsorbent surface, diffusion tube type samplers with an adsorbent filter, and cartridges that are loaded with adsorbent material (Krupa and Legge Citation2000; Kurpius, McKay, and Goldstein Citation2002). Sampling onto solid adsorbents has been shown to collect volatiles with high sensitivity, and its performance has been directly compared with active sampling methods (Huang et al. Citation2018; Iso Citation1999; Mentese and Bas Citation2020). Collected analytes can be mobilized from the adsorbent by solvent extraction for subsequent gas chromatography (GC) analysis (Huang et al. Citation2018; Lucialli et al. Citation2020). An alternative, more popular method relies on thermal desorption with in-line GC, for which commercial instruments are available that allow for automated and sensitive analysis of adsorbent cartridges in sequence (Bruno et al. Citation2008; Eisele et al. Citation2016; Mentese and Bas Citation2020; Mukerjee et al. Citation2016).
The sampling relies on diffusion to collect compounds of interest on the adsorbent bed. As diffusion can be affected by environmental conditions, care must be taken to ensure that a representative sample is collected. Temperature and air flow have been shown to affect sample collection (Koutrakis et al. Citation1993; Seethapathy, Gorecki, and Li Citation2008). Changes in wind speed and direction relative to the sampler can vary the effective diffusion path length, thereby impacting sampling performance (Tompkins and Goldsmith Citation1977; Underhill and Feigley Citation1991). A number of commercial products are available, such as Radiello, Perkin Elmer, and Markes diffusive sampling devices that are tailored toward minimizing those interferences and that can be analyzed with automated thermal desorption-GC instruments (Bruno et al. Citation2008; Gallego et al. Citation2018; Huang et al. Citation2018; Kerchich and Kerbachi Citation2012; Lucialli et al. Citation2020; Sablan, Schade, and Holliman Citation2020). An extensive theoretical and experimental evaluation of the sampling behavior of a radial and axial design POcket Diffusive sampler (POD) on temperature, porosity, and humidity was presented by Ballesta et al. (Citation2016).
The most popular adsorbents, i.e., Carbotrap, Carbopack, and Tenax have mostly been applied for measurements of hydrocarbons with six or more carbons, in particular for BTEX (benzene, toluene, ethylbenzene, xylenes) compounds (Bruno et al. Citation2008; Dorter, Odabasi, and Yenisoy-Karakas Citation2020; Kerchich and Kerbachi Citation2012; Mowrer et al. Citation1996; Ramos et al. Citation2018; Sablan, Schade, and Holliman Citation2020). The adsorbents Carbograph 4, Carbopack-X, and Carbopack-Z were shown to be suitable for diffusive sampling of i-pentane, n-pentane, and larger compounds, but were unable to sample the more selective O&NG tracer VOCs < C5, i.e., ethane, propane, i-butane and n-butane (Abbatt et al. Citation2012; Ballesta et al. Citation2016; Verriele et al. Citation2015).
Adsorbent cartridges are the recommended device for EPA Method 325 A/B (also known as “fence line monitoring”) (Abbatt et al. Citation2012; Brantley, Thoma, and Eisele Citation2015; Eisele et al. Citation2016; Mukerjee et al. Citation2016) for passive sampling of primarily benzene from the property boundary of a suspected source of VOCs, such as refineries. This method, using Carbopack X solid adsorbent samplers, was evaluated in a campaign around the perimeter of a petroleum refinery to measure benzene emissions over a two-week period. A model predicted concentrations around the refinery of 0.2 ppb or less, but downwind mixing ratios were up to 2.3 ppb, and exceeded upwind measurements by 1.7 ppb. Cartridge measurements correlated with nearby GC measurements (R2 = 0.86); duplicate cartridges agreed with an R2 = 0.97 (Abbatt et al. Citation2012).
The relative abundances, resulting in enhanced O&NG VOC concentrations in ambient air near O&NG operations, were found to be highest for the lightest VOCs, i.e. ethane and propane, and then steadily became smaller as the carbon number of the VOCs increased (Franco et al. Citation2016; Gilman et al. Citation2013; Helmig et al. Citation2016; Howarth, Ingraffea, and Engelder Citation2011; Karion et al. Citation2013; Pétron et al. Citation2012, Citation2014). This is due to the relative higher abundance of the lighter VOCs in natural gas, and their higher vapor pressure, which makes them more susceptible to evaporate and escape through leakage, venting, or flaring. Conversely, these lighter VOCs, primarily petroleum alkanes, are the most selective tracers of O&NG operations for assessing O&NG influence on air quality as their emissions from other sources are relatively small.
This work seeks to expand passive sampling techniques to these lighter VOCs emitted by, and most indicative of, O&NG operations, i.e. C2 – C6 hydrocarbons, while at the same time also facilitating analysis of BTEX compounds. These goals call for a method that would allow analysis of a wider range of VOCs volatility than what had been reported in previous literature.
Strong adsorbents must be employed to sample the highly volatile < C6 hydrocarbons. The adsorbent strength typically scales with the adsorbent surface area. This study investigated Carboxen 1000 (Sigma Aldrich, United States, 11,052-U Supelco) and Carboxen 1016 (Sigma Aldrich, United States, 11,021-U Supelco, now labeled as Graphsphere 2016). These adsorbents are among the strongest solid adsorbents that still allow desorption of VOCs by thermal desorption for GC analysis. They have surface areas of ≈ 1200 m2 g−1 and 75 m2 g−1, respectively. For comparison, Tenax, a commonly used adsorbent for BTEX compounds, has a surface area of ≈ 35 m2 g−1.
An analytical challenge of using carbon-based adsorbents is that thermal cycling (i.e. processes such as conditioning and desorption) can produce benzene (Helmig Citation1996), a target compound in O&NG monitoring. Another challenge inherent to using strong adsorbents is the potential co-sampling of H2O and CO2 (Helmig and Vierling Citation1995; Pollmann et al. Citation2006). As atmospheric H2O and CO2 are 4–6 orders of magnitude more abundant in the atmosphere than VOCs, they compete with these target compounds for adsorbent sites during sample collection. Elevated humidity levels can limit the adsorbent bed’s ability to collect target compounds (Helmig and Vierling Citation1995). Further, following thermal desorption, the mobilized H2O can displace the carrier gas, change chromatography, co-elute with some target compounds, interfere with the detector, and can freeze out and clog GC capillary columns during sub-ambient oven cooling (Ciccioli et al. Citation1992; Fabbri et al. Citation1987; Helmig, Schwarzer, and Steinhanses Citation1990; Helmig and Vierling Citation1995; Sturges and Elkins Citation1993; Wood Citation1987). H2O can obscure chromatograms so that results are difficult to interpret, deteriorate the stationary phase of GC columns, and damage the GC-Mass Spectrometer (MS) ion source (Allen et al. Citation2013; Helmig and Vierling Citation1995).
Experiments that are summarized in this paper were conducted in the context of three visiting student research projects. This paper provides the main findings of these experiments. We anticipate that sharing these findings will be of value to the community for evaluating, further development, and deployment of this sampling method in assessing exposure to light VOCs in environments that are impacted by O&NG operations.
Experimental
Overview
Passive adsorbent sampling was investigated through a series of laboratory and field experiments that took place over two years. Experiments included refinements of standard procedures as well as novel experimental approaches. The emphasis of the study was on O&NG VOCs, particularly on light alkanes that constitute the most selective O&NG tracers. A number of alkenes were included in the laboratory testing and also observed in the ambient sampling. Results for alkenes were inconsistent and overall unsatisfactory, and are therefore not reported here. A series of lab experiments were performed using both passive and active sampling. Active sampling entails using a pump to force air through the adsorbent bed, whereas passive sampling relies on diffusion of air into the cartridge. While the intention was always to use the cartridges passively, active sampling experiments were performed to calibrate the mass response of the analytical system by loading defined masses of standard components onto the cartridges. A dynamic dilution system consisting of two mass flow controllers (Tylan, Coastal Instruments, Inc., Burgaw, NC), one metering a multi-component standard, the other metering zero air, was used to generate defined VOC gas standard mixing ratios. A summary of primary standards used for instrument calibration is provided in Tables S1–S3. The passive sampling uptake experiments were conducted with a test mixture that was prepared by diluting a higher mole fraction standard with scrubbed VOCs-free air to yield VOCs mole fractions in the test mixture ranging from 0.64 to 1.00 ppb. The adsorbents Tenax-GR, Carboxen 1000, Carboxen 1016, and cartridges filled with a combination of Carboxen 1000 and 1016 were evaluated. The combination cartridge was deemed to allow analysis of a wider range of VOCs, with the weaker adsorbent in the front mostly capturing and releasing the less volatile target compounds, and the stronger adsorbent in the back then capturing and thermally releasing the most volatile VOCs. The dual adsorbent cartridges were already available in our laboratory from previous active sampling applications. By switching the inlet side, their use also allowed evaluation of two different adsorbents and with one cartridge design.
The precision of the cartridge sampling was determined by placing two cartridges side-by-side, either within less than half a meter during ambient sampling, or within less than 20 cm during sampling from within a bag enclosure (see below). Cartridge sampling results and efficacy were evaluated by comparison with results from co-located and concurrent whole-air sampling and gas chromatography analysis of Summa canisters. Other previous work has explicitly investigated the temperature dependence of passive sampling (e.g. Ballesta et al. Citation2016). We did not systematically investigate this effect here, but instead evaluated the sampling under the diurnal and seasonal temperatures observed in ambient applications.
Cartridge assembly
The diffusion tube design was chosen for practical reasons as most required materials were readily available in our laboratory. Furthermore, this type of sampler was the most commonly referenced diffusive sampling approach in the published literature at the onset of the study. Unfilled, stainless-steel tubes (cartridges) were purchased from Perkin-Elmer (Part # L4270123, Richmond, CA, USA) (89 mm long x 6.4 mm outer diameter, 4.8 mm inner diameter). Cartridges were open on each end and have a unique identification number. The cartridge’s sampling inlet or front opening was identified by two grooves 1.5 cm from the opening. A cartridge schematic is shown in .
Figure 1. Schematic of adsorbent cartridges. (a) Adsorbent cartridge dimension shown with front opening on the left. (b) Schematic of internal components of a cartridge loaded with 540 mg of adsorbent. The glass fiber filter disk, adsorbent, glass fiber filter disk, gauze, and spring (overlapping circles) follow from left. (c) Identical to (b), but with half the mass of adsorbent (270 mg) and a larger spring. Regardless of the adsorbent bed mass, the distance from the front opening to the adsorbent bed was 1.5 cm. The distance from the end opening to the adsorbent bed varied based on the mass and packing of the adsorbent bed. (d) Relative volume of the cartridge occupied by 27, 54, 135, 270, and 540 mg of adsorbent.
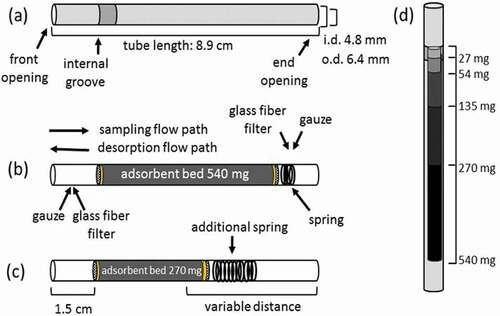
All cartridges, internal components (not including adsorbents), and tools were rinsed with deionized water, sonicated in methanol, and dried at 125°C to remove organic contaminants. Cleaned cartridges and components were stored in rinsed and sonicated jars and handled wearing latex gloves. Assembly of sampling cartridges began by positioning metal gauze 1.5 cm from the front opening, followed, in order behind the gauze, by silanized glass fiber filter disks (Tissueglass 2500A0; Pallftex, Putnam, CT, USA), pre-weighed adsorbent, a second glass fiber filter disk, metal gauze, and a spring to hold components in place. Cartridges loaded with multiple adsorbents employed an extra glass fiber filter disk between adsorbents. Larger springs were used in cartridges packed with smaller adsorbent quantities. A cross section of a filled tube is shown in . Cartridges were conditioned immediately after assembly by flowing purified nitrogen at 25 mL min−1 through the filled cartridge in a 300°C oven for 30 min. Cartridges were conditioned again before use, the conditioning parameters were further optimized as described below. Once cool enough to handle, cartridges were capped with 0.64 cm brass Swagelok tube fittings and caps using PTFE ferrules.
Analysis of cartridges
An automated thermal desorption instrument (Perkin Elmer ATD400, Part # M041-3331, Richmond, CA, USA) was used for the GC chemical analysis. Following purging, analytes were desorbed from the cartridge and refocused onto a cooled micro-adsorbent focusing trap. The micro-trap contained 25 mg of Carboxen 1016, and 220 mg of Carboxen 1000. Standard analysis parameters were set to a primary desorption time of 20 min at a temperature of 300°C, 50 mL min−1 of desorption gas flow (helium), and −10°C cold trap temperature. After sample transfer, the cold trap was heated rapidly to 300°C to inject the sample onto the GC column. A 50 m, 0.53 mm i.d., 15-micron Al2O3 PLOT GC column was used with a Flame Ionization Detection (GC-FID; Model 5890, Agilent Technologies, Santa Clara, USA). The GC temperature program consisted of an initial oven temperature of 40°C for 2 min, a ramp of 10°C min−1 up to 200°C, and a final hold at 200°C for 15 min. Chromatograms were evaluated with the software program PeakSimple (SRI International, Menlo Park, CA, USA). The VOCs primary standards were used to determine analyte carbon response factors.
Results and discussion
Year 2014 field studies
Adsorbent cartridges and whole-air sampling canisters were deployed to the field side-by-side to assess cartridge sampling capabilities, using the canister results as reference. Cartridges and canisters were sampled during the same time interval, with the canister sampling relying on a passive constant flow device (see below). Pearson correlation coefficients (PCC), which are a measure of the strength of a linear association of two variables, were used to quantify the correlation of mean cartridge versus canister data for specific VOCs. The statistical significance (p-values) of these correlations was determined from the PCCs (i.e., R2 values; ).
Table 1. Pearson correlation coefficients and p-values of cartridge and canister sampling during the summer and fall 2014 field campaigns. Canister and cartridge median relative standard deviations (RSDs), and median relative standard deviation ratios (RSDRs; cartridge/cans) from the Fall 2014 (n = 10) campaign are shown
Cartridges deployed in the 2014 field studies contained 220 mg each of the adsorbents Carboxen 1016 and Carboxen 1000, separated by a glass wool plug or glass fiber filter. The weaker adsorbent (Carboxen 1016) was positioned closer to the front opening. The cartridges were deployed in an inverted, lid-less coffee can with a clip that held them vertically with the inlet pointing down. On the front opening side, the storage cap was replaced with a diffusion cap (Perkin Elmer Standard Diffusion Caps, Part # L4070207, Richmond, CA, USA) to protect the cartridges from precipitation, direct sunlight, and minimize turbulent transport within the cartridge (Figure S1). The diffusion cap was replaced with a metal cap and Teflon ferrule after the three-day sampling period, placed in an airtight Mason jar, and stored at 3–4°C until analysis.
6-L Summa canisters (part #27,405, Restek, Bellefonte, PA, USA) were conditioned prior to deployment by repeated filling with humidified zero air and evacuation three times, with a final pressure of 1–2 in Hg following the third evacuation. Canister sampling was controlled using Veriflo passive flow devices (part #24,232, Restek) that maintained a constant flow of ≈ 1 mL min−1 over the three-day sampling period. Canister samples were collected over identical time intervals. In the field, canisters were placed in ≈ 45 L cooler boxes with ≈ 6 L of water in bottles to minimize temperature variations. A stainless steel sampling tube with an ozone scrubber inlet (glass fiber filter soaked in sodium thiosulfate solution, preparation details available in Helmig Citation1997), was fed through a hole in the cooler to sample ambient air. Following sampling to a final pressure of ≈ 19 in Hg, canisters were capped and transported to the lab for analysis. Sample volumes of 500 mL were withdrawn from the canister, scrubbed of water with a cryogenic trap, pre-concentrated on a Peltier-cooled micro-adsorbent trap, and injected into a GC-FID/MS with a 60 m, 0.32 mm i.d. GAS-PRO column, with the column flow split between the FID and MS. The GC oven temperature began at 50°C for 2 min, was ramped at a rate of 8°C min−1, and held at 225°C for 15 min before cooling to 50°C. More details are reported by Rossabi et al. (Citation2021).
Cartridges and canisters were deployed twice in 2014: for 3 days each week from June to August 2014 at five sites around Boulder County, and for 3 days over three weeks in November/December 2014 outside of the former INSTAAR building on the University of Colorado’s East Campus (all site locations are provided in Table S4). Temperature and relative humidity information for these campaigns are given in Table S5. The summer 2014 deployment was a part of the Front Range Air Pollution and Photochemistry Experiment (FRAPPE; Flocke et al. Citation2020) and a Boulder County Public Health project, which had a particular emphasis on assessing geographical concentration gradients of light hydrocarbons and BTEX compounds from O&NG development. Monitoring sites information, the sampling schedule, and findings from the canister sampling are presented in Rossabi et al. (Citation2021). Cartridges were deployed in pairs to evaluate the sampling reproducibility. Due to a limited number of available canisters, only one canister was deployed to each site; therefore, reproducibility results of canister sampling during summer 2014 are not available. However, canisters were deployed in pairs during the fall 2014 study, allowing the assessment of the sampling reproducibility, as discussed below.
The fall 2014 study site was located less than 100 m from the intersection of 30th Street and Arapahoe Ave, one of the busiest intersections in Boulder. The sampling was repeated ten times, resulting in 20 samples for each method. The repeatability of canister measurements was compared to that of the cartridges by calculating the relative standard deviation (RSD) of cartridge and canister results (). RSDs were calculated by finding the mean and standard deviation of paired samples collected using the same method (i.e. cartridge and canister samples were considered separately), and dividing the standard deviation by the mean. Relative Standard Deviations Ratios (RSDRs) are the RSDs of the cartridge sample pairs divided by the RSDs of the canister sample pairs. RSDs and RSDRs were calculated for each sampling date and compound, and the median values for all dates were determined and are shown in . The RSDs and RSDRs compare the variances of these methods, but do not address the agreement. The agreement of the cartridge and canister sampling techniques is developed and discussed below. Due to the proximity to O&NG development, mixing ratios in samples from the FRAPPE study sites were generally higher than mixing ratios during the winter 2014 campaign. With higher temperatures and similar relative humidity, absolute humidity was higher during the summer 2014 campaign than during the winter 2014 campaign (Table S5). Precision errors and correlation results vary largely by compounds. RSDs for the cartridge analyses were generally higher (by a factor of 3–5 for most compounds) than for canister samples. RSDs for C3-C5 alkanes from the cartridge sampling in the winter 2014 campaign were below 10%; BTEX compounds fell within 10–20%. Pearson Correlation Coefficients (PCCs) were used as a first approximation for the agreement of the canister and cartridge sampling methods. PCCs for the C3-C5 alkanes between canister and cartridge samples ranged from 0.67 to 0.93 in the summer 2014 campaign, and 0.87–0.93 in the fall 2014 campaign. At the encountered, mostly sub-ppb level mole fractions for the BTEX compounds, PCCs were highly variable, ranging from −0.31 to 0.83. These unsatisfactory results for BTEX compounds prompted a reevaluation of the adsorbent cartridges and measurement sensitivity with a particular emphasis on improving results for these aromatics.
Cartridge optimization
The adsorbent, or combination of adsorbents, cartridge conditioning method, and adsorbent bed mass were further investigated for optimizing sampling of < C6 alkanes, while also allowing representative sampling of BTEX compounds. The signal in blank runs of passive adsorbent cartridges typically determines the limit of detection, so it is essential to minimize the background and its variability. Experiments to minimize the background signal of light alkanes and BTEX compounds are described below.
Adsorbent selection
Cartridges containing the adsorbents Carboxen 1000, Carboxen 1016, Tenax GR, and an approximately equal combination of Carboxen 1000 and 1016 were evaluated () using fully loaded cartridges only (the last four rows of ). Cartridges were analyzed five consecutive times on the ATD400. Repeated thermal desorption yielded progressively lower backgrounds until the fifth desorption, when peak areas stopped to decrease notably further. The adsorbents were compared using the peak areas of ethane, propane, n-butane, n-propane, n-hexane, benzene, toluene, ethylbenzene, m-, p- and o-xylene, and the total VOC signal. The fifth run of each cartridge was considered for its optimized blank VOC profile.
Table 2. Adsorbent cartridge types tested. Multiple cartridges of each unique adsorbent type and mass were assembled
Cartridge blanks
Examples of blank chromatograms of the 5th consecutive desorption run of each adsorbent are shown in . Corresponding peak areas for compounds of interest for each adsorbent are given in Table S6. The chromatogram of Carboxen 1000 showed fewer and smaller peaks than for other adsorbents analyzed. Carboxen 1016 displayed the highest background, exceeding Carboxen 1000s total alkane response by a factor of 10, and the total BTEX response by a factor of 43. Tenax GR’s total alkane and total BTEX peak areas were factors of 3 and 4 higher, respectively, than Carboxen 1000. The total peak area observed for the Carboxen 1000 and 1016 combination cartridge was 70% of the Carboxen 1016 only cartridge, and a factor of ≈ 30 higher than Carboxen 1000 alone. From the blank perspective, Carboxen 1000 clearly was the best choice among these investigated adsorbent materials.
Figure 2. Blank chromatograms from cartridges loaded with (A) Carboxen 1000, (B) Carboxen 1016, (C) Tenax GR, and (D) a combination of Carboxen 1000 and 1016. Masses vary among adsorbents; 6.75 cm of each cartridge was occupied with adsorbent. The y-axis scale is identical for all panels.
Active sampling adsorbent evaluation
Cartridges filled with Carboxen 1016/1000 and Tenax-GR were actively loaded using a custom automated sampler (diagram in Helmig et al. Citation2004) with 1 L of a multi-component VOC standard (Table S2). In a separate experiment, 2 L of a secondary, in house prepared n-alkane and BTEX standard were actively loaded on cartridges containing only Carboxen 1000 adsorbent. To compare the performance of the different adsorbents, an Analytical System Response (ASR) was calculated. The ASR is similar to an FID carbon response factor in that these values were calculated by dividing the GC peak area for a compound by the mole fraction of the compound in the standard (ppbC) and volume of sample (L). It is a measure of the overall collection and desorption efficiencies of the adsorbent bed in the cartridge, the adsorbent microtrap in the ATD-400, the injection efficiency into the GC/MS/FID, and the FID response. The average ASRs and their relative standard deviations (RSDs) are listed in . ASR results for the most volatile VOC, ethane, were low across all adsorbents, indicating that none of the adsorbents were strong enough to quantitatively retain this analyte. The Carboxen-based cartridges had relatively consistent (6–8) ASR for a wide volatility range of VOCs larger than C2. Their ASR were larger for the C3-5 alkanes than for the Tenax adsorbent, indicating a higher trapping efficiency. Further, RSDs were lower relative to the Tenax-GR cartridges, showing an overall better analytical performance. For the Carboxen 1000-only cartridge, ASRs became progressively lower for BTEX compounds heavier than toluene, likely indicating incomplete thermal desorption from the adsorbent bed from this strong adsorbent material.
Table 3. Comparison of Carboxen 1000, Carboxen 1016/1000 multi-stage adsorbent cartridges, and Tenax-GR cartridges. Analytical System Responses (ASRs) are the instrument response divided by the mixing ratio of the standard (ppbC) and the sample volume with relative standard deviations (RSD) for n = 5
Passive sampling onto dual-bed adsorbent cartridges
Besides investigating Carboxen 1016 and Carboxen 1000 adsorbents individually, we also tested and compared their results with the dual-bed adsorbent cartridges. All cartridges were prepared with the weaker adsorbent (Carboxen 1016) closer to the inlet (1016/1000 cartridges) (). Twenty cartridges were used in the conventional sampling direction, and 20 were used in reverse, i.e., with sampling from the stronger adsorbent (Carboxen 1000) side (‘1000/1016’ cartridges). Because cartridges were prepared with respect to the typical front opening, the distance to the adsorbent bed in the reversed sampling configuration varied more than for the 1016/1000 cartridges. Furthermore, the distance from the cartridge end to the adsorbent bed in the ‘1000/1016’ cartridges was generally longer than for the 1016/1000 cartridges because the inner components of the cartridge were packed down from the rear opening and held in place with a spring. All cartridges were placed inside a bag with a glass beaker containing deionized water for humidifying the test atmosphere. A small humidity sensor thumb drive was used to monitor %RH inside the bag (Extech Instruments, RHT10, Nashua, NH, USA). The multicomponent VOC standard was flowed into the bag at 200 mL min−1. 1016/1000 and ‘1000/1016’ cartridges were placed in the bag with their respective “front” ends open to passively sample the standard atmosphere. Two cartridges of each configuration were removed at regular intervals over the course of a 10-day period and analyzed.
lists the uptake rates (slopes of linear regression analysis of collected mass on the adsorbent cartridge versus sampling time), PCCs, and p-values for the 1016/1000 and ‘1000/1016’ cartridges. shows peak areas of selected compounds versus sampling time. Slopes for the ‘1000/1016’ cartridges were larger than for the 1016/1000 cartridges for all alkanes, toluene, and ethylbenzene, indicating that the ‘1000/1016’ cartridges collectively released (during thermal desorption) these compounds at a higher rate. Both cartridge orientations had negative correlations for benzene collection. Despite having higher slopes, PCCs were lower in general for the ‘1000/1016’; cartridges, which suggests that the sampling/analysis was less consistent than for the 1016/1000 cartridges.
Table 4. Linear regression results for analyte peak area (mV min) versus sampling time. Slope values represent analyte uptake rates. Other regression results are Pearson Correlation Coefficients (PCCs), and P-Values for collection of a standard mixture onto 1016/1000 and ‘1000/1016ʹ cartridges in a test atmosphere
Figure 3. Comparison of diffusive uptake on multi-stage cartridges for passive sampling of a standard gas mixture. Black data correspond to 1016/1000 cartridges (see 2.4.2). Red data are ’1000/1016ʹ cartridges. Note differences in y-axis ranges.
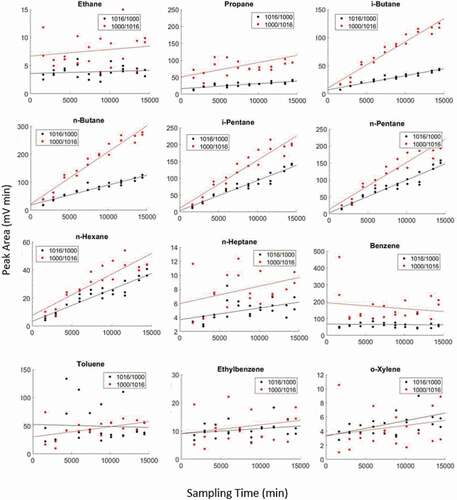
Following Fick’s Law of Diffusion, the mass of analytes collected onto the adsorbent should be inversely proportional to the diffusion path length (the distance between the cartridge’s opening and the adsorbent bed; Figure S2), which, besides the uptake onto the adsorbent material itself, likely explains some of the differences in the results between the 1016/1000 and ‘1000/1016’ cartridges (). The groove in the cartridge made the diffusion path length consistent and shorter for the 1016/1000 cartridges than for the ‘1000/1016’ cartridges. The distance to the cartridge opening was less consistent for the ‘1000/1016’ cartridges because they were constructed with the intention of being sampled from the other opening. In addition to the metal gauze and filter disk at both ends of the cartridge, a spring was present in the diffusion path for the ‘1000/1016’ cartridges. This variable diffusion path length was likely the explanation for the more variable sampling by the ‘1000/1016’ cartridges. While we assume both adsorbents are a perfect sink, the stronger adsorbent Carboxen 1000 appears to trap these compounds at a higher rate than Carboxen 1016. Having this adsorbent closer to the inlet would reduce the diffusion path length, and therefore be expected to further increase the analyte uptake rate.
Adsorbent conditioning
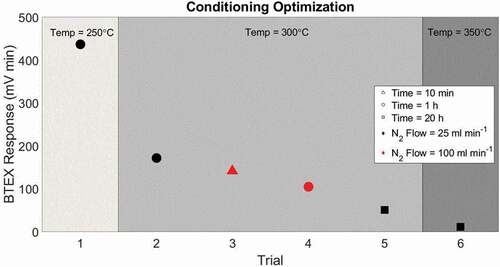
Proper storage and conditioning of adsorbent cartridges are critical for achieving low detection limits (Cao and Hewitt Citation1994; Helmig Citation1996). After determining the Carboxen 1000 adsorbent had the lowest blanks among tested adsorbent types, conditioning parameters were further investigated with the goal to reduce blank values, particularly for benzene. Cartridges were conditioned on a manifold placed inside a GC oven under a N2 purge flow. Conditioning temperature, duration, and purge flow rate were evaluated by comparing BTEX blank levels from six sets of three cartridges loaded with 540 mg Carboxen 1000. Conditioning parameters are listed in .
Table 5. Details of adsorbent conditioning experiments
shows the BTEX total peak area using various conditioning parameters. The blank response decreased >50% when cartridges were conditioned at 300°C compared to <300°C (trials 1 and 2), and by ≈ 80% for conditioning at 350°C instead of 300°C (trials 5 and 6). Increasing the nitrogen flow from 25 mL min−1 to 100 mL min−1 resulted in a 40% decrease in blank signals (trials 2 and 4). Increasing conditioning time from 10 minutes to 1 hour resulted in a 25% decrease in the blank response (trials 3 and 4). A further 70% decrease in response was observed when the conditioning time was increased from 1 hour to 20 hours (trials 5 and 6, ). These results clearly show that a progressive reduction of the cartridge blank values can be achieved by optimizing three variables, i.e. 1. increasing the conditioning temperature, 2. increasing the purge flow rate, 3. increasing the conditioning time. Ultimately, practical considerations need to be factored in for which conditions are feasible to achieve the desired background levels.
Figure 4. Total BTEX mean peak area from three cartridges filled with Carboxen 1000 adsorbent conditioned under different flow rates, temperature, and duration. Symbol shape indicates conditioning time, symbol color indicates nitrogen flow through the cartridge during conditioning, and region of the graph indicates conditioning temperature.
Adsorbent bed mass
Thermal cycling and breakdown of the carbon-based Carboxen adsorbent material has been noted as one source for contaminant peaks (Cao and Hewitt Citation1994; Helmig Citation1996). Therefore, it appeared likely that the blank signal from a cartridge scales with the mass of the adsorbent in the cartridge. Experiments were performed to investigate if reduction of the adsorbent bed mass would result in lowered blanks, while still providing sufficient trapping efficacy. Experiments were conducted with Carboxen 1000, as the experiments described above had identified this adsorbent to be the most promising choice. Carboxen 1000 cartridges were prepared with adsorbent bed masses of 27, 54, 135, 270, and 540 mg. Three cartridges of each adsorbent bed mass were conditioned at 350°C for 20 h under a nitrogen purge flow rate of 25 mL min−1 and analyzed for their blanks. Results clearly showed that the benzene blank increased with the adsorbent bed mass of the cartridge (Table S7); blank levels in the cartridge loaded with 27 mg of adsorbent were only ≈ 23% of the blanks in the 540 mg cartridges.
Next, active sampling was employed to test if the cartridges with the reduced Carboxen 1000 adsorbent bed masses were capable of adsorbing as much sample as the fully loaded tubes. Three cartridges of each mass were loaded for 10 min at a flow of 200 mL min−1 with the n-alkane/BTEX standard gas mixture. One tube of each mass was reserved as a blank.
shows the results for the collection of selected compounds from these cartridges. The low system response for ethane is indicative of the non-quantitative collection, i.e. breakthrough under the chosen sampling/adsorbent conditions. Responses for other compounds are more consistent, gradually increasing from propane through benzene and toluene before dropping again for the C2-aromatics. Lower responses of these higher aromatics do not necessarily reflect a loss in sampling efficiency, but could also be a (partial) result of a loss of these higher molecular compounds in the working standard. All n-alkanes, except ethane, had RSDs of less than 2% across all adsorbent bed masses (Table S8), showing excellent reproducibility of the determination and consistency in the results between the different adsorbent bed masses. Results for aromatic compounds had somewhat larger RSDs; for instance, RSDs for benzene and all xylene isomers were 6% and ≈ 4%, respectively. While blanks were lower for the reduced adsorbent bed cartridges (Table S7), the reduction in the adsorbent mass did not noticeably sacrifice the trapping efficiency. Therefore, an improved signal-to-noise ratio and lower detection limits will be possible with the lower adsorbent mass cartridges. A secondary benefit is that reducing the adsorbent bed mass from 540 mg to 27 mg cuts the cost for the adsorbent material per cartridge by ≈ $20 ().
Figure 5. Sampling performance of cartridges with increasing masses of Carboxen 1000. Data are mean values of three determinations. All cartridges were actively loaded by pulling the same volume of a multi-component VOC standard through the adsorbent bed. Peak areas were normalized by the analyte mixing ratio in the standard (ppb) and the analyte effective carbon number (ECN; [Scanion and Willis Citation1985]).
![Figure 5. Sampling performance of cartridges with increasing masses of Carboxen 1000. Data are mean values of three determinations. All cartridges were actively loaded by pulling the same volume of a multi-component VOC standard through the adsorbent bed. Peak areas were normalized by the analyte mixing ratio in the standard (ppb) and the analyte effective carbon number (ECN; [Scanion and Willis Citation1985]).](/cms/asset/3f646217-3acb-4969-9530-2b8ccdb42ba9/uawm_a_2000518_f0005_oc.jpg)
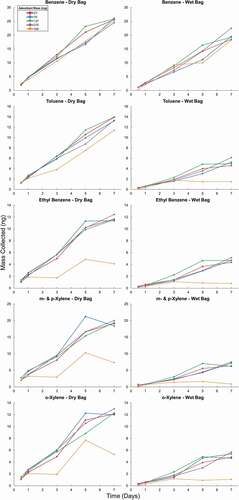
Figure 6. Mass of analytes collected from a dry test atmosphere for ethane through n-hexane (1st and 2nd column) and benzene through o-xylene (3rd and 4th column). The 1st and 3rd columns show the results from the dry test atmosphere (Dry Bag), and the 2nd and 4th column the results from the humidified test atmosphere (Wet Bag). Results are from sampling on cartridges with increasing amounts of Carboxen 1000 adsorbent over 7 days. Multiple cartridges of each adsorbent bed mass were placed in the bag at the beginning of the experiment. One cartridge of each adsorbent bed mass was removed after 0.5, 1, 3, 5, and 7 days.
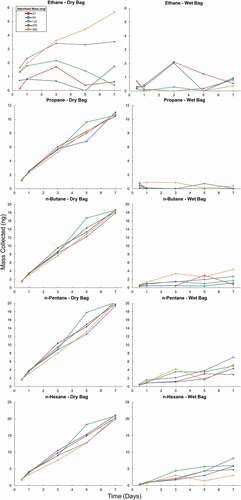
Figure 6. (Continued).
The minimum benzene peak area that we were able to achieve in the blanks (3.6 mV min) was equivalent to 4% of the signal from an actively loaded 2 L 1 ppb VOC/BTEX standard. This was equivalent to the amount of benzene that would be sampled at a mixing ratio of 0.018 ppb over three days of passive sampling at a temperature of 20°C at a diffusive uptake rate of 2.7 ng ppm−1 min−1 (see below).
This experiment was repeated with a 12x higher analyte loading (2 L of a 12 ppb standard gas mixture, or the theoretical equivalent to the mass captured from diffusively sampling a 1 ppb atmosphere for ≈ 16.5 days). Similar to the lower concentration standard, the obtained instrument response from the 27 mg cartridge was within 10% of the response of the 540 mg (fully loaded) cartridge for the C3-6 alkanes, benzene, and toluene; results were more variable for ethylbenzene and the xylenes (Figure S3).
Passive sampling experiments
The uptake rate of VOCs over time must be constant for diffusive sampling to yield a truly average concentration value over the sampling interval. This also dictates that the sampling ends before the adsorbent bed becomes saturated. This question was investigated by diffusive sampling from an artificial, constant concentration atmosphere. Cartridges were placed in a 20 L PTFE-bag that was purged continuously with a stream of a secondary VOCs working standard that included light n- alkanes, alkenes, and BTEX compounds. The ppm-level VOCs standard was diluted dynamically with VOC-free air to nmol mol−1 (ppb)-range mole fractions. Experiments were performed in both dry and humidified test atmospheres. The relative humidity in the dry experiment was 4.6 ± 0.7% RH (temperature = 19.6 ± 0.9°C). An RH of 96.5 ± 4.0% (temperature = 20.2 ± 1.1°C) was maintained during the humidified experiment by flowing the dilution gas through Nafion membrane tubing submerged in a small reservoir of water (Boylan et al. Citation2014). A small fan circulated air inside the bag. The bag was flushed at a rate of 200 mL min−1 for at least 12 h before placing the cartridges inside the bag. Cartridges filled with 27 mg, 54 mg, 135 mg, 270 mg, and 540 mg of Carboxen 1000 adsorbent were tested. An extra 540 mg cartridge was placed inside the bag with storage caps on throughout the experiment as a reference blank. A cartridge of each unique mass of adsorbent was removed after 0.5, 1, 2, 3, 5 and 7 days. Upon removal from the bag, cartridges were capped and stored at −10°C until analysis. Temperature and moisture inside the bag were recorded for the duration of the experiment. Ambient pressure data were obtained from the nearby Boulder Municipal Airport. Uptake rates (URs) were calculated as differences between two sampling time points using the formula
where Δm is the difference in the analyte mass found on the cartridges between two sampling points, Δt is the corresponding sampling interval, and c is the analyte concentration in the bag. URs were calculated for each compound and adsorbent bed mass, and for each segment of the sampling period using results from cartridges removed consecutively. Occasionally, this resulted in a negative uptake rate. We do not believe that compounds were desorbing during the sampling period; rather these results stem from the precision error of the successive determinations.
Uptake in dry air
In the dry test atmosphere, propane, butane, pentane, hexane, benzene, and toluene showed a steady increase in VOC mass loading throughout the seven-day period for all adsorbent bed masses. Correlation coefficients (R2) for the linear regression analysis of the collected analyte mass versus the sampling time range from 0.993 to 0.999. Uptake behavior was similar across all adsorbent bed masses, supporting the finding of the actively loaded experiment that lower mass adsorbent cartridges were sufficient for achieving quantitative sampling. Ethane uptake was nonlinear throughout the sampling, except for cartridges loaded with 540 mg of adsorbent. Ethane is the most volatile of the tested VOCs. Again, this nonlinearity is most likely a reflection of the adsorbent having saturated and ethane breaking through the adsorbent bed under these sampling conditions. The uptake rates of ethylbenzene and all xylene isomers slowed toward the end of the sampling period for all masses of adsorbent. Cartridges loaded with 540 mg of adsorbent showed more variable recovery rates for ethylbenzene and meta- and para-xylene. These results most likely reflect a reduction and higher variability in the desorption efficiency from this strong Carboxen 1000 adsorbent for these heavier compounds rather than the analyte uptake.
VOCs sampling in humidified air
The uptake experiment was repeated with a test atmosphere where the standard was diluted with close to saturated humidified air, resulting in a 95% RH. This humidity level was maintained throughout the entire sampling interval. These conditions present a worst case scenario that is rather unlikely for real world ambient conditions. The humidity compromised the uptake of all compounds. Sampling of propane and ethane was nonlinear and near the limit of detection. For the larger n-alkanes and BTEX compounds, collected analyte masses were 30–80% lower than in the dry test atmosphere. For n-butane, only 12% of the mass collected in the dry test atmosphere was collected. Recoveries of toluene, ethylbenzene, and the xylenes were less than 40%. Benzene uptake was the least affected by the humidity with 80% recovery. Uptake was most linear for the BTEX compounds in cartridges loaded with 135 and 270 mg of adsorbent. These results under this extreme humidity scenario demonstrate the strong influence of water vapor on the uptake and retention of VOCs on the Carboxen adsorbent and the potential sensitivity and deteriorated performance of the VOCs passive sampling stemming from the presence of high levels of atmosphere water vapor. The series of ambient experiments described below demonstrate a more moderate influence and compromised performance under real-world humidity conditions.
Water uptake onto Carboxen 1000
To investigate causes of the reduced VOC update rates and water uptake to the adsorbent in the humidified air, 200 mL min−1 of humidified air with levels of <5%, 27%, 57%, 75% and 92% RH were actively sampled through the cartridges with adsorbent beds of 540, 135, and 27 mg of Carboxen 1000. The cartridges were weighed at increasing time intervals to determine the mass of water that had accumulated. Sampling was halted after cartridges no longer showed a weight gain. An empty cartridge was weighed alongside the loaded cartridges to correct for drifts of the balance. Results are shown in , and in graphical format in Figure S4 .
Table 6. Summary of H2O loading experiment. A 200 mL min−1 stream of zero air humidified to different RH % was sampled over three different adsorbent bed masses until the weight gain leveled off. The volume of humidified air and the saturation mass of H2O loaded are shown for each adsorbent bed mass and RH %
Table 7. Median uptake rates (n = 30) of cartridges loaded with 27, 54, 135, 270, and 540 mg of Carboxen 1000 adsorbent in dry and humidified simulated environments over the course of 0.5–7 days. Relative Standard Deviation results were calculated from the differentials of the day-to-day data
The water uptake was not linear and increased steeply at higher humidity. Water uptake was minimal for all cartridges at RH ≤ 57%, but increased by a factor of 20 at RH > 75%. The amount of water collected on the adsorbent was 10 mg (water) g−1 (adsorbent) for the 135 mg and 540 mg cartridges, and 40 mg g−1 for the 27 mg cartridge at the lower %RH levels (<57%). In the moister test atmospheres, the water uptake was significantly higher, up to a rate of 630 mg g−1 for the 27 mg cartridge. Similar non-linear water uptake dependencies on carbon-based adsorbents have been reported previously by Helmig and Vierling (Citation1995). Their study showed that the adsorbents Carboxen 569 and Carbosieve SIII collected < 20 mg H2O g−1 at RH ≤ 40%, but 60–400 mg H2O g−1 at RH ≥ 60%. Our results add to this previous literature, demonstrating that stronger adsorbents tend to be more hydrophilic, which increases their affinity to collect atmospheric water vapor. This in turn reduces their capacity for uptake of VOCs, and limits the collection efficiency, precision, and applicability of these type of adsorbents in humid and variable humidity environments.
In real world applications, adsorbent cartridges will be exposed to variable RH conditions as atmospheric moisture fluctuates throughout the day as well as from day to day. For example, the frequency distribution of ambient relative humidity for a site near Boulder over a 15-year period (Figure S5) shows that RH was ≤57% in 72% of the measurements, and only 14% of the time, RH was >75% RH. Consequently, the interference and potential reduction in the passive sampling rate will fluctuate with the change in humidity conditions, and in this environment, during most times, the water uptake and interference will be relatively low.
The water uptake and its dependence on relative humidity have some important implications for real-world sampling application. In areas near emission sources, VOC concentrations are typically higher at night due to shallow boundary layer heights and weaker convective mixing. For instance, at a site near O&NG operations near Platteville, CO, most of the highest benzene mole fractions were observed at night; nighttime values were approximately three times higher than daytime values (Halliday et al. Citation2016). Generally, lower nighttime temperatures cause the RH to be higher. Higher nighttime mixing ratios of VOCs should increase the collection of these compounds by the cartridges. As shown in our experiments, at the higher nighttime RH levels, the collection efficiency of the cartridges will become weaker. An open question is, therefore, what is the real-world effectiveness of this sampling strategy as mixing ratio and RH conditions vary back and forth? These dependencies will likely cause a bias in the VOC sampling, with elevated nighttime mixing ratios being underrepresented in the integrated sampling. Another question that our findings do not (yet) answer is if and to what degree do URs rebound under dryer conditions that follow higher RH conditions.
Uptake rates
URs are valuable metrics that have been used to calculate atmospheric VOCs mixing ratios during passive adsorbent sampling (Perkin-Elmer Citation1991) based on solely theoretical considerations, without need for a calibration setup as used in our study:
UR, in ng ppm−1 min−1, for the data presented in are provided in Figures S6 and S7. Median URs (excluding ethane) in the dry test atmosphere were 1.4–5.1 times higher than in the humidified test atmosphere. UR of benzene were least affected by humidity, UR for propane were most affected, and in general, URs of alkanes decreased more in the humidified test atmosphere than URs of aromatics. shows that the variability of URs over the daily segments of a week of sampling in the dry and wet test atmosphere ranged from 66% to 144%, and from 93% to 364% in the humidified test atmosphere, respectively.
Table 8. Comparison of passive sampling uptake rates (in units of mL min−1) for BTEX compounds reported in the literature and results from this study. An “x” in the diffusion cap (Diff. cap) column indicates studies that used a diffusion cap
It is remarkable that URs for BTEX compounds that are reported in the literature are relatively consistent () despite the adsorbent choice, adsorbent mass, and environmental conditions (URs are commonly converted and reported in units of mL min−1 to eliminate a mixing ratio dependency and reflect an equivalent sample volume flow rate (Koutrakis et al. Citation1993; Seethapathy, Gorecki, and Li Citation2008)). Importantly, these studies all build on the same size of adsorbent cartridge, i.e. the Perkin-Elmer type cartridges, which have a groove 1.5 cm from the front opening that the metal gauze is pushed against, which fixes the diffusion path volume and length to a consistent distance. The consistency in these results shows that for these analyte-adsorbent combinations the diffusive uptake is largely controlled by the diffusion path and not by the adsorbent strength. Our BTEX data that can be compared with previous studies are included in , with results differentiated for the dry and humidified tests. Median URs from the five Carboxen 1000 adsorbent bed masses are in relatively good agreement (). The median UR results from the sampling under the dry conditions compare reasonably well with the UR results in other studies, despite the relatively high RSDs. Notably, the agreement is better for the low RH experiments, where our URs are within 10% of the median literature data for the C2-aromatics, and within a factor of ≈ two for benzene and toluene.
Year 2016 field results using the optimized cartridges
Cartridges were again deployed alongside canisters in October and November 2016 on the roof of the SEEC building on the University of Colorado Boulder’s East Campus. This site is ≈ 100 m from Foothills Parkway, a major thoroughfare for commuters moving north or south through Boulder. Cartridges and canisters were deployed for 3 day-periods on 10 occasions. The deployed cartridges contained 27 mg of Carboxen 1000 adsorbent and were conditioned for 20 hours at 350°C with 25 mL min−1 N2 flow. Linear correlation results for cartridge with canister data comparisons (PCCs, and p-values, median RSDs, and median RSDRs) are summarized in . In , results from the 2016 campaign are placed side by side with the earlier (2014) field study. Relatively poor correlations were found for ethane and alkenes across all sampling periods. Significantly better results, with PCCs > 0.75, were obtained for propane, n-butane, i-pentane, and n-pentane. PCCs improved in the 2016 campaign for ethane, propane, and n-butane. PCCs in the 2016 campaign were within 0.1 units of the 2014 campaigns for i-butane, i-pentane, and n-pentane. It needs to be considered that absolute analyte mole fractions ratios during the 2016 campaign were significantly lower than during the 2014 campaigns (). Consequently, while the comparison produced similar statistical results in the 2016 and 2014 campaign, overall this represents an improvement given the lower sample mole fractions in 2016 ().
Table 9. Linear regression results for paired canister and cartridge sampling with Pearson correlation coefficients and p-values for the 2016 campaign. Canister and cartridge median relative standard deviations (RSDs), and median of the ratio of the RSDs of both methods (relative standard deviation ratios (RSDRs: cartridge RSD/canister RSD))
Figure 7. Pearson Correlation of canister and cartridge data during the 2014 BCPH field campaign (Carboxen 1016/1000), the winter 2014 comparison study (Carboxen 1016/1000), and the 2016 comparison study (27 mg of Carboxen 1000). Data for some compounds are not available for each campaign. P-Values and RSDRs are available in and .
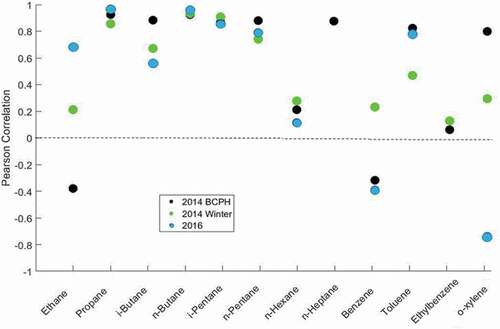
Figure 8. RSD of paired passive VOC sampling on adsorbent cartridges versus the ambient mixing ratio (from the canister sampling) during the 2014 and 2016 field deployments. Please note the different sampling strategies deployed during the two campaigns (see text).
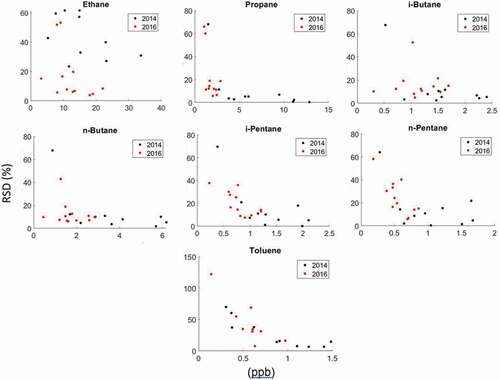
The repeatability error (RSD) of the canister methods from the paired sampling () was <11% for all compounds. RSDs of the cartridge analyses were generally larger, but cartridge RSDs for C3-C6 alkanes in the winter 2014 campaign were all <10%. C3-C6 alkane RSDs from cartridge samples in the 2016 campaign were in many cases twice what they were in 2014, but the ratio of the RSD (RSDR) for cartridge results/canister results was lower for many compounds in 2016, indicating a relative improvement in the cartridge sampling. This also suggested that the larger absolute RSDs observed in 2016 were likely due to lower mixing ratios or more variable conditions during that campaign, rather than inconsistent sampling: Average VOCs mixing ratios during the 2014 field campaigns were four times higher than during the 2016 campaign (Table S9). An analysis of the dependency of RSD on absolute mixing ratio shows that for propane, RSDs drop below 10% at mixing ratios > 4 ppb. RSDs for propane, i-butane, n-butane, i-pentane, and n-pentane were below 20% at mixing ratios > 2 ppb. The comparison of the benzene determination was difficult to evaluate given the much different range of blanks and ambient levels observed in these deployments. RSDs for toluene drop to <50% at levels > 0.5 ppb. The overall pattern in these results reflects the classical dependence of the measurement precision on the absolute mole fraction, where the relative precision error become smaller with increasing analyte mole fraction. These experiments demonstrate that the sensitivity and analytical performance vary by compound. Depending on the VOC, under conditions encountered in our studies, RSDs < 25% could be achieved at mixing ratios of >0.5– 4 ppb. This approximately defines the lower limit of mixing ratios where this passive sampling method is applicable for these O&NG analytes over the 3-day sampling window. An array of recent studies has found significantly enhanced levels of VOCs, particularly the light n-alkanes, in the vicinity and downwind of oil and gas operations. Light alkanes have been reported at levels 1–2 order of magnitudes higher than in urban air, approaching and at times exceeding the 100-ppb threshold (Cheadle et al. Citation2017; Gilman et al. Citation2013; Halliday et al. Citation2016; Pétron et al. Citation2014; Roest and Schade Citation2017). Consequently, the sensitivity of this passive cartridge sampling for propane, and the butane and pentane isomers, is sufficient for a semi-quantitative assessment of the exposure levels to these compounds under those conditions. BTEX compounds make up a smaller percentage of O&NG emissions. For most studies, the range of reported ambient air BTEX VOC mixing ratios stretches from 0.1 – single digits of ppb (Halliday et al. Citation2016; Helmig et al. Citation2014; Pétron et al. Citation2012, Citation2014; Rappenglueck et al. Citation2014; Thompson, Hueber, and Helmig Citation2014). While RSDs for BTEX compounds were somewhat higher, passive sampling is suitable for providing a first assessment of exposure levels for these compounds at levels of approximately >0.5–1 ppb. This method sensitivity would be insufficient for determining these VOCs in the background atmosphere and most residential and urban settings over a 3-day sampling interval. Lower detection limits could likely be achieved by extending the sampling time.
Summary and conclusion
Carboxen 1000 was found to be the most suitable adsorbent (compared to Tenax-GR, Carboxen 1016, and a combination of Carboxen 1000 and 1016) for passive sampling of C3-C5 petrochemical hydrocarbons, yielding the highest trapping efficiency, lowest blanks, and lowest RSDs in experiments conducted in the laboratory. Reducing the blank signals was a key factor in improving the sensitivity of the samplers, and was achieved with more stringent cartridge conditioning procedures, and decreased adsorbent bed masses in each cartridge. Best results were achieved for cartridges loaded with a significantly lower quantity of adsorbent (27 mg, ≈ 5% of the possible maximum cartridge capacity), without sacrificing sampling performance. With these improvements, linear passive uptake on Carboxen 1000 was observed in a simulated environment with ≈1 ppb VOCs mixing ratios of a standard mixture.
Laboratory experiments demonstrated the effect of humidity on the cartridge samplers. Elevated RH reduced VOC sampling significantly; median uptake rates of C3-C6 alkanes and BTEX compounds in worst-case scenario humidified test atmosphere were, on average, 27–39% of those in the dry test atmosphere. This dependency inferred that VOCs were collected at a slower rate during high RH conditions, such as during wet/rainy weather and at night, when RH typically is higher. Ambient VOC levels are often higher at night near O&NG emissions sources due to suppressed boundary layer mixing. As a result, this effect will likely cause a low bias in ambient VOC monitoring by passive sampling because of reduced uptake during the times of day when ambient concentrations are highest.
There is a remarkably good agreement in published uptake rates of BTEX compounds across studies that used adsorbent cartridges with the same physical dimensions. Our average URs observed in the 7-day experiment in simulated environments for BTEX compounds were within the standard deviation of literature values.
Carboxen 1000 cartridges were deployed alongside sampling canisters during three field campaigns. Linear regressions of cartridge versus canister results for light alkanes and BTEX compounds were used to assess the correlation and agreement of the two sampling methods. With the canister results considered the reference standard in these analyses, linear correlation results with R2 > 0.70 were observed for propane, n-butane, i-pentane, and n-pentane. During field deployments with ambient mixing ratios above 1–4 ppb, RSDs for parallel sample collections were 10–20% for C3-C5 hydrocarbons. These findings are an improvement and extension to the more volatile and selective C3 and C4 O&NG tracers compared to applications reported in previous literature. The agreement of the cartridge results with the canister sampling, and the analytical sensitivity and reproducibility, are sufficient for evaluating exposure to these O&NG emissions in environmental settings, at significantly lower cost and effort in comparison to canister sampling.
O_NG_VOCs_Passive_Sampling_Supplemental_Materials_September_30_2021_JAWMA.pdf
Download PDF (880.7 KB)Acknowledgment
The authors acknowledge help with the manuscript development from Samuel Rossabi.
Disclosure statement
No potential conflict of interest was reported by the author(s).
Supplementary material
Supplemental data for this paper can be accessed on the publisher’s website
Additional information
Funding
Notes on contributors
Detlev Helmig
Detlev Helmig oversaw this study during his employment as an Associate Research Professor at the University of Colorado's Institute of Arctic and Alpine Research (INSTAAR). He is now the principal of Boulder Atmosphere Innovation Research (A.I.R.) LLC, a small private company that provides air quality monitoring services to regional municipalities.
Jens Fangmeyer
Jens Fangmeyer contributed to this study as a visiting internship student from the University of Muenster, Germany. He is now employed at Currenta GmbH & Co in Leverkusen, Germany.
Joshua Fuchs
Joshua Fuchs contributed to this study as a visiting internship student from the University of Muenster, Germany. He is now employed at Merck KGaA, in Darmstadt, Germany.
Jacques Hueber
Jacques Hueber is a research engineer. He contributed to the study while employed at the University of Colorado's Institute of Arctic and Alpine Research (INSTAAR). He is now an independent consultant at JH Atmospheric Instrumentation Design located in Boulder, Colorado.
Kate Smith
Katie Smith contributed to this study as a visiting internship student from the University of York, U.K. She is currently a postdoctoral associate at the University of Miami, USA.
References
- Abbatt, J. P. D., J. L. Thomas, K. Abrahamsson, C. Boxe, A. Granfors, A. E. Jones, M. D. King, A. Saiz-Lopez, P. B. Shepson, J. Sodeau, et al. 2012. Halogen activation via interactions with environmental ice and snow in the polar lower troposphere and other regions. Atmos. Chem. Phys. 12 (14):6237–71. doi:https://doi.org/10.5194/acp-12-6237-2012.
- Allen, D. T., V. M. Torres, J. Thomas, D. W. Sullivan, M. Harrison, A. Hendler, S. C. Herndon, C. E. Kolb, M. P. Fraser, A. D. Hill, et al. 2013. Measurements of methane emissions at natural gas production sites in the United States. Proc. Natl. Acad. Sci. U.S.A. 110 (44):17768–73. doi:https://doi.org/10.1073/pnas.1304880110.
- Arndt, D. S., J. Blunden, and R. J. H. Dunn. 2017. State of the climate in 2016. Bull. Am. Meteorol. Soc. 98: S1-+. doi:https://doi.org/10.1175/2017BAMSStateoftheClimate.1.
- Ballesta, P. P., E. Grandesso, R. A. Field, and A. Cabrerizo. 2016. Validation and modelling of a novel diffusive sampler for determining concentrations of volatile organic compounds in air. Anal. Chim. Acta 908:102–12. doi:https://doi.org/10.1016/j.aca.2015.12.032.
- Ballester, F., M. Estarlich, C. Iniguez, S. Llop, R. Ramon, A. Esplugues, M. Lacasana, and M. Rebagliato. 2010. Air pollution exposure during pregnancy and reduced birth size: A prospective birth cohort study in Valencia, Spain. Environ. Health 9 (1). doi: https://doi.org/10.1186/1476-069x-9-6.
- Bowen, S. E., S. Irtenkauf, J. H. Hannigan, and A. L. Stefanski. 2009. Alterations in rat fetal morphology following abuse patterns of toluene exposure. Reprod. Toxicol. 27 (2):161–69. doi:https://doi.org/10.1016/j.reprotox.2009.01.002.
- Bowman, F. M., and J. H. Seinfeld. 1994. Ozone productivity of atmospheric organics. J. Geophys. Res.-Atmos. 99 (D3):5309–24. doi:https://doi.org/10.1029/93jd03400.
- Boylan, P., D. Helmig, and J. H. Park. 2014. Characterization and mitigation of water vapor effects in the measurement of ozone by chemiluminescence with nitric oxide. Atmos. Meas. Tech. 7 (5):1231–44. doi:https://doi.org/10.5194/amt-7-1231-2014.
- Brantley, H. L., E. D. Thoma, and A. P. Eisele. 2015. Assessment of volatile organic compound and hazardous air pollutant emissions from oil and natural gas well pads using mobile remote and on-site direct measurements. J. Air Waste Manage. Assoc. 65 (9):1072–82. doi:https://doi.org/10.1080/10962247.2015.1056888.
- Brown, R. H. 2000. Monitoring the ambient environment with diffusive samplers: Theory and practical considerations. J. Environ. Monit. 2 (1):1–9. doi:https://doi.org/10.1039/a906404d.
- Bruno, P., M. Caselli, G. de Gennaro, S. Iacobellis, and M. Tutino. 2008. Monitoring of volatile organic compounds in non-residential indoor environments. Indoor Air 18 (3):250–56. doi:https://doi.org/10.1111/j.1600-0668.2008.00528.x.
- Cao, X. L., and C. N. Hewitt. 1994. Buildup of artifacts on adsorbents during storage and its effect on passive sampling and gas chromatography-flame ionization detection of low concentrations of volatile organic compounds in air. J. Chromatogr. A 688 (1–2):368–74. doi:https://doi.org/10.1016/0021-9673(94)00908-2.
- Chameides, W. L., F. Fehsenfeld, M. O. Rodgers, C. Cardelino, J. Martinez, D. Parrish, W. Lonneman, D. R. Lawson, R. A. Rasmussen, P. Zimmerman, et al. 1992. Ozone precursor relationships in the ambient atmosphere. J. Geophys. Res. 97 (D5):6037–55. doi:https://doi.org/10.1029/91JD03014.
- Cheadle, L. C., S. J. Oltmans, G. Pétron, R. C. Schnell, E. J. Mattson, S. C. C. Herndon, A. M. Thompson, D. R. Blake, and A. McClure-Begley. 2017. Surface ozone in the Colorado northern front range and the influence of oil and gas development during FRAPPE/DISCOVER-AQ in summer 2014. Elementa - Sci. Anthropocene 1–23. doi:https://doi.org/10.1525/elementa.254.
- Ciccioli, P., A. Cecinato, E. Brancaleoni, M. Frattoni, and A. Liberti. 1992. Use of carbon adsorption traps combined with high-resolution gas-chromatograpy-mass-spectrometry for the analysis of polar and nonpolar C4-C14 hydrocarbons involved in photochemical smog formation. HRC-J. High Resolut. Chromatogr. 15 (2):75–84. doi:https://doi.org/10.1002/jhrc.1240150205.
- Civan, M. Y., S. Yurdakul, and G. Tuncel. 2012. Improvement of uptake rate equations depending on meteorological conditions for 25 volatile organic compounds. Talanta 99:720–29. doi:https://doi.org/10.1016/j.talanta.2012.07.011.
- COGCC. 2012. Statement of basis, specific statutory authority, and purpose new rules and amendments to current rules of the Colorado oil and gas conservation commission, 2 CCR 404‐1. Accessed December 17, 2021. https://cogcc.state.co.us/documents/reg/Rules/2012/setback/Final_SetbackRules-StatementOfBasisAndPurpose.pdf.
- Colborn, T., K. Schultz, L. Herrick, and C. Kwiatkowski. 2014. An exploratory study of air quality near natural gas operations. Hum. Ecol. Risk Assess.: Int. J. 20 (1):86–105. doi:https://doi.org/10.1080/10807039.2012.749447.
- CPR. 2017. Despite new rules, Colorado neighborhoods still quarrel with large-scale oil and gas sites. Accessed March, 2017. http://www.cpr.org/news/story/despite-new-rules-colorado-neighborhoods-still-quarrel-with-large-scale-oil-and-gas-sites#.WJyS-q7ykTA.facebook.
- Dadvand, P., J. Parker, M. L. Bell, M. Bonzini, M. Brauer, L. A. Darrow, U. Gehring, S. V. Glinianaia, N. Gouveia, E. H. Ha, et al. 2013. Maternal exposure to particulate air pollution and term birth weight: A multi-country evaluation of effect and heterogeneity. Environ. Health Perspect. 121 (3):367–73. doi:https://doi.org/10.1289/ehp.1205575.
- Dorter, M., M. Odabasi, and S. Yenisoy-Karakas. 2020. Source apportionment of biogenic and anthropogenic VOCs in Bolu plateau. Sci. Total Environ. 731:18. doi:https://doi.org/10.1016/j.scitotenv.2020.139201.
- EIA. 2012. Total energy. Accessed March 31, 2021. https://www.eia.gov/totalenergy/data/annual/showtext.php?t=ptb0502.
- EIA. 2021. What countries are the top producers and consumers of oil? Accessed March 31, 2021. https://www.eia.gov/tools/faqs/faq.php?id=709&t=6.
- Eisele, A. P., S. Mukerjee, L. A. Smith, E. D. Thoma, D. A. Whitaker, K. D. Oliver, T. Wu, M. Colon, L. Alston, T. A. Cousett, et al. 2016. Volatile organic compounds at two oil and natural gas production well pads in Colorado and Texas using passive samplers. J. Air Waste Manage. Assoc. 66 (4):412–19. doi:https://doi.org/10.1080/10962247.2016.1141808.
- Fabbri, A., G. Crescentini, F. Mangani, A. R. Mastrogiacomo, and F. Bruner. 1987. Advances in the determination of volatile organic solvents and other organic pollutants by gas chromatograph with thermal desorption sampling and injection. Chromatographia 23 (11):856–60. doi:https://doi.org/10.1007/bf02311413.
- Fann, N., K. R. Baker, E. A. W. Chan, A. Eyth, A. Macpherson, E. Miller, and J. Snyder. 2018. Assessing human health PM 2.5 and ozone impacts from U.S. oil and natural gas sector emissions in 2025. Environ. Sci. Technol. 52 (15):8095–103. doi:https://doi.org/10.1021/acs.est.8b02050.
- Flocke, F., G. Pfister, J. H. Crawford, K. E. Pickering, G. Pierce, D. Bon, and P. Reddy. 2020. Air quality in the northern Colorado front range metroarea: The Front Range Air Pollution andPhotochemistry Éxperiment (FRAPPÉ). J. Geophys. Res. 125 (2):1–22. doi:https://doi.org/10.1029/2019JD031197.
- Franco, B., E. Mahieu, L. K. Emmons, Z. A. Tzompa-Sosa, E. V. Fisher, K. Sudo, B. Bovy, S. Conway, D. Griffin, J. Hannigan, et al. 2016. Evaluating ethane and methane emissions associated with the development of oil and natural gas extraction in North America. Environ. Res. Lett. 11 (4):1–11. doi:https://doi.org/10.1088/1748-9326/11/4/044010.
- Gallego, E., P. Teixidor, F. Javier Roca, J. Francisco Perales, and E. Gadea. 2018. Outdoor air 1,3-butadiene monitoring: Comparison of performance of Radiello (R) passive samplers and active multi-sorbent bed tubes. Atmos. Environ. 182:9–16. doi:https://doi.org/10.1016/j.atmosenv.2018.03.022.
- Ghosh, J. K. C., M. Wilhelm, J. Su, D. Goldberg, M. Cockburn, M. Jerrett, and B. Ritz. 2012. Assessing the influence of traffic-related air pollution on risk of term low birth weight on the basis of land-use-based regression models and measures of air toxics. Am. J. Epidemiol. 175 (12):1262–74. doi:https://doi.org/10.1093/aje/kwr469.
- Gilman, J. B., B. M. Lerner, W. C. Kuster, and J. A. de Gouw. 2013. Source signature of volatile organic compounds from oil and natural gas operations in northeastern Colorado. Environ. Sci. Technol. 47 (3):1297–305. doi:https://doi.org/10.1021/es304119a.
- Halliday, H. S., A. M. Thompson, A. Wisthaler, D. R. Blake, R. S. Hornbrook, T. Mikoviny, M. Muller, P. Eichler, E. C. Apel, and A. J. Hills. 2016. Atmospheric benzene observations from oil and gas production in the Denver-Julesburg Basin in July and August 2014. J. Geophys. Res. 121:11055–74. doi:https://doi.org/10.1002/2016jd025327.
- Hellen, H., H. Hakola, T. Laurila, V. Hiltunen, and T. Koskentalo. 2002. Aromatic hydrocarbon and methyl tert-butyl, ether measurements in ambient air of Helsinki (Finland) using diffusive samplers. Sci. Total Environ. 298 (1–3):55–64. doi:https://doi.org/10.1016/s0048-9697(02)00168-7.
- Helmig, D., C. R. Thompson, J. Evans, P. Boylan, J. Hueber, and J. H. Park. 2014. Highly elevated atmospheric levels of volatile organic compounds in the Uintah Basin, Utah. Environ. Sci. Technol. 48 (9):4707–15. doi:https://doi.org/10.1021/es405046r.
- Helmig, D., F. Bocquet, J. Pollmann, and T. Revermann. 2004. Analytical techniques for sesquiterpene emission rate studies in vegetation enclosure experiments. Atmos. Environ. 38 (4):557–72. doi:https://doi.org/10.1016/j.atmosenv.2003.10.012.
- Helmig, D., and L. Vierling. 1995. Water-adsorption capacity of the solid adsorbents Tenax-TA, Tenax-GR, Carbotrap, Carbotrap-C, Carbosieve-SIII, and Carboxen-569 and water management techniques for the atmospheric sampling of volatile organic trace gases. Anal. Chem. 67 (23):4380–86. doi:https://doi.org/10.1021/ac00119a029.
- Helmig, D., N. Schwarzer, and J. Steinhanses. 1990. Flame control accessory for gc-fid operation with autosampler injection. HRC-J. High Resolut. Chromatogr. 13 (12):849–51. doi:https://doi.org/10.1002/jhrc.1240131214.
- Helmig, D., S. Rossabi, J. Hueber, P. Tans, S. Montzka, K. Masarie, K. Thoning, C. Plass-Duelmer, A. Claude, L. Carpenter, et al. 2016. Reversal of global atmospheric ethane and propane trends largely due to US Oil and natural gas production. Nat. Geosci. 9 (7):490–95. doi:https://doi.org/10.1038/ngeo2721.
- Helmig, D. 1996. Artifact-free preparation, storage and analysis of solid adsorbent sampling cartridges used in the analysis of volatile organic compounds in air. J. Chromatogr. A 732 (2):414–17. doi:https://doi.org/10.1016/0021-9673(95)01376-8.
- Helmig, D. 1997. Ozone removal techniques in the sampling of atmospheric volatile organic trace gases. Atmos. Environ. 31 (21):3635–51. doi:https://doi.org/10.1016/S1352-2310(97)00144-1.
- Helmig, D. 2020. Policy Bridge: Air quality impacts from oil and natural gas development in Colorado. Elememta Sci. Anthropocene 8:1–33. doi:https://doi.org/10.1525/elementa.398.
- Howarth, R. W., A. Ingraffea, and T. Engelder. 2011. Natural gas: Should fracking stop? Nature 477 (7364):271–75. doi:https://doi.org/10.1038/477271a.
- Huang, C., L. Tong, X. R. Dai, and H. Xiao. 2018. Evaluation and application of a passive air sampler for atmospheric volatile organic compounds. Aerosol Air Qual Res 18 (12):3047–55. doi:https://doi.org/10.4209/aaqr.2018.03.0096.
- Huff, J. 2007. Benzene-induced cancers: Abridged history and occupational health impact. Int. J. Occup. Environ. Health 13 (2):213–21. doi:https://doi.org/10.1179/oeh.2007.13.2.213.
- Iso, I. S. O. 1999. Ambient, indoor and workplace air ± determination of concentrations of volatile organic compounds in air, thermal desorption method ± part 2: diffusive sampling method. ISO/DIS, 16017-2.
- Jia, C. R., and X. Q. Fu. 2017. Diffusive uptake rates of volatile organic compounds on standard ATD tubes for environmental and workplace applications. Environments 4 (87): 1–19.
- Karion, A., C. Sweeney, G. Pétron, G. Frost, M. Hardesty, J. Kofler, B. R. Miller, T. Newberger, S. Wolter, R. Banta, et al. 2013. Methane emissions estimate from airborne measurements over a western United States natural gas field. Geophys. Res. Lett. 40 (16):1–5. doi:https://doi.org/10.1002/grl.50811.
- Kerchich, Y., and R. Kerbachi. 2012. Measurement of BTEX (benzene, toluene, ethybenzene, and xylene) levels at urban and semirural areas of Algiers City using passive air samplers. J. Air Waste Manage. Assoc. 62 (12):1370–79. doi:https://doi.org/10.1080/10962247.2012.712606.
- Koutrakis, P., J. M. Wolfson, A. Bunyaviroch, S. E. Froehlich, K. Hirano, and J. D. Mulik. 1993. Measurement of ambient ozone using a nitrite-coated filter. Anal. Chem. 65 (3):209–14. doi:https://doi.org/10.1021/ac00051a004.
- Krupa, S. V., and A. H. Legge. 2000. Passive sampling of ambient, gaseous air pollutants: An assessment from an ecological perspective. Environ. Pollut. 107 (1):31–45. doi:https://doi.org/10.1016/s0269-7491(99)00154-2.
- Kurpius, M. R., M. McKay, and A. H. Goldstein. 2002. Annual ozone deposition to a Sierra Nevada ponderosa pine plantation. Atmos. Environ. 36 (28):4503–15. doi:https://doi.org/10.1016/S1352-2310(02)00423-5.
- Lucialli, P., S. Marinello, E. Pollini, M. Scaringi, S. Z. Sajani, S. Marchesi, and L. Cori. 2020. Indoor and outdoor concentrations of benzene, toluene, ethylbenzene and xylene in some Italian schools evaluation of areas with different air pollution. Atmos. Pollut. Res. 11 (11):1998–2010. doi:https://doi.org/10.1016/j.apr.2020.08.007.
- Lupo, P. J., E. Symanski, D. K. Waller, W. Y. Chan, P. H. Langlois, M. A. Canfield, and L. E. Mitchell. 2011. Maternal exposure to ambient levels of benzene and neural tube defects among offspring: Texas, 1999-2004. Environ. Health Perspect. 119 (3):397–402. doi:https://doi.org/10.1289/ehp.1002212.
- Macey, G. P., R. Breech, M. Chernaik, C. Cox, D. Larson, D. Thomas, and D. O. Carpenter. 2014. Air concentrations of volatile compounds near oil and gas production: A community-based exploratory study. Environ. Health 13 (1). doi: https://doi.org/10.1186/1476-069x-13-82.
- Markes. 2021. Listing of uptake rates for axial passive samplers. Accessed March 30, 2021. https://markes.com/content-hub/application-notes/application-note-001.
- McKenzie, L. M., B. Blair, J. Hughes, W. B. Allshouse, N. J. Blake, D. Helmig, P. Milmoe, H. Halliday, D. R. Blake, and J. L. Adgate. 2018. Ambient nonmethane hydrocarbon levels along Colorado’s Northern Front Range: Acute and chronic health risks. Environ. Sci. Technol. 52 (8):4514–25. doi:https://doi.org/10.1021/acs.est.7b05983.
- McKenzie, L. M., J. Crooks, J. L. Peel, B. D. Biafr, S. Brindley, W. B. Allshouse, S. Malin, and J. L. Adgate. 2019. Relationships between indicators of cardiovascular disease and intensity of oil and natural gas activity in Northeastern Colorado. Environ. Res. 170:56–64. doi:https://doi.org/10.1016/j.envres.2018.12.004.
- McKenzie, L. M., R. Guo, R. Z. Witter, D. A. Savitz, L. S. Newman, and J. L. Adgate. 2014. Birth outcomes and maternal residental proximity to natural gas development in rural Colorado. Environ. Health Perspect. 122 (4):A232–A233. doi:https://doi.org/10.1289/ehp.1408647R.
- McKenzie, L. M., R. Guo, R. Z. Witter, D. A. Savitz, L. S. Newman, and J. L. Adgate. 2015. Birth outcomes and maternal residential proximity to natural gas development in rural Colorado. Environ. Health Perspect. doi:https://doi.org/10.1289/ehp.1306722.
- Mentese, S., and B. Bas. 2020. A Year - round motoring of ambient volatile organic compounds across Dardanelles strait. J. Chem. Metrol. 14 (2):177–89. doi:https://doi.org/10.25135/jcm.51.20.09.1816.
- Mowrer, J., P.-A. Svanberg, A. Potter, and A. Lindskog. 1996. Diffusive monitoring of C6—C9 hydrocarbons in urban air in Sweden. The Analyst 121 (9):1295–300. doi:https://doi.org/10.1039/AN9962101295.
- Mukerjee, S., L. A. Smith, E. D. Thoma, K. D. Oliver, D. A. Whitaker, T. Wu, M. Colon, L. Alston, T. A. Cousett, and C. Stallings. 2016. Spatial analysis of volatile organic compounds in South Philadelphia using passive samplers. J. Air Waste Manage. Assoc. 66 (5):492–98. doi:https://doi.org/10.1080/10962247.2016.1147505.
- Oury, B., F. Lhuillier, J. C. Protois, and Y. Morele. 2006. Behavior of the GABIE, 3M 3500, PerkinElmer Tenax TA, and RADIELLO 145 diffusive samplers exposed over a long time to a low concentration of VOCs. J. Occup. Environ. Hyg. 3 (10):547–57. doi:https://doi.org/10.1080/15459620600906613.
- Palmes, E. D., and A. F. Gunnison. 1973. Personal monitoring device for gaseous contaminants. Am. Ind. Hyg. Assoc. J. 34 (2):78–81. doi:https://doi.org/10.1080/0002889738506810.
- Perkin-Elmer. 1991. ATD 400 User’s Manual, Uptake Rates, edited by B. Perkin-Elmer.
- Pétron, G., A. Karion, C. Sweeney, B. R. Miller, S. A. Montzka, G. J. Frost, M. Trainer, P. Tans, A. Andrews, J. Kofler, et al. 2014. A new look at methane and nonmethane hydrocarbon emissions from oil and natural gas operations in the Colorado Denver-Julesburg Basin. J. Geophys. Res. 119:6836–52. doi:https://doi.org/10.1002/2013jd021272.
- Pétron, G., G. Frost, B. R. Miller, A. I. Hirsch, S. A. Montzka, A. Karion, M. Trainer, C. Sweeney, A. E. Andrews, L. Miller, et al. 2012. Hydrocarbon emissions characterization in the Colorado Front Range: A pilot study. J. Geophys. Res. 117 (D4):1–19. doi:https://doi.org/10.1029/2011jd016360.
- Pollmann, J., D. Helmig, J. Hueber, D. Tanner, and P. P. Tans. 2006. Evaluation of solid adsorbent materials for cryogen-free trapping - gas chromatographic analysis of atmospheric C2-C6 non-methane hydrocarbons. J. Chromatogr. A 1134 (1–2):1–15. doi:https://doi.org/10.1016/j.chroma.2006.08.050.
- Ramos, T. D., M. de La Guardia, A. Pastor, and F. A. Esteve-Turrillas. 2018. Assessment of air passive sampling uptakes for volatile organic compounds using VERAM devices. Sci. Total Environ. 619-620:1014–21. doi:https://doi.org/10.1016/j.scitotenv.2017.11.173.
- Rappenglueck, B., L. Ackermann, S. Alvarez, J. Golovko, M. Buhr, R. A. Field, J. Soltis, D. C. Montague, B. Hauze, S. Adamson, et al. 2014. Strong wintertime ozone events in the Upper Green River basin, Wyoming. Atmos. Chem. Phys. 14 (10):4909–34. doi:https://doi.org/10.5194/acp-14-4909-2014.
- Roche, A., R. Thevenet, V. Jacob, P. Kaluzny, C. Ferrari, P. Baussand, and P. Foster. 1999. Performance of a thermally desorbable type-tube diffusive sampler for very low air concentrations monitoring. Atmos. Environ. 33 (12):1905–12. doi:https://doi.org/10.1016/s1352-2310(98)00206-4.
- Roest, G., and G. Schade. 2017. Quantifying alkane emissions in the Eagle Ford Shale using boundary layer enhancement. Atmos. Chem. Phys. 17 (18):11163–76. doi:https://doi.org/10.5194/acp-17-11163-2017.
- Rossabi, S., J. Hueber, K. Smith, W. Wang, P. Millmoe, and D. Helmig. 2021. Spatial distribution of atmospheric oil and natural gas volatile organic compounds in the Northern Colorado Front Range. Elementa - Sci. Anthropocene 9. doi:https://doi.org/10.1525/elementa.2019.00036 .
- Sablan, O. M., G. W. Schade, and J. Holliman. 2020. Passively sampled ambient hydrocarbon abundances in a Texas oil patch. Atmosphere 11 (3):13. doi:https://doi.org/10.3390/atmos11030241.
- Scanion, J. T., and D. E. Willis. 1985. Calculation of the flame ionization detector relative response factors using the effective carbon number concept. J. Chromatogr. Sci. 23 (8):333–40. doi:https://doi.org/10.1093/chromsci/23.8.333.
- Seethapathy, S., T. Gorecki, and X. J. Li. 2008. Passive sampling in environmental analysis. J. Chromatogr. A 1184 (1–2):234–53. doi:https://doi.org/10.1016/j.chroma.2007.07.070.
- Sovacool, B. K. 2014. Cornucopia or curse? Reviewing the costs and benefits of shale gas hydraulic fracturing (fracking). Renewable Sustainable Energy Rev. 37:249–64. doi:https://doi.org/10.1016/j.rser.2014.04.068.
- Sturges, W. T., and J. W. Elkins. 1993. Use of adsorbents to collect selected halocarbons and hydrohalocarbons of environmental interest from large air volumes. J. Chromatogr. 642 (1–2):123–34. doi:https://doi.org/10.1016/0021-9673(93)80082-j.
- Tanner, M. 2020. Colorado oil and gas commission approves 2,000-foot setbacks for drilling and fracking. Oil Gas 360. Accessed April 30, 2021. https://www.oilandgas360.com/colorado-oil-and-gas-commission-approves-2000-foot-setbacks-for-drilling-and-fracking/.
- Thompson, C. R., J. Hueber, and D. Helmig. 2014. Influence of oil and gas emissions on ambient atmospheric non-methane hydrocarbons in residential areas of Northeastern Colorado. Elementa: Sci. Anthropocene 2:000035. doi:https://doi.org/10.12952/journal.elementa.000035.
- Tolnai, B., A. Gelencser, and J. Hlavay. 2001. Theoretical approach to non-constant uptake rates for tube-type diffusive samplers. Talanta 54 (4):703–13. doi:https://doi.org/10.1016/s0039-9140(01)00322-8.
- Tompkins, F. C., and R. L. Goldsmith. 1977. New personal dosimeter for monitoring of industrial pollutants. Am. Ind. Hyg. Assoc. J. 38 (8):371–77. doi:https://doi.org/10.1080/0002889778507636.
- Underhill, D. W., and C. E. Feigley. 1991. Boundary-layer effect in diffusive monitoring. Anal. Chem. 63 (10):1011–13. doi:https://doi.org/10.1021/ac00010a015.
- Urbina, I. (2011), Rush to Drill for Natural Gas Creates Conflicts With Mortgages, in New York Times, edited, http://www.nytimes.com/2011/10/20/us/rush-to-drill-for-gas-creates-mortgage-conflicts.html?mcubz=0.
- Verma, D. K., D. M. Johnson, and J. D. McLean. 2000. Benzene and total hydrocarbon exposures in the upstream petroleum oil and gas industry. Am. Ind. Hyg. Assoc. J. 61 (2):255–63. doi:https://doi.org/10.1080/15298660008984534.
- Verriele, M., N. Allam, L. Depelchin, L. Le Coq, and N. Locoge. 2015. Improvement in 8h-sampling rate assessment considering meteorological parameters variability for biogas VOC passive measurements in the surroundings of a French landfill. Talanta 144:294–302. doi:https://doi.org/10.1016/j.talanta.2015.05.083.
- Walgraeve, C., K. Demeestere, J. Dewulf, K. Van Huffel, and H. Van Langenhove. 2011a. Diffusive sampling of 25 volatile organic compounds in indoor air: Uptake rate determination and application in Flemish homes for the elderly. Atmos. Environ. 45 (32):5828–36. doi:https://doi.org/10.1016/j.atmosenv.2011.07.007.
- Wennborg, H., L. L. Magnusson, J. P. Bonde, and J. Olsen. 2005. Congenital malformations related to maternal exposure to specific agents in biomedical research laboratories. J. Occup. Environ. Med. 47 (1):11–19. doi:https://doi.org/10.1097/01.jom.0000150237.67801.93.
- Wood, G. O. 1987. A model for adsorption capacities of charcoal beds. 1. Relative humidity effects. Am. Ind. Hyg. Assoc. J. 48 (7):622–25. doi:https://doi.org/10.1202/0002-8894(1987)048<0622:amfaco><0622:amfaco>2.0.co;2.