
 ?Mathematical formulae have been encoded as MathML and are displayed in this HTML version using MathJax in order to improve their display. Uncheck the box to turn MathJax off. This feature requires Javascript. Click on a formula to zoom.
ABSTRACT
Ships have become an important source of SO2 emission in coastal areas with the rapid development of maritime transport. It is of great significance to develop a marine scrubber for reducing SO2 emission of ships. In this study, numerical simulation of a full-scale marine spray scrubber is conducted to investigate two-phase flow pattern and SO2 absorption process in the scrubber. A desulfurization model based on seawater absorbent is coupled into the simulation, which considers the mass transfer between phases and seawater aqueous phase chemistry simultaneously. A distribution ring is introduced in the scrubber to enhance the desulfurization performance of the scrubber. The result of simulation shows that the distribution ring can optimize effectively the distribution of gas–liquid phases and enhance the SO2 absorption. Under vertical condition, the desulfurization efficiency could be promoted approximate 6% after installing a distribution ring. The inclined condition resulting from the ship swinging could lead to the uneven distribution of droplets and an obvious decrease (8.7%) of desulfurization efficiency, whereas the desulfurization performance of the scrubber could be ensured with a distribution ring installed even under an inclined condition. Finally, a spray scrubber design scheme has been developed and successfully applied in the exhaust gas cleaning system (EGCS) of a container ship. Test result shows the outlet average value of SO2/CO2 can be reduced to 3.55. Meanwhile, the consistency of test data and calculation result indicates the applicability of the numerical model established for the simulation and optimization of the scrubber in industrial applications also.
Implications: EGCS is an effective method to reduce SO2 emission of marine industry. However, different from a land desulfurization tower, the application of a spray scrubber in EGCS faces more problems due to the different application scenarios and complex sea conditions (inclined condition resulting from ships swinging and so on) during sailing. In this work, a numerical model capable of investigating physical and chemical phenomena in the scrubber simultaneously is established, which can produce a great amount of data for the operation instruction of EGCS and the design and optimization of the marine spray scrubber. The distribution ring is introduced in the marine spray scrubber to intensify the SO2 absorption and enhance the desulfurization performance of the scrubber under different working conditions.
Introduction
Maritime transport plays an important role in international trade, and 90% of global foreign trade transportation depends on it (Beecken et al. Citation2015). In recent years, with the rapid development of maritime transport, the number of ships worldwide has also increased quickly. Although marine transport has made great contributions to economic development, it has gradually become one of the important sources of air pollutants in coastal areas. The third greenhouse gas research report of IMO pointed out that the average annual fuel consumption of world marine was 325 million tons, and the average annual emissions of NOx and SOx were 2088 and 1126 million tons, respectively, accounting for 15% and 13% of the total global anthropogenic emissions (Yang, Hu, and Zhou Citation2008). SO2 is a major air pollutant in the exhaust gas emitted by ships, which have caused harm to the living environment and health of residents in coastal areas (Zheng et al. Citation2019). IMO, the European Union, China, and the U.S. have successively formulated relevant restrictions to control emissions of pollutants from marine vessels, and the marine transport industry is facing a significant challenge in reducing emissions.
Generally, the approaches to control SO2 emission can mainly be divided into two types: (1) burning low-sulfur fuel; (2) exhaust gas cleaning system (EGCS). Burning low-sulfur fuel is a direct and effective way to reduce SO2 emissions from the source. But its price is higher than traditional heavy fuel oil due to additional desulfurization during the refining process which leads to an obvious increase for operating cost in the long-run, not to mention the cost of modification for combustion system when using low-sulfur fuel (Brynolf et al. Citation2014). EGCS as an exhaust gas after-treatment equipment, is viewed as another effective method for SO2 emission control recognized by IMO, which uses alkaline solutions or pure seawater as an absorbent to remove SO2 from the exhaust gas. This approach can achieve high SO2 removal efficiency. What is more, compared to burning low-sulfur fuel, EGCS has a better equipment adaptability, little impact on the performance of marine diesel engine and better economy from a long-term perspective. According to the type of absorbents used, EGCS can be divided into dry process and wet process. In the dry process, the alkaline solid absorbent is utilized to absorb SO2 from the exhaust gas and dry waste is produced. Dry scrubber has the benefits of easier waste disposal and lower capital costs, whereas lower desulfurization efficiency limits its applications compared to the wet scrubbers (Alejandro Citation2011; Srivastava, Jozewicz, and Singer Citation2001). At present, wet scrubber takes up most of the market of exhaust gas treating device. Wet EGCS can usually be divided into three types including open-loop, closed-loop and hybrid system. In open-loop system, the seawater is used to absorb SO2 from exhaust gas with its natural alkalinity and the waste scrubber solution is emitted into the sea after being treated and fulfilling the emission standards (Bandyopadhyay and Biswas Citation2007; Bian et al. Citation2012). The closed-loop system usually uses alkaline solutions such as sodium hydroxide and magnesium hydroxide solutions as a scrubbing solution to remove SO2 (Alejandro Citation2011; Reynolds, Caughlan, and Strong Citation2011). The scrubbing solution is recirculated by regular supplement of fresh water and alkaline absorbents. Meanwhile, the scrubbing waste is stored on board for subsequent disposal. A hybrid system includes closed-loop and open-loop two-operation models. According to the sailing area change of ships, the system can switch operation model, using the open-loop model when the ship is in the open sea and the closed-loop model when sailing in emission control areas (ECA) or the alkalinity of seawater decreases.
A scrubber is the key equipment of EGCS, mainly including a spray scrubber, packed bed and bubbling reactor. The packed bed can achieve large contact area and residence time when liquid flows over the packing inside the column. Some scholars have studied the performance of packed bed when it is applied in EGCS (Flagiello et al. Citation2018, Citation2019; Iliuta Citation2019). However, the packed bed has drawbacks such as the disintegration of packing material and clogging of the packing due to deposition (Iliuta Citation2019; Javed, Mahmud, and Purba Citation2006) in some specific situations. For the bubbling reactor, high interfacial areas can be achieved depending on the size of bubbles but a high cost resulting from large pressure drops can be produced which for marine application is a strong limit. In spray scrubbers, the absorbent liquid is dispersed into small droplets to counter-currently contact and mix with the exhaust gas entering the spray scrubber. The application of spray scrubber in marine desulfurization has also been reported in some studies and some structure design and optimizations have been proposed (Caiazzo et al. Citation2013; Flagiello et al. Citation2019; Han et al. Citation2018). With the advantages of simple structure and high operational stability, spray scrubbe has applied widely in wet fuel gas desulfurization technology for power plants (Zhong et al. Citation2008). It is predictable that spray scrubber has also a good application prospect in marine EGCS. Whereas different from land desulfurization spray tower, the application of spray scrubber in EGCS faces more problems due to the different application scenarios and complex sea conditions during sailing. On the one hand, limited space of ships results in a requirement for more compact spray scrubber compared to land desulfurization spray tower. On the other hand, it is noticeable that the ship could swing during sailing when wave intensity in the sea is excessive, which leads to spray scrubber incline and influences the performance of thespray scrubber. Therefore, it is significant to develop spray scrubber with high adaptability for marine vessels.
Numerical simulation is an effective method to study EGCS of marine industry, which produces great amount of data for the operation instruction of EGCS and the design and optimization of scrubber. (Selvakumar and Kim Citation2016) studies the flow and heat transfer characteristic inside the scrubber by computational fluid dynamics (CFD) to obtain optimum design of the scrubber. (Guo et al. Citation2020) found an uneven flow in the marine scrubber by numerical simulation and proposed to improve the contact of gas–liquid phases by adjusting the nozzles distribution and outermost nozzles angle. Some prediction models of desulfurization efficiency based on different absorbents have also been established to study the effect of operation parameters such as gas and liquid flow rate on the desulfurization efficiency (Zhong et al. Citation2008; Bešenić et al. Citation2020; Marocco Citation2010). Although some simulation studies have been made on the desulfurization tower, there is still a lack of full-scale simulation for EGCS of the marine industry. And a numerical model capable of investigating physical and chemical phenomena in the scrubber simultaneously is needed for the improvement and development of EGCS. In addition, how to ensure the desulfurization efficiency of EGCS under complex conditions (such as inclined condition due to ship swinging) remains an urgent problem to be solved.
In this paper, a full-scale spray scrubber for marine EGCS was built and the corresponding numerical model was proposed to fully investigate the fluid flow characteristic, distribution characteristics of droplet and the SO2 absorption process based on seawater absorbent in the spray scrubber. To ensure efficient desulfurization of the spray scrubber under complex conditions, the distribution ring is applied in the spray scrubber to enhance the SO2 absorption removal. The result of simulation is beneficial for the design and optimization of spray scrubber for marine, and could provide valuable guidance for ensuring the EGCS performance. Finally, based on the numerical simulation, a spray scrubber design scheme has been developed and applied successfully in the EGCS of a container ship with 18.8 MW marine engine. Meanwhile, the consistency of test data and calculation result further indicates the applicability of the numerical model established in this paper for the simulation and optimization of the scrubber in industrial applications.
Simulation method
Continuous phase governing equation
For multiphase flow in a spray scrubber, the ship exhaust gas is treated as continuous phase consisted of N2, CO2, SO2, O2 and vapor, which is described by the Eulerian method. The exhaust gas composition (concentration) measured in industrial test is shown in , . To simplify the numerical model, the droplet evaporation is ignored and the other species except SO2 are equivalent to one species; similar assumptions can be found in Chen et al. (Citation2017), Qin et al. (Citation2019), and Qu et al. (Citation2021).
Table 1. Composition of exhaust gas
Table 2. Summary of involved chemical reactions in seawater droplets
The governing equations for the continuous phase are shown as below:
Where is gas density,
is velocity vector of gas phase; t is time;
is static pressure; e is the internal energy per unit mass;
is stress tensor;
is gravitational body force;
is effective conductivity; T is the temperature of gas phase;
is mass fraction of
species in exhaust gas;
is diffusion rate of the species k.
The source is the mass source term resulting from the mass transfer between continuous phase and discrete phase.
is the momentum source term due to the drag force between phases;
is the heat transfer between phases, consisting of convective and evaporative heat transfer, while the heat transfer caused by radiation has been neglected for the investigated temperature range is low.
Discrete phase governing equations
The injection droplets in the spray scrubber are viewed as discrete phase which was modeled in a Lagrangian framework and the droplet trajectories are calculated by tracking a large number of particles called parcels and integrating the force balance through the computational domain. The force balance equation on droplet is shown as below:
Where is mass of droplet,
is density of droplet,
is velocity of droplet;
is the momentum source term for droplet. Because
is much larger than
(
), generally
refers to the gravity force of droplet.
The mass and energy conservation equation of droplet are:
Where is the specific heat of droplet and
is temperature of droplet;
and
are mass and energy source term of droplet respectively.
Source term
Mass source term
As is mentioned above, mass source term results from the mass transfer between continuous phase and discrete phase which mainly includes droplet evaporation and SO2 absorption in the spray tower. In this study droplet evaporation is ignored because the exhaust gas entering the main scrubbing tower close to saturation after venturi pre-scrubber (a large portion of seawater would evaporate rapidly due to high velocity and stronger turbulence in venturi), which is proved in some articles (Kuang et al. Citation2020; Wu et al. Citation2021). Therefore, only SO2 absorption is considered in the mass transfer, and then the mass source term could be written as:
where is the SO2 mass absorption rate, the calculation method of which will be described in detail in Seawater desulfurization model.
Momentum source term
Momentum is exchanged between phases due to mass transfer and interphase forces. In the gas–liquid flows, the drag force significantly influences the droplet trajectory. So the droplet momentum source is written as:
where is velocity of droplet and
is drag force, which can be expressed as below:
Where is dynamic viscosity; is droplet diameter;
is Reynolds number of droplet;
is drag coefficient. In this study, the droplet is viewed as spherical particle and the drag coefficient
can be calculated by the following empirical formula:
where ,
and
are constants applied for several ranges of Reynolds number given by Morsi and Alexander (Citation1972).
Energy source term
Due to the assumption of ignoring droplet evaporation and radiative heat transfer, energy exchange between gas–liquid two phases only contains convective heat transfer. The energy source can be expressed as:
Where is the surface area of droplet, h is the convective heat transfer coefficient, which can be calculated by the Ranz–Marshall correlation (Ranz and Marshall Citation1952):
Where is Nusselt number; Pr is Prandtl number.
Seawater desulfurization model
Generally, the entire desulfurization process in the desulfurization tower mainly includes five steps (Marocco Citation2010): absorption, neutralization, regeneration, oxidation and precipitation. Because seawater is used as an absorbent in this study, only absorption and neutralization are considered, which occur in the spray scrubber simultaneously.
SO2 absorption
SO2 absorption involves mass transfer between phases and chemical reactions. First, SO2(g) is dissolved in the seawater forming SO2(aq) by physical dissolution which is governed by Henry’s law. After that, SO2(aq) undergoes the dissociation reactions, forming the bisulfite and sulfite ions. These equilibrium reactions influence significantly the SO2 mass transfer, which can be written as below:
According to two-film theory (Whitman Citation1962), there are gas and liquid films at the gas–liquid interface. It assumes that the concentration change occurs in them, from the bulk values in the phases to the concentration on the interface, therefore existing mass transfer resistances both in the gas side and the liquid side. The global resistance of mass transfer can be obtained by adding up individual resistances respectively in the gas side and the liquid side.
Where is the mass-transfer enhancement factor resulting from chemical reactions, which is a function of inlet sulfur dioxide concentration, pH of absorbent liquid and gas—liquid ratio by concluding references (Gerbec, Stergarsek, and Kocjančič Citation1995; Marocco and Inzoli Citation2009; Zhu et al. Citation2015). The enhancement factor is calculated and upgraded at every droplet position by the empirical formula obtained from Zhu et al. (Citation2015).
is the global SO2 mass transfer coefficient;
is the gas-side mass transfer coefficient which can be calculated by the modified Ranz–Marshall equation (Keey et al. Citation1965) with the Sherwood number for mass transfer:
Here, is the diffusion coefficient of SO2 in air, the calculation of which has been shown in Zhong et al. (Citation2008); Sh is Sherwood number; Sc is Schmidt number.
The liquid-side mass transfer coefficient is estimated by the equation in Gomez, Fueyo, and Tomas (Citation2007):
Where . Here
is the surface tension of liquid phase,
is the diffusion coefficient of SO2 in liquid phase which can be obtained in Norman (Citation2002).
is temperature dependant, which can be calculated by the equation below (Mondal Citation2007):
The difference between the partial pressure
in the gas bulk and the partial pressure
corresponding to
concentration in liquid phase is the driving force for SO2 mass transfer. Therefore, the molar mass transfer of SO2 –
can be expressed by the equation:
And the mass source term for droplet can be expressed as below:
Where is the molecular weight of SO2. As is shown in EquationEquation
(2-2)
(2-2) Equation19
(2-19)
(2-19) , the partial pressure
in the gas bulk can be obtained from the solution of the corresponding gas phase species transport equation, whereas the further study on the complex aqueous phase chemistry system in seawater is needed to determine the dissolved sulfur dioxide
concentration in the liquid bulk –
.
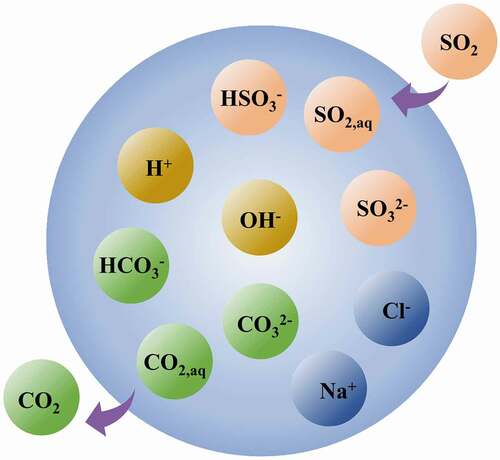
Seawater aqueous phase chemistry
During the seawater desulfurization process in the spray scrubber, a complex series of chemical reactions controlled by kinetic and equilibrium occur in the seawater droplets simultaneously. Seawater aqueous reaction system is shown in . In addition to the chemical reactions involved in SO2 absorption mentioned in EquationEquation(2-2)
(2-2) Equation14
(2-14)
(2-14) , the neutralization also occurs in droplets which can be written as:
Figure 1. Seawater aqueous reaction system.
As is shown in EquationEquation(2-2)
(2-2) Equation21
(2-21)
(2-21) , the hydronium ion is consumed by the neutralization reactions with bicarbonates and carbonates ions, which promotes the SO2 absorption and the absorption capacity of seawater. Generally, the bicarbonates and carbonates ions in seawater represent the alkalinity of seawater (Marocco and Inzoli Citation2009), which is the property of seawater that can neutralize strong acids.
In terms of a seawater droplet, the absorption and neutralization reactions can be assumed to be at equilibrium in the computational domain (Bešenić et al. Citation2020; Brogren and Karlsson Citation1997; Marocco and Inzoli Citation2009). And the main dissolved species in seawater taken account in this study includes: SO2(aq), CO2(aq), H+, ,
,
,
,
,
,
. To reduce the complexity of the chemical system in a droplet, the compound species compromising SO2(aq),
,
are viewed as a single species and CO2(aq),
,
are also combined as a single species.
The respective molar concentration of SO2(aq), and
(CO2(aq),
, and
)in seawater depend on the pH (
), which can be determined by the relations below (Harris Citation1999):
According to EquationEquation(2-2)
(2-2) Equation23
(2-23)
(2-23) , with
and pH of seawater, the
can be calculated and then the SO2 molar flux
for every droplet can also be obtained by EquationEquation
(2-2)
(2-2) Equation19
(2-19)
(2-19) in every time step. The initial
(=0),
and pH should be input before starting up the calculation. Due to neglecting the desorption of CO2 into the gas phase (Marocco Citation2010; Marocco and Inzoli Citation2009),
in a falling droplet is supposed to remain unchanged. The computational procedures can be mainly divided into several steps as below:
Step 1: Solve the Eulerian–Lagrangian two-phase flow model at the current time step with known source term from the previous time step.
Step 2: With and
obtained from previous time step, calculate pH of a seawater droplet at current time step according to electroneutrality in aqueous system:
In EquationEquation(2-2)
(2-2) Equation25
(2-25)
(2-25) ,
,
,
and
can be written as expressions with only one unknown variable
as shown in EquationEquation
(2-2)
(2-2) Equation23
(2-23)
(2-23) ,Equation24
(2-24)
(2-24) . Meanwhile,
can also be written as
and the initial value of
and
are input as constant. Therefore, EquationEquation
(2-2)
(2-2) Equation25
(2-25)
(2-25) is converted into an equation with one unknown variable
. By solving the equation, the pH of seawater at current time step can be obtained.
Step 3: With and pH obtained in Step 2,
can be calculated by EquationEquation
(2-2)
(2-2) Equation23
(2-23)
(2-23) , and then the SO2 molar flux is determined combined with
obtained from the pressure field at current time step (EquationEquation
(2-2)
(2-2) Equation19
(2-19)
(2-19) ).
Step 4: According to EquationEquation(2-2)
(2-2) Equation20
(2-20)
(2-20) ,
can be calculated and then update
for the calculation of the next time step.
Step 5: Enter the next time step and repeat from Step 1 to Step 4 till a steady-state solution. The entire calculation strategy is illustrated in .
Figure 2. The strategy of calculation.
Computational domain and boundary conditions
A full-scale marine spray scrubber for a container ship is established and simulated. The geometry structure and computational domain of the spray scrubber are shown in . A venturi pre-scrubber is installed before the exhaust gas enters the main scrubbing tower, where the exhaust gas is cooled and humidified. In the main scrubbing tower, four spray layers at different heights to arrange the nozzles and three distribution rings are installed between the different spray layers to improve the gas–liquid contact and enhance SO2 absorption. The open spray scrubber () has also been established as comparison to investigate the effect of distribution ring. Due to sulfur content of fuel oil is 3.1%, the inlet SO2 concentration is set as 600 ppm.
Figure 3. Geometry structure of spray scrubber and computational domain.
The spray scrubber configuration and main operation conditions are illustrated in . It is worth mentioning that the spray scrubber for marine use has a comparatively small diameter, due to limited space in ships, of only 3.6 m. Because the simulation of pre-scrubber process is not conducted in this study, inlet temperature of exhaust gas is directly set as 333.15 K according to actual engineering data. The nozzles in computational domain are treated as solid-cone injection points without being geometrically modeled due to the negligible impact of them on the hydrodynamics in the spray scrubber (Chen et al. Citation2017; Marocco and Inzoli Citation2009). The droplets hitting the inner surface of tower are viewed as trapped and when droplets hit the distribution rings, reflect is used to describe the effect of distribution ring on the droplet trajectories.
Figure 4. The main operation conditions of simulated scrubber.
Results and discussion
Model validation
Test results are used to verify the numerical model. The test was conducted in EGCS of a container ship with 18.8 MW marine engine, which would be described in Industrial applications. During the test the sulfur content of used fuel is 3.1% which is approximately equivalent to 600 ppm SO2 content in inlet exhaust gas, close to the setting value of numerical simulation. The SO2 and CO2 volume fraction of outlet exhaust gas are monitored by exhaust gas emission monitoring system in this ship. And the test data were obtained from the distributed control system of this ship. Three typical operation conditions under different engine loads were selected from the historical operating data to validate this numerical stimulation (The scrubber is under the vertical condition with DR). As illustrated in , under different operation conditions, calculated removal efficiency is very close to tested efficiency by comparison. And the relative errors for removal efficiency is less than 2%. This result indicates the applicability of the numerical model established in this paper for the simulation and optimization of the scrubber in industrial applications.
Table 3. Comparation between simulation calculation and test results
Single phase flow filed
compares the continuous phase flow filed in the open spray scrubber (left) and spray scrubber with distribution rings (right). For the open spray scrubber, an obvious uneven flow appears with a high velocity gas stream (up to 20 m/s) near the wall opposite to the gas entrance, whereas the gas velocity in the side wall near entrance is at a comparatively low level. The main reason is that the gas stream rushes to the opposite side wall and quickly flows up along the wall due to inertial effect, without enough time to spread when the diameter of the spray scrubber is small.
Figure 5. Comparison of continuous flow field in different scrubbers (flow rate of gas = 128,290 m3/h, flow rate of liquid = 0).
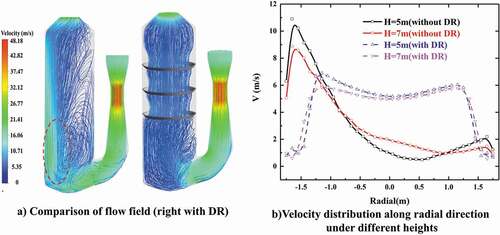
The uneven flow causes deterioration of the contact and mixing state between gas–liquid phases and influences the desulfurization performance of scrubber due to the low absorbent density in the near wall area. But the introduction of the distribution ring can make a rectification effect on the uneven flow by making the gas stream converge toward the center of scrubber while flowing through the distribution ring and thus a high velocity gas stream near wall area can be avoided. As shown in , the uniformity of radial velocity distribution in scrubber has been improved significantly after installing the distribution ring. In the central zone of scrubber with distribution ring, the velocity magnitude is approximately within 5–7 m/s. For the marine spray scrubber, the limited layout space in ships inevitably gives rise to the limited size of scrubber diameter, which could lead to the aggravation of uneven flow. Therefore, it is meaningful to introduce the distribution ring in the marine spray scrubber.
Gas–liquid phases coupled flow pattern
In the spray scrubber, the droplets counter-currently contact and mix with the exhaust gas during falling, momentum and mass transfer between gas–liquid phases happening at the same time. Therefore, the distribution of droplets and gas phase in the scrubber both have a significant impact on the desulfurization performance of scrubber. For the sprayer system of scrubber, some nozzles are arranged near the wall areas of scrubber, leading to a part of the droplets hitting the wall before fully absorbing SO2. The number of droplets hitting the inner walls of scrubber would be enlarged in a spray scrubber, especially with a small diameter.
The distribution rings can have a redistribution effect on the droplets hitting the wall, making them return to the central area of the scrubber and achieving the redistribution of droplets. shows the distribution of droplet concentration in different spray scubbers. In addition, because the ship could swing during sailing when wave intensity in the sea is excessive, the vertical condition and inclined condition for the marine scrubber are taken into account simultaneously. In , several significantly high concentration zones of droplets can be found below every distribution ring resulting from the backflows of droplets hitting the wall (). As is mentioned above, the distribution ring can also make the gas stream converge toward the center of the scrubber, thereby a strong mixing zone of gas–liquid phases can be formed in the center of scrubber with distribution rings, by which the SO2 absorption can be enhanced greatly.
Figure 6. Droplet concentration distribution in Z section (flow rate of gas = 128,290 m3/h, flow rate of liquid = 1580 m3/h).
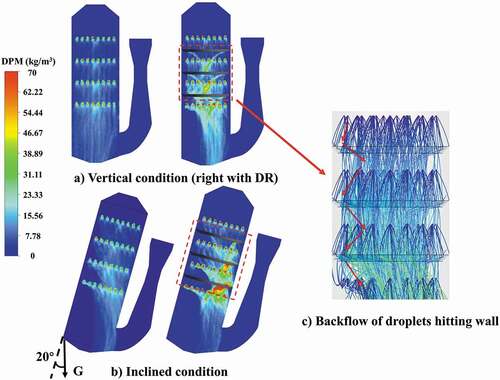
Comparing the vertical and inclined conditions (), an obvious uneven distribution of droplets can be found in the inclined condition and a low droplet concentration zone is formed in one side of spray scrubber where the exhaust gas cannot contact sufficiently with absorbent. For the inclined condition, the redistribution effect of distribution rings would be more significant because the number of droplets hitting the wall could be enlarged at this time. Conversely, the exhaust gas is converged into the central zone of the scrubber by distribution rings, thereby making the gas stream avoid the low droplet concentration zone.
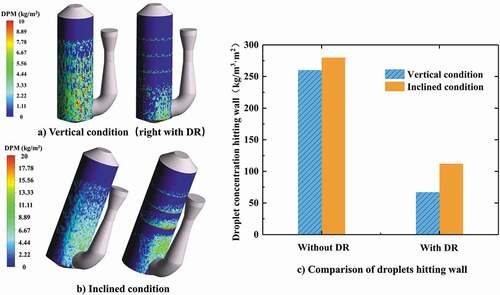
The distribution contours of droplets hitting the wall under different conditions are shown in . Higher droplet concentration on the wall appears in the lower part of the scrubber as droplets fall. It can be found that the concentration of droplets hitting the wall in the open spray scrubber is significantly more than the spray scrubber with distribution rings. For the inclined condition (), a larger number of droplets would hit the wall in the inclined side of scrubber. quantitatively shows the droplet concentration hitting the wall which is obtained by using surface integral for the inner surface of scrubber. Comparing the droplet concentration hitting the wall under vertical and inclined conditions in the open spray scrubber, the increase is not obvious. The main reason is that although more droplets hit the wall in the inclined side of scrubber, the droplets hitting another side of the scrubber also decrease at the same time. However, regardless of vertical or inclined conditions, the distribution rings could make the droplet concentration hitting the wall decrease significantly by the redistribution effect.
Figure 7. Concentration of droplets hitting wall under different conditions (flow rate of gas = 128,290 m3/h, flow rate of liquid = 1580 m3/h).
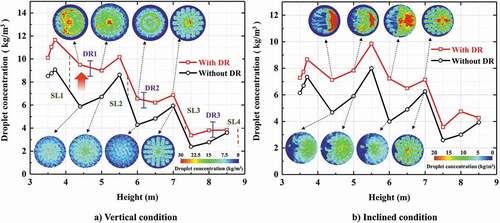
shows the droplet concentration variation in different heights of scrubber under different conditions. In the general trend, the droplet concentration rises sharply after each spray layer, and has a small decrease before the next spray layer due to some droplets hitting the wall during falling. Comparing the concentration variation in open spray scrubber and the spray scrubber with the distribution ring, an obvious increase of droplet concentration can be found, which proves the redistribution effect of the distribution ring mentioned above. For the inclined condition (), the droplet concentration in different heights decreases compared to vertical condition due to a larger number of droplets hitting the wall. However, in the spray scrubber with distribution rings the droplet concentration in different heights still maintains a similar level to the vertical condition, which is positive to assure the desulfurization performance of the scrubber in inclined conditions.
Figure 8. Droplet concentration variation in different heights (flow rate of gas = 128,290 m3/h, flow rate of liquid = 1580 m3/h).
During droplet falling, the inter-phase momentum exchange can improve the uniformity of the gas phase flow field. The inter-phase drag force is proportional with the magnitude of slip velocity between two phases, as a result of which the velocity difference in the scrubber can be reduced. But for the open spray scrubber, the droplet concentration near the wall zone is usually lower than in the central zone and the corresponding inter-phase momentum transfer near the wall zone is also feebler. As shown in , the velocity magnitude of gas phase near the wall area is still obviously higher than in the central zone of the scrubber. For the scrubber with the distribution ring, the momentum exchange in central zone can be intensified with the rectification and redistribution effect originating from the distribution ring, and thus the uniformity of the gas phase flow field can be improved greatly.
Figure 9. Effect of distribution ring on gas flow field (flow rate of gas = 128,290 m3/h, flow rate of liquid = 1580 m3/h).
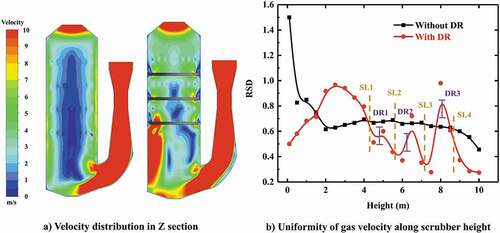
Here, relative standard derivation (RSD) can be used to evaluate the uniformity of the gas phase flow over the cross section under different heights (), which is defined as:
As can be seen in , the RSD near the entrance zone is much higher than the main spray zone resulting from the influence of inlet flow. With the increase of height into the main spray zone, the RSD begin decreasing quickly due to the inter-phase interaction, indicating the modification of gas flow uniformity is dominated by droplets in this zone. To study the effect of the distribution ring further, after introducing the distribution ring, the RSD has a sudden but short rise in trend near the distribution ring because of the transient disturbance, and then decreases rapidly to the lower value in the main spray zone compared to the open scrubber. The above results depict that introduction of the distribution ring indeed improves the uniformity of gas flow.
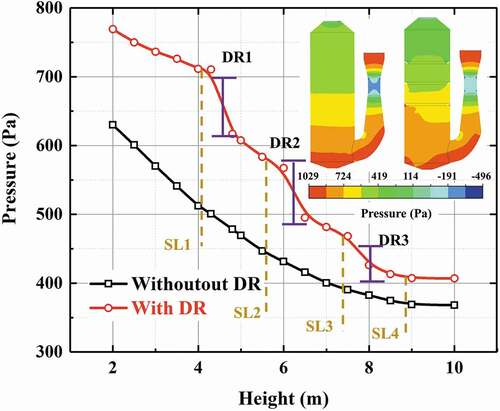
The scrubber pressure drop significantly affects the operational costs of EGCS. The distribution ring could optimize the distribution of gas–liquid phases while increasing the pressure drop of the scrubber at the same time. Therefore, it is necessary to investigate the pressure drop due to the distribution ring. As is shown in , on the whole the pressure would decrease as the height increases due to the interaction of gas phase and droplets. Comparing the scrubber with the distribution ring and open spray scrubber, it can be found that three obvious pressure drops appear at the location of the distribution ring as a result of the local loss when gas stream flows through the distribution rings. An additional pressure drop is produced due to the installation of the distribution ring which is approximately 100 Pa. By taking account the additional pressure drops and the improvement originating from the distribution ring simultaneously, it is profitable to introduce the distribution ring in the scrubber.
Figure 10. Pressure variation as height variation (flow rate of gas = 128,290 m3/h, flow rate of liquid = 1580 m3/h).
SO2 absorption process
shows the SO2 absorption rate variation of droplets from the top spray layer as droplets fall. Droplets 1,2,3 are from different sprayers at the same height. During droplets falling, it can be found that two obvious peaks of SO2 absorption rate appears at different heights as droplets fall. After droplets fall below the peak 1, the SO2 absorption rate decreases gradually. The main reason is that the pH value of the seawater droplet in the lower part of the scrubber is within a lower range (as shown in ). As we know the enhancement factor E reflects the reinforcement of absorption due to chemical reactions, which is a positive relation function of pH (Charlotte and Karlsson Citation1997; Harris Citation1999; Zhu et al. Citation2015). In the lower part of the scrubber, low pH value would lead to the decrease of E and make the sulfur components in the droplet exist mainly in the form of SO2(aq) which decreases the drive force of SO2 mass transfer. Meanwhile, the absorption capacity of droplets for SO2 moves close to saturation gradually. All these contribute to the decrease of SO2 absorption rate.
Figure 11. SO2 absorption rate variation (flow rate of gas = 128,290 m3/h, flow rate of liquid = 1580 m3/h, inlet SO2 concentration = 600 ppm, with DR).
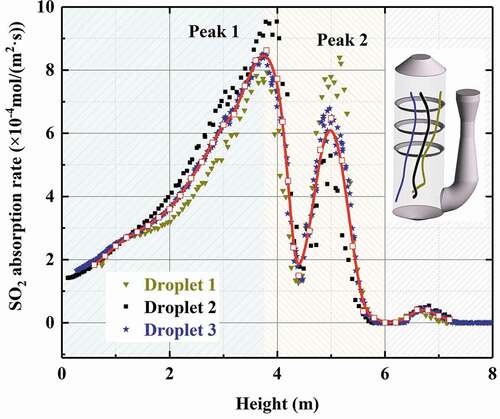
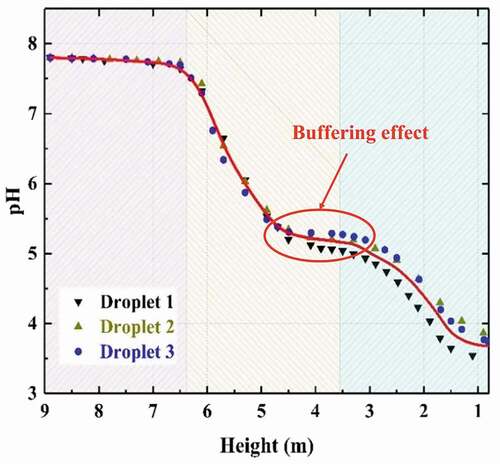
Figure 12. pH variation as droplet falling (flow rate of gas = 128,290 m3/h, flow rate of liquid = 1580 m3/h, inlet SO2 concentration = 600 ppm, with DR).
Above the peak 1, the drive force reduces for the SO2 in gas bulk is absorbed quickly as the height increases, which results in the SO2 absorption rate beginning to decrease gradually. However, another peak of SO2 absorption rate appears at the height of about 5 m. At this zone, the seawater droplets have a comparatively high pH value, and the SO2 absorption process is controlled by the gas film side and liquid film side mass transfer resistance simultaneously. When the gas stream flows through the distribution ring, the velocity of gas stream increases with the decrease of flow area and turbulence disturbance is formed in this zone, enhancing the mass transfer from gas phase to liquid phase and leading to the peak 2 of SO2 absorption rate. With the height above 7 m, the SO2 absorption rate stays at a very low level due to a tiny drive force for SO2 mass transfer in the upper zone of the scrubber. It is because the SO2 has been almost completely absorbed when the gas stream reaches the top of the scrubber.
The pH variation of seawater droplets from the top spray layer as the height decreases is shown in . It can be found that there is no significant decrease on the pH value of droplets in the top of the scrubber which is consistent with the very low SO2 absorption rate in this zone as mentioned above. When droplets enter the high SO2 absorption rate zone, the pH value of droplets begins to decline gradually because OH– ions are consumed as the SO2 absorption and aqueous neutralization proceeds. However, the presence of carbonates and bicarbonates could give a buffering effect for the consuming of OH– ions, which could correspond to the areas in which the pH lowers slowly. Instead, when pH rapidly decreases again it means that the OH– ions no longer have coverage and are consumed by the H+. Eventually, pH value of seawater is at about 3.7 when the droplets reach the bottom of the scrubber.
Desulfurization efficiency
shows the SO2 concentration distribution in the different scrubbers under vertical and inclined conditions. And the total desulfurization efficiency of the scrubber under different conditions are listed in . For the vertical condition (), in the open spray scrubber the SO2 concentration distribution is influenced greatly by the continuous phase flow field. It can be found that an obvious high SO2 concentration appears at the near wall zone opposite the gas entrance due to the uneven flow. The main reasons are the high velocity of gas stream would make the contact time of gas–liquid phases decrease and meanwhile the absorbent density near the wall zone is low. The inefficient contact of gas–liquid phases could lead to the decline of total desulfurization efficiency. However, for the spray scrubber with distribution ring a significantly lower SO2 concentration can be observed in the distribution ring zone compared to the open sprayscrubber because a strong mixing zone of gas–liquid phases can be formed in the center of the scrubber with distribution rings. As is illustrated in SO2 absorption process, the SO2 absorption rate of droplets in this zone gets enhanced greatly, thereby SO2 concentration decreases quickly here. From , it can also be observed that a higher declining rate of SO2 concentration as height increases appears in the distribution ring zone compared to the open spray scrubber. The total desulfurization efficiency increases about 6% compared to the open spray scrubber.
Figure 13. SO2 concentration distribution (flow rate of gas = 128,290 m3/h, flow rate of liquid = 1580 m3/h, inlet SO2 concentration = 600 ppm).
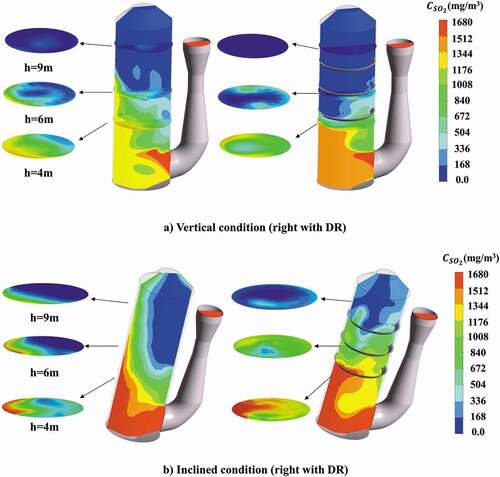
Figure 14. SO2 concentration variation as height (vertical condition) (flow rate of gas = 128,290 m3/h, flow rate of liquid = 1580 m3/h, inlet SO2 concentration = 600 ppm).
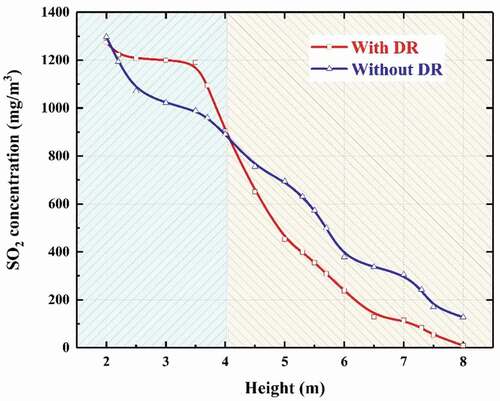
Table 4. The total desulfurization efficiency of scrubber under different conditions
Under the inclined condition (), the uniformity of SO2 concentration distribution gets significantly worse in the open spray scrubber with very high SO2 concentration in one side of scrubber. It is because more droplets are distributed in the inclined side while a very low droplet concentration appears in the opposite side of scrubber, where gas phase cannot efficiently contact with droplets. The total desulfurization efficiency of open spray scrubber in inclined condition decreases 8.7% compared to the vertical condition. Comparing the open spray scrubber and the spray scrubber with distribution ring under inclined condition, we can find the uniformity of SO2 concentration distribution is greatly improved with the distribution ring. As mentioned above, due to the rectification and redistribution effect of the distribution ring, the gas phase can contact intimately with the liquid phase in the central zone of scrubber. Therefore, the spray scrubber with distribution ring could still keep good desulfurization performance with 92.8% total desulfurization efficiency compared to the open spray scrubber even under the inclined condition.
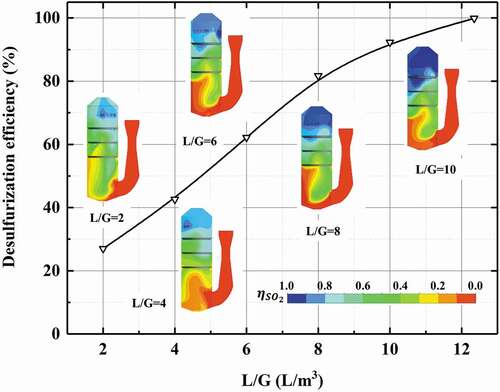
L/G is an important influence factor on the desulfurization efficiency of scrubber. As is shown in , with the increase of L/G, the desulfurization efficiency of scrubber increases significantly. When L/G exceeds 10, the desulfurization efficiency can keep 90% above. What is more, the desulfurization efficiency can reach 99.2% with L/G = 12.3. In other words, to ensure the desulfurization performance of scrubber, L/G is required to stay at around 12 with 3.1% sulfur content of fuel.
Figure 15. Effect of liquid–gas rate on desulfurization efficiency (flow rate of gas = 128,290 m3/h, inlet SO2 concentration = 600 ppm).
Another parameter with a very significant influence on desulfurization efficiency is the droplet diameter. Five different diameters (1 mm, 1.5 mm, 2 mm, 2.5 mm, 3 mm) are selected to conduct this study under the condition of L/G about 12.3. As illustrated in , , the desulfurization efficiency decreases as the increase of droplet diameter because larger diameter leads to smaller mass transfer area. When the droplets diameter decreases into 1 mm, the SO2 can almost be removed completely.
Figure 16. Effect of droplet diameter on desulfurization efficiency (flow rate of gas = 128,290 m3/h, inlet SO2 concentration = 600 ppm, L/G = 12.3).
Figure 17. Application of spray scrubber with distribution rings in a container ship.
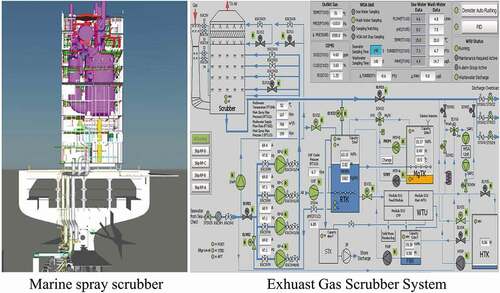
Figure 18. SO2/CO2 of exhaust gas after scrubbing (sulfur content of fuel oil = 3.1%).
Industrial applications
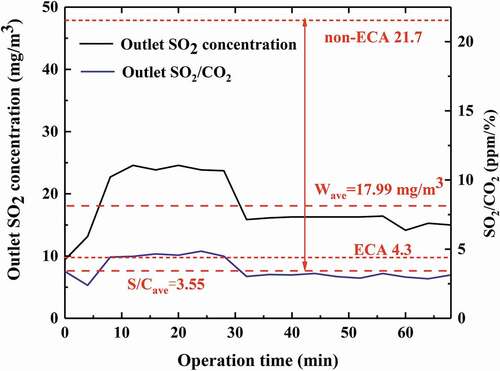
Based on the numerical simulation research above, a spray scrubber design scheme has been developed and applied in the EGCS of a container ship with 18.8 MW marine engine as shown in . The geometry structure and main design operation parameters of the spray scrubber has been illustrated in the Computational domain and boundary conditions section. The scrubber comprises four spray layers and three distribution rings as shown in . A venturi pre-scrubber is installed before the main tower to cool and humidify the exhaust gas. The SO2 and CO2 volume fraction of exhaust gas after scrubbing was recorded by the continuous emission monitoring system, and the outlet SO2 concentration and SO2/CO2 (ppm/%) is shown in . The SO2/CO2 in marine exhaust gas is always corresponding to the sulfur content of fuel oil, thereby the SO2/CO2 of exhaust gas is usually used to evaluate the SO2 emission of marine exhaust gas. As can be seen in , the outlet average SO2 concentration was 17.99 mg/m3 during test. The outlet SO2/CO2 can be kept below 5 in a period of time and the average value of SO2/CO2 is 3.55 which is below the emission limits (4.3 in ECA and 21.7 in non-ECA). Therefore, with the spray scrubber installed in the ship, the SO2 emission of ship could be controlled effectively under the emission limits when utilizing the traditional heavy fuel oil.
Conclusion
In this paper, a numerical simulation of a full-scale marine spray scrubber is conducted to investigate two-phase flow pattern and SO2 absorption process in the scrubber. The two-phase flow is described by the Euler–Lagrange approach. A desulfurization model based on seawater absorbent is coupled into the simulation, which considers the mass transfer between phases and seawater aqueous phase chemistry simultaneously. By the numerical simulation, the main results of investigations are as follows.
An obvious uneven flow is observed in the marine spray scrubber with small diameter, which can be improved significantly after installing the distribution ring. Meanwhile the distribution ring has a redistribution effect on the droplets – decreasing the number of droplets hitting the inner wall of scrubber and increasing the active liquid density in the central zone of scrubber. A strong mixing zone of gas–liquid phases can be formed in the center of scrubber with distribution rings, where the SO2 absorption process could be enhanced greatly and the desulfurization efficiency is improved approximately 6%. The additional pressure drop brought about by the distribution ring is acceptable for its industrial application.
Inclined condition resulting from the ship swinging leads to the uneven distribution of droplets with a very low droplet density in one side of the scrubber and an obvious decrease of desulfurization efficiency (8.7%). The distribution ring could optimize the distribution of gas and liquid phases and ensure the desulfurization performance of the scrubber under inclined conditions.
The spray scrubber with distribution ring has been successfully applied in EGCS of a container ship. The outlet average value of SO2/CO2 (ppm/%) can be reduced to 3.55 which is far below the emission limits. With the spray scrubber installed in the ship, the SO2 emission could be controlled effectively under the emission limits when utilizing the traditional heavy fuel oil.
The numerical model is verified by comparing the test result and calculation result. Test results agree well with the calculation result, which further indicates the applicability of the numerical model established in this paper for the simulation and optimization of the scrubber in industrial applications.
Nomenclature
| = | surface area of droplet, m2 | |
| Cd | = | drag coefficient |
| Cp | = | specific heat of droplet, kJ/(kg·K) |
| Ci | = | concentration of i, mol/m3 |
| = | concentration of SO2 in liquid phase, mol/m3 | |
| = | carbon species in liquid phase | |
| = | diameter of droplet, m | |
| = | diffusion coefficient of SO2 in air, m2/s | |
| = | diffusion coefficient of SO2 in liquid phase, m2/s | |
| e | = | internal energy per unit mass, kJ/kg |
| = | mass-transfer enhancement factor | |
| = | drag force between phases, N | |
| g | = | gravitational acceleration, m/s2 |
| = | convective heat transfer coefficient, W/(m2·K) | |
| = | Henry coefficient of SO2, Pa··m3/mol | |
| = | gas-side mass transfer coefficient, mol/(m2·s·Pa) | |
| = | liquid-side mass transfer coefficient, m/s | |
| = | equilibrium constant of chemical reactions | |
| = | global SO2 mass transfer coefficient, mol/(m2·s·Pa) | |
| = | mass of droplet, kg | |
| = | molecular weight of SO2, g/mol | |
| = | molar mass transfer of SO2 between phases, mol/(m2·s) | |
| = | Nusselt number | |
| = | partial pressure of | |
| = | Prandtl number | |
| R | = | universal gas constant, J/(mol |
| = | Reynolds number of droplet | |
| = | mass source term for droplet | |
| = | momentum source term for droplet | |
| = | energy source term for droplet | |
| = | Sherwood number | |
| = | Schmidt number | |
| = | sulfur species in liquid phase | |
| = | temperature of gas phase, K | |
| = | temperature of droplet, K | |
| = | velocity of gas phase, m/s | |
| = | velocity of droplet, m/s | |
| = | mass fraction of | |
| = | density of gas, kg/m3 | |
| = | density of droplet, kg/m3 | |
| = | dynamic viscosity, Pa·s | |
| = | the surface tension of liquid phase, N/m | |
| = | thermal conductivity, W/(m·K) | |
| = | shear stress, kg/(m·s2) |
Abbreviation
| EGCS | = | exhaust gas cleaning system |
| DR | = | distribution ring |
| SL | = | sprayer layer |
Disclosure statement
No potential conflict of interest was reported by the authors.
Additional information
Funding
Notes on contributors
Wenjun Li
Wenjun Li is affiliated with State Key Laboratory of Clean Energy Utilization, State Environmental Protection Engineering Center for Coal-Fired Air Pollution Control, Zhejiang University, Hangzhou, People’s Republic of China.
Yongxin Zhang
Yongxin Zhang is affiliated with State Key Laboratory of Clean Energy Utilization, State Environmental Protection Engineering Center for Coal-Fired Air Pollution Control, Zhejiang University, Hangzhou, People’s Republic of China.
Zhongyang Zhao
Zhongyang Zhao is affiliated with State Key Laboratory of Clean Energy Utilization, State Environmental Protection Engineering Center for Coal-Fired Air Pollution Control, Zhejiang University, Hangzhou, People’s Republic of China.
Chang Liu
Chang Liu is affiliated with State Key Laboratory of Clean Energy Utilization, State Environmental Protection Engineering Center for Coal-Fired Air Pollution Control, Zhejiang University, Hangzhou, People’s Republic of China.
Yifan Wang
Yifan Wang is affiliated with State Key Laboratory of Clean Energy Utilization, State Environmental Protection Engineering Center for Coal-Fired Air Pollution Control, Zhejiang University, Hangzhou, People’s Republic of China.
Mingqiang Shen
Mingqiang Shen is affiliated with Zhejiang Energy Marine Environmental Technology Co., Ltd, Hangzhou, People’s Republic of China.Republic of China.
Haobo Dai
Haobo Dai is affiliated with Zhejiang Tiandi Environmental Protection Engineering Co., Ltd, Hangzhou, People’s Republic of China
Yang Yang
Yang Yang is affiliated with State Key Laboratory of Clean Energy Utilization, State Environmental Protection Engineering Center for Coal-Fired Air Pollution Control, Zhejiang University, Hangzhou, People’s Republic of China.
Chenghang Zheng
Chenghang Zheng is affiliated with State Key Laboratory of Clean Energy Utilization, State Environmental Protection Engineering Center for Coal-Fired Air Pollution Control, Zhejiang University, Hangzhou, People’s Republic of China.
Xiang Gao
Xiang Gao is affiliated with State Key Laboratory of Clean Energy Utilization, State Environmental Protection Engineering Center for Coal-Fired Air Pollution Control, Zhejiang University, Hangzhou, People’s Republic of China.
References
- Alejandro, H. M. 2011. Study of exhaust gas cleaning systems for vessels to fulfill IMO III in 2016. Kiel, Germany: Fachhochschule Kiel Univ. of Applied Sciences.
- Bandyopadhyay, A., and M. N. Biswas. 2007. Modeling of SO2 scrubbing in spray towers. Sci. Total Environ. 383 (1–3):25–40. doi:https://doi.org/10.1016/j.scitotenv.2007.04.024.
- Beecken, J., J. Mellqvist, K. Salo, J. Ekholm, J.-P. Jalkanen, L. Johansson, V. Litvinenko, K. Volodin, and D. A. Frank-Kamenetsky. 2015. Emission factors of SO2, NOx and particles from ships in Neva Bay from ground-based and helicopter-borne measurements and AIS-based modeling. Atmos. Chem. Phys. 15 (9):5229–41. doi:https://doi.org/10.5194/acp-15-5229-2015.
- Bešenić, T., J. Baleta, K. Pachler, and M. Vujanović. 2020. Numerical modelling of sulfur dioxide absorption for spray scrubbing. Energy Convers. Manage. 217:112762. doi:https://doi.org/10.1016/j.enconman.2020.112762.
- Bian, J. J., X. Min, S. Zhang, J. Zhang, and C. Li. 2012. Supported manganese dioxide catalyst for seawater flue gas desulfurization application. Chem. Eng. J. 236-238:964–67.
- Brogren, C., and H. T. Karlsson. 1997. Modeling the absorption of SO2 in a spray scrubber using the penetration theory. Chem. Eng. Sci. 52 (18):3085–99. doi:https://doi.org/10.1016/S0009-2509(97)00126-7.
- Brynolf, S., M. Magnusson, E. Fridell, and K. Andersson. 2014. Compliance possibilities for the future ECA regulations through the use of abatement technologies or change of fuels. Trans. Res. Part D Trans. Environ. 28 (5):6–18. doi:https://doi.org/10.1016/j.trd.2013.12.001.
- Caiazzo, G., G. Langella, F. Miccio, and F. Scala. 2013. An experimental investigation on seawater SO2 scrubbing for marine application. Environ. Prog. Sustain. Energy 32 (4):1179–86. doi:https://doi.org/10.1002/ep.11723.
- Charlotte, B., and H. T. Karlsson. 1997. Modeling the absorption of SO2 in a spray scrubber using the penetration theory. Chem. Eng. Sci. 52 (18):3085–99.
- Chen, Z., H. Wang, J. Zhuo, and C. You. 2017. Experimental and numerical study on effects of deflectors on flow field distribution and desulfurization efficiency in spray towers. Fuel Process. Technol. 162:1–12. doi:https://doi.org/10.1016/j.fuproc.2017.03.024.
- Flagiello, D., A. Erto, A. Lancia, and F. Di Natale. 2018. Experimental and modelling analysis of seawater scrubbers for sulphur dioxide removal from flue-gas. Fuel 214:254–63. doi:https://doi.org/10.1016/j.fuel.2017.10.098.
- Flagiello, D., A. Parisi, A. Lancia, C. Carotenuto, A. Erto, and F. Di Natale. 2019. Seawater desulphurization scrubbing in spray and packed columns for a 4.35 MW marine diesel engine. Chem. Eng. Res. Des. 148:56–57. doi:https://doi.org/10.1016/j.cherd.2019.05.057.
- Gerbec, M., A. Stergarsek, and R. Kocjančič. 1995. Simulation model of wet flue gas desulphurization plant. Comput. Chem. Eng. 19:283–86. doi:https://doi.org/10.1016/0098-1354(95)87050-4.
- Gomez, A., N. Fueyo, and A. Tomas. 2007. Detailed modelling of a flue-gas desulfurization plant. Comput. Chem. Eng. 31 (11):1419–31. doi:https://doi.org/10.1016/j.compchemeng.2006.12.004.
- Guo, H., S. Zhou, M. Shreka, and Y. Feng. 2020. A numerical investigation on the optimization of uneven flow in a Marine De-SOx scrubber. Processes 8 (7):862. doi:https://doi.org/10.3390/pr8070862.
- Han, M., S. Hao, J. Zhou, and L. Gao. 2018. Design and experimental study on desulphurization process of ship exhaust. IOP Conference Series: Earth and Environmental Science 121 (3):032005. doi:https://doi.org/10.1088/1755-1315/121/3/032005.
- Harris, D. C. 1999. Quantitative chemical analysis (5 edition). W.H. Freeman & Company. doi:https://doi.org/10.1021/ed030p322.1.
- Iliuta, L. 2019. Modeling and simulations of NOx and SO2 seawater scrubbing in packed-bed columns for marine applications. Catalysts 9 (6):489. doi:https://doi.org/10.3390/catal9060489.
- Javed, K. H., T. Mahmud, and E. Purba. 2006. Enhancement of mass transfer in a spray tower using swirling gas flow. Chem. Eng. Res. Des. 84 (6):465–77. doi:https://doi.org/10.1205/cherd.05119.
- Keey, R. B., et al. 1965. Heat and mass transfer from a single sphere in an extensive flowing fluid. Trans. Inst. Chem. Eng. 43:221–23.
- Kuang, M., J. Wang, X. Hu, and G. Yang. 2020. Seawater/seawater cascade-scrubbing desulfurization performance for exhaust gas of a 162-kW marine diesel engine. J. Environ. Eng. 146 (1):04019090. doi:https://doi.org/10.1061/(ASCE)EE.1943-7870.0001614.
- Marocco, L., and F. Inzoli. 2009. Multiphase euler–lagrange CFD simulation applied to wet flue gas desulphurisation technology. Int. J. Multiph. Flow. 35 (2):185–94. doi:https://doi.org/10.1016/j.ijmultiphaseflow.2008.09.005.
- Marocco, L. 2010. Modeling of the fluid dynamics and SO2 absorption in a gas–liquid reactor. Chem. Eng. J. 162 (1):217–26. doi:https://doi.org/10.1016/j.cej.2010.05.033.
- Mondal, M. K. 2007. Experimental determination of dissociation constant, Henry’s constant, heat of reactions, SO2 absorbed and gas bubble–liquid interfacial area for dilute sulphur dioxide absorption into water. Fluid Phase Equilib. 253 (2):98–107. doi:https://doi.org/10.1016/j.fluid.2007.01.015.
- Morsi, S. A., and A. J. Alexander. 1972. An investigation of particle trajectories in two-phase flow systems. J. Fluid Mech. 55 (2):193–208. doi:https://doi.org/10.1017/S0022112072001806.
- Norman, K. Y. 2002. Liquid phase mass transfer in spray contactors, 37–94. Austin: The University of Texas.
- Qin, M., Y. Dong, L. Cui, J. Yao, and C. Ma. 2019. Pilot-scale experiment and simulation optimization of dual-loop wet flue gas desulfurization spray scrubbers. Chem. Eng. Res. Des. 148:280–90. doi:https://doi.org/10.1016/j.cherd.2019.06.011.
- Qu, J. Y., N. Qi, Z. Li, K. Zhang, P. Wang, and L. Li. 2021. Mass transfer process intensification for SO2 absorption in a commercial-scale wet flue gas desulfurization scrubber. Chem. Eng. Proc. Proc. Inten. 166:108478. doi:https://doi.org/10.1016/j.cep.2021.108478.
- Ranz, W. E., and W. R. Marshall Jr. 1952. Evaporation from drops – I and II. Chem. Eng. Prog. 48 (141):141–46.
- Reynolds, K. J., S. A. Caughlan, and R. S. Strong. 2011. Exhaust gas cleaning system selection guide. Ellicott City, MD: Ship Operations Cooperative Program.
- Selvakumar, K., and M. Y. Kim. 2016. A numerical study on the fluid flow and thermal characteristics inside the scrubber with water injection. J. Mech. Sci. Tech. 30 (2):915–23. doi:https://doi.org/10.1007/s12206-016-0145-2.
- Srivastava, R. K., W. Jozewicz, and C. Singer. 2001. SO2 scrubbing technologies: A review. Environ. Prog. 20 (4):219–28. doi:https://doi.org/10.1002/ep.670200410.
- Whitman, W. G. 1962. The two-film theory of gas absorption. Int. J. Heat Mass. Transf. 5 (5):429–33. doi:https://doi.org/10.1016/0017-9310(62)90032-7.
- Wu, S. L., M. Kuang, M. Zhao, G. Yang, X. Geng, X. Hu, and J. Huang. 2021. ASPEN PLUS desulfurization simulations for the scrubber of a large-scale marine diesel engine: Main scrubbing section’s desulfurization share optimization and superiority confirmation for the seawater/seawater cascade-scrubbing solution. Environ. Sci. Pollut. Res. 28 (17):22131–45. doi:https://doi.org/10.1007/s11356-020-12065-4.
- Yang, G. H., W. J. Hu, and J. H. Zhou. 2008. Simultaneous removal of SO2 and NOx from ship exhaust through a combination of ozone oxidation and sea water scrubbing. Trans. CSICE 26 (3):90–94.
- Zheng, C., Y. Wang, Y. Liu, Z. Yang, R. Qu, D. Ye, C. Liang, S. Liu, and X. Gao. 2019. Formation, transformation, measurement, and control of SO3 in coal-fired power plants. Fuel 241:327–46. doi:https://doi.org/10.1016/j.fuel.2018.12.039.
- Zhong, Y., X. Gao, W. Huo, Z.-Y. Luo, M.-J. Ni, and K.-F. Cen. 2008. A model for performance optimization of wet flue gas desulfurization systems of power plants. Fuel Process. Tech. 89 (11):1025–32. doi:https://doi.org/10.1016/j.fuproc.2008.04.004.
- Zhu, J., S.-C. Ye, J. Bai, Z.-Y. Wu, Z.-H. Liu, and Y.-F. Yang. 2015. A concise algorithm for calculating absorption height in spray tower for wet limestone–gypsum flue gas desulfurization. Fuel Process. Tech. 129:15–23. doi:https://doi.org/10.1016/j.fuproc.2014.07.002.