
ABSTRACT
Alfalfa hay that was grown on a field treated with a methyl bromide and chloropicrin pesticide (at a 98/2 weight ratio) resulted in animal sickness, posing a disposal issue for the harvested feed. In consideration of disposal options, emissions and residues from burning treated and untreated alfalfa hay were sampled and analyzed to provide data for an assessment of potential health and environmental effects. Treated alfalfa hay was tested in parallel with untreated alfalfa in a controlled laboratory combustion facility. Results showed that about half of the bromine and chlorine in the treated hay was emitted and the remaining was retained in the ash. The alfalfa hay burned poorly, with modified combustion efficiencies, the ratio of CO2 to CO + CO2, below 0.89. The emission factor for PM2.5 was statistically higher for the untreated versus treated alfalfa but the PAHs were doubled in the treated alfalfa. The treated alfalfa had significantly more emissions of polychorinated dibenzodioxin/dibenzofuran than the untreated alfalfa by a factor of 10, but less polybrominated dibenzodioxin/dibenzofuran. The high Br concentration in the treated alfalfa biomass may have resulted in formation and emission of mixed halogen compounds which were unable to be analyzed for lack of standards. Comparison of volatile organic compound emissions were unremarkable with the exception of MeBr where emissions from the treated alfalfa were over 300 times higher than the untreated biomass. The potential complications due to emissions and permitting of an open burn or contained incinerator left options for landfilling and feedstock blending for handling the treated alfalfa. Implications: This paper illustrates the issues agricultural managers must deal with concerning the combustive disposal of contaminated crops. A method is presented whereby combustion of contaminated crops can be assessed for their suitability for disposal by open air or enclosed burning.
Introduction
In 2006, twenty-six potato fields were identified as infected with Pale Cyst Nematode (PCN). Immediately the export of potatoes from Idaho was halted until the fields were quarantined by USDA Animal and Plant Health Inspection Service (APHIS). In 2007 and in subsequent years, the fields were treated with various pesticides and biological controls. Methyl bromide and chloropicrin were the primary pesticides used. The quarantine lasted many years, but the pesticide treatments appear to have reduced and/or eliminated PCN from some of the infected fields.
In 2014 and 2015, one of the farmers growing alfalfa hay on their methyl bromide (MeBr) treated fields subsequently fed the alfalfa to livestock which eventually got sick. The cattle experienced lethargy, weakness, open sores, and calf mortality. Blood and tissue samples from the cows confirm high inorganic bromide concentrations. Soil samples from the MeBr treated field showed virtually no detectable inorganic bromide residues; but the alfalfa hay contained residues ranging from approximately 4,000 upwards of 10,000 ppm. Subsequent sampling showed numerous fields and crops with elevated levels of inorganic bromide residues, including wheat, barley, corn, potatoes and alfalfa. MeBr was the pesticide applied but it rapidly converts to inorganic bromide residues that remain in the soil and are taken up by some crops at high concentrations as has been reported (Shtangeeva et al. Citation2018; Turn et al. Citation1997).
Some of the farmers have planted alfalfa for animal feed but because of its deep root structure it has the ability to remove inorganic bromide from the soil and thus help clean the soil. Other crops grown on the fields such as potatoes, barley grain and wheat grain have low levels of inorganic bromide and can safely enter the food market because they have low inorganic bromide residues. There has been an estimated 3,000 to 6,000 Mton bales of barley straw, wheat straw and alfalfa hay that has needed to be disposed of due to high concentrations of inorganic bromide residues. Much of the hay has been sent to landfills. Open field burning, a common practice used in the Northwest to prepare fields for subsequent planting (McCarty et al. Citation2009), was proposed as a method to remove crop residues. Agriculture burning is a common practice in Idaho and the smoke and emissions are closely monitored and controlled by the state department of agriculture. Presumably the Br and Cl constituents would end up partitioned to the emissions or remaining ash from burning the contaminated plant material. To determine the fate of these halogens an open burn test facility was used to simulate the field burn scenario. Pesticide-treated and -untreated hay residues were burned, and the ash residues and emissions were characterized and compared to better inform decisions regarding treatment options. This information gleaned from this study has provided valuable information as to whether burning this MeBr treated would be safe for the environment, farm workers and neighbors living close to the burn site.
Materials and methods
Treated alfalfa was gathered and analyzed from core samples of ten in-field bales resulting in 10,600 ppm bromide, 14.7% moisture (U.S. Department of Agriculture, Animal and Plant Health Inspection Service). Baled, untreated alfalfa as a control was obtained from an Idaho-local commercial source (Cal-Ranch, Idaho Falls, ID). Both alfalfa types were stored in an air-conditioned laboratory prior to use. Both alfalfa types were analyzed for Cl and Br levels in two separate analyses.
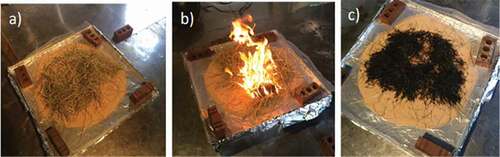
The U.S. EPA/Office of Research and Development’s (ORD’s) 70 m3 open burn test facility (OBTF), located in Research Triangle Park, NC was used as a test site. The OBTF has been described elsewhere (Grandesso et al. Citation2011). In summary it consists of a 3.9 × 3.9 × 4.6 m structure with a high-volume air handler providing dilution air into the test facility to help ensure that open burn conditions (minimal depletion of oxygen concentration) are maintained within the facility during the tests. The biomass (0.75 kg) was burned on a sand-covered burn pan (0.93 m × 0.93 m, ) in the OBTF at the area density found in the field (0.9 kg m−2). The biomass was ignited briefly with a handheld propane torch until flaming was initiated after which sampling commenced.
Figure 1. Photos of a) raw alfalfa, b) burn test, and c) residual ash.
The primary sampling instrument was the “Flyer,” a battery-powered and remotely-controlled system (Aurell and Gullett Citation2013; Aurell et al. Citation2011); its target analytes and sampling instruments/methods are listed in . The primary focus of the analyses was Br- and Cl-containing species that may result from combustion of the MeBr/chloropicrin-treated alfalfa hay and residue (“treated” alfalfa). These included poly-chlorinated and – brominated dibenzo-p-dioxins/dibenzofurans (PXDD/PXDF), hydrogen bromide (HBr), and brominated volatile organic compounds (VOCs) including methyl bromide, bromodichloromethane, dibromochloromethane, bromoform, 1,2-dibromo-3-chloropropane, 1,2-dimethyl bromide.
Table 1. Target compounds and sampling instrumentation/methods (U.S. EPA Citation2017a)
CO2 was continuously measured using non-dispersive infrared (NDIR) instrument (LICOR-820 model, LI-COR Biosciences, USA). CO was monitored using an electrochemical gas sensor (model e2V EC4-500-CO, SGX Sensortech, United Kingdom) which measures CO concentration by means of an electrochemical cell through CO oxidation and changing impedance. The CO2 and CO sensors were calibrated and checked for drift on a daily basis in accordance with U.S. EPA Method 3A (Citation2017b). An Ecotech Serinus 2000 (American Ecotech, Warren, RI, USA) precision gas divider, was used to dilute the high-level span gases for acquiring the mid-point concentrations for the CO2 and CO calibration curves.
Polychlorinated dibenzodioxin/polychlorinated dibenzofuran (PCDD/PCDF), polybrominated dibenzodioxin/polybrominated dibenzofuran (PBDD/PBDF), polycyclic aromatic hydrocarbons (PAHs), volatile organic compounds (VOCs) and carbonyl samples were collected, cleaned up, analyzed, and concentrations determined as described by Gullett et al. (Citation2016). Briefly, PXDD/PXDF were sampled onto a quartz microfiber filter (20.3 × 25.4 cm) and polyurethane foam (PUF) plug using a low voltage Windjammer brushless direct current blower (AMETEK Inc., USA) with a nominal sampling rate of 0.80 m3/min following EPA Method TO-9A (U.S. EPA Citation1999b). The standards used for PCDD/PCDF and PBDD/PBDF identification and quantification were a mixture of standards containing tetra- to octa-PCDD/PCDF and PBDD/PBDF native and 13C-labeled congeners designed for modified U.S. EPA Method 23 (U.S. EPA Citation1991). The World Health Organization (WHO) toxic equivalent factors (TEFs) were used to determine the PCDD/PCDF toxic equivalent (TEQ) emission factors (Van Den Berg et al. Citation2006). The PBDD/PBDF TEQ emission factors were determined using the PCDD/PCDF TEFs based on the International Programme on Chemical Safety (IPCS) suggestions (IPCS-WHO Citation1998). PAHs were sampled using a polyurethane foam (PUF)/XAD-2/PUF sorbent preceded by a quartz microfiber filter with sampling rate of 0.005 m3/min (Leland Legacy pump (SKC Inc., Eighty Four, PA, USA) be calibrated with a Gilibrator Air Flow Calibration System (Sensidyne LP, St. Petersburg FL, USA). PAHs were quantified using labeled standards and are expressed as the concentration of the 16 EPA PAHs on EPA’s hazardous air pollution list (Citation2008). SUMMA canisters (6 L capacity) were used for collection of VOCs via U.S. EPA Method TO-15 (U.S. EPA Citation1999c). Each canister was fitted with a frit of pore size that allowed for approximately 12 min of gas sampling.
PM2.5 batch samples were collected with SKC impactors using 47 mm tared Teflon filter (pore size of 2.0 µm) via a Leland Legacy sample pump (SKC Inc., USA) with a constant airflow of 10 L/min. PM was measured gravimetrically following the procedures described in 40 CFR Part 50 (Citation1987). Particles larger than 2.5 µm in the PM2.5 impactor were collected on an oiled 37 mm impaction disc mounted on the top of the first filter cassette. The Leland Legacy Sample pump was calibrated with a Gilibrator Air Flow Calibration System (Sensidyne LP, USA). and concentrations determined as described in Gullett et al. (Citation2016). HBr and HCl gases were sampled at 2 L/min onto two Na2CO3-coated filters following a quartz prefilter, in accordance to NIOSH Method 7907 (Citation2014). Samples were dissolved/extracted in water, an internal standard added, and then analyzed with ion chromatography as per U.S. EPA SW-846 Method 6850 (U.S. EPA Citation2007).
The modified combustion efficiency (MCE), (∆CO2/(∆CO2+∆CO)), was used to measure how efficiently the biomass burned. Emission factors were calculated using the carbon mass balance approach which assumes that all carbon in the biomass goes into the air as CO2, CO, CH4, and total hydrocarbons (THCs), and that the carbon and pollutants are completely mixed in the plume (Nelson Citation1982). In this study only the major carbon contributions from CO2 and CO emissions (plus CH4 for VOCs only) were used to calculate the total carbon mass sampled as the minor carbon emitters (THC and PM) were ignored without significant effect on the emission factor.
To determine any differences in air emission levels between untreated and treated alfalfa single factor one-way analysis of variance (ANOVA) with a level of significance α = 0.05 was used. To establish significant difference, the ANOVA-returned p value (significance value) has to be less than α = 0.05 and the F/Fcrit value, a measure of the variance ratio between the two populations, has to be greater than 1.0 (Seltman Citation2015).
Results
Twenty-eight burns in total were conducted on MeBr-treated alfalfa and untreated alfalfa. One background sample was collected. Representative photos of the raw biomass staging, the fire, and the post-combustion ash are seen in .
Br and Cl ion concentrations in the unburned (raw) biomass and residual ash varied considerably between replicates, despite rigorous attention to mixing and homogenization of the samples (). The variation in the ash values may be due to different proportions of burnt and unburnt alfalfa in the samples caused by variant combustion efficiencies. The initial concentrations of Br ion in the unburned, treated alfalfa averaged 3600 ppm, lower than the value (10,600 ppm) determined by USDA/APHIS. The difference may be due to additional weathering of the bales before the alfalfa samples were gathered. The levels of Br in the untreated alfalfa were 20 ppm, the detection limit of the method, levels which are consistent with analyses of wheat, 9 to 18 ppm (Da Rosa Couto et al. Citation2018) and 7 ppm (Turn et al. Citation1997). Both treated and untreated raw alfalfa exhibit high levels of Cl ion, averaging of 3170 ppm (relative percent difference, RPD = 13%) and 4370 ppm Cl (RPD = 107%), respectively. These Cl ion concentrations are consistent with previously reported values for Kentucky Bluegrass: 2392 ppm (leaf), 3441 ppm (stem) (Banowetz et al. Citation2009).
Table 2. Bromine and chlorine in the raw biomass and ash
The residue, or “ash” after burn testing was also analyzed. The ash contains both burned and unburned alfalfa. Fourteen burns of the untreated alfalfa resulted in 17% residue and thirteen burns of the treated alfalfa had 29% residue (one of the treated residue was not measured). This difference in combustion properties may not be significant as the sources of alfalfa were distinct. Except for the untreated alfalfa where the Br concentrations were at the limit of detection, the ash generally contains higher levels of both the Br and Cl ions than the raw biomass by about a factor of 2:1 (). If the unburned alfalfa could be practically segregated from the burned alfalfa, this ratio for the ash would increase. The amount of Br and Cl reporting to the ash was higher for the treated rather than the untreated alfalfa. In general, about half of the Br and Cl in the original biomass stayed in the ash. The remainder is assumed to have partitioned to the emissions.
Burn emissions
Both the untreated and treated alfalfa initially flamed when ignited, however, the flaming phase was brief and both alfalfa types soon proceeded to only smolder. In most of the burns the alfalfa had to be relit in order to substantively burn the entire biomass batch. The low MCE numbers for both treated (0.856) and untreated (0.865) alfalfa indicate the poor combustibility of alfalfa (). These MCE’s are low compared to open field combustion of prescribed grass (0.933) and forest burns (0.896–0.979) (Aurell, Gullett, and Tabor Citation2015). The low relative standard deviation (RSD) of the MCEs, 2.9% and 1.3% for untreated and treated alfalfa, respectively, indicated good repeatability of the test procedure. Indicative of the low MCE, the CO2 emission factors (on average 1578 g kg−1 biomass) are low and the CO emission factors (on average 144 g kg−1 biomass) are high compared to grass/forb/shrub field burning, where the CO2 and CO emission factors were 1711 g kg−1 biomass and 78 g kg−1 biomass, respectively (Aurell, Gullett, and Tabor Citation2015).
Table 3. Emission factor results
PM2.5
A statistically significant difference was found between PM2.5 levels emitted from treated alfalfa and untreated alfalfa (F/Fcrit = 2.3, p = .0057). Higher PM2.5 emissions were found from untreated alfalfa than treated alfalfa (). These emission factors (47 ± 12 and 32 ± 6.5 g kg−1 biomass) were high compared to literature emissions from different grass species (savanna, saw grass, wire grass, Kentucky bluegrass, wheat stubble, 4.0–20 g kg−1 biomass) (Dhammapala et al. Citation2006; Holder et al. Citation2017; Urbanski, Hao, and Baker Citation2009; Yokelson et al. Citation2011). Figure SI-1 reveals that most of the PM emitted was of a diameter 1 µm or less. The treated and untreated alfalfa, respectively, had 98.5% and 97.5% of their mass less than 1 µm (see Figure SI-2). No strong relationship could be found between PM2.5 emission factors and MCE, most likely due to the similar MCE values during each of the test burns.
HBr and HCl
HBr and HCl emissions were not detected from any of the samples despite Cl levels in both raw biomasses exceeding 2,000 ppm and the expectation that HCl emissions tend to follow Cl content in raw biomass (Keene et al. Citation2006). The highest possible emission level based on use of the method detection limit for both HBR and HCl and the sampling volume would have been 38 mg kg−1 biomass (). These HCl values are low compared to open burning of Chaparral biomass 174 ± 139 mg kg−1 biomass (Burling et al. Citation2010). Burling et al. (Citation2010) visibly observed that the HCl emissions correlated to flaming combustion of leafy materials, which may suggest that the lack of emitted HCl from alfalfa biomass is due to the predominant smoldering with low MCE. Biomass burning experiments have found that Cl was the most efficiently recovered element in the PM (10–35%) suggesting that the more of the Cl partitioned to the particle phase rather than gas phase (Turn et al. Citation1997).
VOCs and carbonyls
VOCs were monitored due to their harm to human health, their participation in formation of ozone in the presence of NOx and light, and their role in forming secondary organic aerosols. lists all detectable and brominated VOCs; the full list of VOCs is in Table SI-1. The only detected Br-VOC was MeBr, which showed significantly (F/Fcrit = 4.9, p = .0035) higher emissions from treated (739 ± 207 mg kg−1 biomass) than untreated (2.3 ± 1 mg kg−1 biomass) alfalfa (). The MeBr in the emissions of the treated alfalfa accounted for 14% of the Br in the raw treated alfalfa (3,665 ppm, ). The MeBr levels for untreated alfalfa are at the low end of the range for emissions from Southern Africa Savanna grassland and woodland fires: 2–160 mg kg−1 (Sinha et al. Citation2004). Benzene was also higher from treated alfalfa compare to untreated (F/Fcrit = 2.3, p = .013) at 820 ± 37 mg kg−1 biomass and 507 ± 122 mg kg−1 biomass, respectively. However, some VOCs, for example, 1,3-butadiene showed no significant difference (F/Fcrit 0.65, p = .090) in emission levels between the treated (627 ± 22 mg kg−1 biomass) and untreated alfalfa (443 ± 141 mg kg−1 biomass).
Table 4. Selected VOC emission factors
A convincing relationship between emission levels and MCE could not be thoroughly assessed due to the limited number of VOC samples collected (n = 3) from each of the biomass types as well as the similarities in MCE values for each test. However, some of the VOCs such as benzene, toluene, o-xylene, styrene, ethylbenzene, and 1,3-butadiene showed high correlations with MCE for untreated alfalfa, with emission levels increasing with lower MCE (). Similar observations were made for treated alfalfa although the r2 values were not as strong.
Figure 2. Modified combustion efficiency (MCE) versus VOC emission factors.
Less than half of the 124 VOCs analyzed were detected. A number of VOCs such as vinyl acetate, toluene, and chloromethane showed more than 2-fold higher emission levels than from open burning of other biomass sources such as longleaf pine forest (Aurell and Gullett Citation2013), Douglas fir (Aurell et al. Citation2017a), grass/forb/shrub field (Aurell, Gullett, and Tabor Citation2015). One likely reason for these distinctively higher emission factors is the low MCEs (0.856–0.865). Notable are the high chloromethane emission factors emitted from both untreated and treated alfalfa, 2147 ± 866 mg kg−1 biomass and 1106 ± 376 mg kg−1 biomass, respectively. This may be due to combination of the high chlorine content in the raw biomass () and the low MCEs during the burns (). The chloromethane emission levels (on average 1,600 mg kg−1 biomass) are comparatively higher than from open burning of peat (on average 300 mg kg−1 biomass) with similar MCE (on average 0.840) and lower raw peat Cl content (on average 325 ppm) (Black et al. Citation2016; George et al. Citation2016). Vinyl acetate has shown to be a VOC emitted from smoldering of biomass with increasing emission levels with decreased MCE (McKenzie et al. Citation1995), supporting the results in this study.
Acetone was analyzed from both the DNPH cartridges (one sample per biomass type) and the SUMMA canisters resulting in similar emission factors from both types of sampling methods (). The acetone emission level from the DNPH cartridge was within the standard deviation of the SUMMA canister result, supporting the reliability of the other carbonyl emission factors such as acetaldehyde and formaldehyde. The acetaldehyde showed approximately 70% higher emission level from treated alfalfa than untreated, while the other carbonyl emission levels such as formaldehyde were not distinguishable from treated and untreated alfalfa ().
Table 5. Carbonyl emission factors
PCDDs/PCDFs and PBDDs/PBDFs
A significant difference (F/Fcrit = 7.8, p = .0015) in PCDD/PCDF emission levels between treated and untreated alfalfa was found with the treated biomass emission levels approximately 10 times higher than those emitted from burns of untreated alfalfa. This result exists despite the apparent similarity in Cl content between the two biomass types ( and ). The treated samples contain significantly more Br content which has been variously shown to both promote (Zhang, Buekens, and Li Citation2016) and detract (Lemieux, Stewart, and Ryan Citation2002) from formation of PCDD/PCDF, the latter case due to enhanced and favored production of mixed halogen Cl/Br dioxins/furans. Mixed Cl/Br dioxin/furan levels were not measured in this work due to lack of standards and quantification criteria.
Figure 3. PCDD/PCDF and PBDD/PBDF from treated and untreated alfalfa biomass. Error bars represent RSD.
The untreated PCDD/PCDF emission levels, 0.30 ± 0.18 ng toxic equivalents (TEQ) kg−1 biomass, compare well to laboratory burn data of Kentucky bluegrass and wheat straw 0.11–0.60 ng TEQ kg−1 biomass (Gullett and Touati Citation2003; Gullett, Touati, and Oudejans Citation2008), field data for Kentucky bluegrass (0.18 ng TEQ kg−1) and field data for wheat stubble (0.32 ng TEQ kg−1) while the treated alfalfa emissions, 3.6 ± 0.71 ng TEQ kg−1 biomass, were within the emission level range of prescribed forest burns 0.092–4.6 ng TEQ kg−1 biomass (Aurell and Gullett Citation2013; Aurell, Gullett, and Tabor Citation2015).
Both the treated and untreated alfalfa emitted more PCDD than PCDF (Figure SI-3). The PCDD emissions from the treated and untreated alfalfa were responsible for 96% and 76%, respectively, of the TEQ emission factor. This distinction is muted somewhat when comparisons are made of the Total values: 92% and 72%. The predominance of PCDD compares well with previous field measurements of open burning in which PCDD TEQ emissions were 72% and 78% of the total TEQ from Kentucky Bluegrass (a single measurement) and wheat stubble (two measurements), respectively. Minor variations in the PCDD homologue profiles were found between the treated and untreated alfalfa, while the PCDF homologue profile exhibited higher levels of HpCDFs from the treated alfalfa (Figure SI-4).
While the PCDD/PCDF levels were about ten times higher for the treated versus untreated biomass, the opposite was observed with PBDD/PBDF levels; approximately three times higher PBDD/PBDF emission levels were found from untreated alfalfa than treated alfalfa (). The PBDD/PBDF emission levels were generally low and not all PBDD/PBDF congeners were detected in the collected samples, resulting in large RSDs (98% and 136%, ) between replicates. The PBDF emission factors are similar for both treated (0.10 ng TEQ kg−1 biomass) and untreated (0.16 ng TEQ kg−1 biomass) alfalfa while the treated sampled had no detectable levels of PBDD. The untreated alfalfa plume sampled consisted of 46% PBDFs and 54% PBDDs. A literature search shows no publications on PBDD/PBDF emissions from a biomass source previous to this study. The highest PBDD/PBDF emission level observed in this work (0.36 ng TEQ kg−1 biomass) was in the same range as from open burning of Mexican domestic waste dumps (0.47 ± 0.49 ng TEQ kg−1 fuel) (Gullett et al. Citation2010).
PAHs
The emission factor of sum of PAH16 (16 EPA PAHs, ) for treated alfalfa (160.2 ± 8.6 mg kg−1 biomass) was significantly higher than for untreated alfalfa (76.6 ± 11.0 mg kg−1 biomass) according to ANOVA analyses (F/Fcrit = 14, p = .0005). The PAH16 emission factor from untreated alfalfa, 76.6 ± 11.0 mg kg−1 biomass compares with PAH16 emissions emitted from open field burns of wheat straw stubble (53 mg/kg biomass (Holder et al. Citation2017) and 73 mg/kg biomass (Jenkins et al. Citation1996)). PAH16 plume emission from treated alfalfa, (160 ± 8.6 mg kg−1 biomass), where in the same range as open burning of jet fuel (189 ± 5.9 mg kg−1 fuel (Aurell et al. Citation2017b)). The PAH16 emission levels were substantially higher (76.6 and 160.0 mg kg−1 biomass) than from grass/shrub burns (22 mg kg−1 biomass grass/shrub burns (Aurell, Gullett, and Tabor Citation2015)) likely attributed to the lower MCE 0.856–0.865 compared to 0.933 ± 0.007, respectively.
Table 6. PAH emission factors from open burning of treated and untreated alfalfa
The most abundant PAH for both untreated and treated alfalfa was naphthalene, comprising approximately 68% by mass of the total PAH16 emission factor. This is consistent with results from Jenkins et al. (Citation1996) burning wheat and barley straw that saw an average naphthalene weight contribution of 66%. Acenapthylene, phenanthrene, and fluorene followed naphthalene in abundance. The PAH16 emission factor from untreated alfalfa, excluding naphthalene, was 24.2 mg kg−1 biomass which is similar to wheat straw at 28 mg kg−1 biomass (Jenkins et al. Citation1996). The PAH16 emission factor for treated alfalfa was higher than the untreated at 76.6 mg kg−1 biomass. Removal of naphthalene from the PAH16 emission factor did not affect the finding of a significant difference (F/Fcrit = 4.0, p = .005) between treated and untreated alfalfa. The increased PAH yield with the treated alfalfa may be due to the role of Br in suppressing combustion. Br is a known flame retardant which scavenges the hydroxyl radical (OH−) which is involved in carbon oxidation reactions.
Conclusion
Air emissions from open burning of untreated and treated (98/2 weight ratio of MeBr/chloropicrin) alfalfa were characterized and contrasted for a broad array of pollutants. In the raw biomass, the treated alfalfa had at least two orders of magnitude more bromine than the untreated alfalfa. Roughly equivalent levels of chloride were found in both raw biomass types.
In the smoke emissions, only one volatile brominated compound, MeBr, was detected from both untreated and treated alfalfa. For the treated alfalfa, approximately 14% of the bromine originally in the raw biomass was released as MeBr. The MeBr levels in the smoke from treated alfalfa were two orders of magnitude higher than levels in smoke from untreated alfalfa. Higher levels of PBDD/PBDF were found in the emissions from the untreated alfalfa and the treated alfalfa resulted in an order of magnitude higher levels of PCDD/PCDF despite similar initial Cl concentrations. Higher PM2.5 emissions were found from untreated alfalfa than treated alfalfa while the opposite was found for PAH emissions. These PCDD/PCDF, PM2.5, and PAH levels were consistent with historical findings for biomass.
About half of the bromine and chlorine from the treated alfalfa was retained in the residue of ash/unburned alfalfa while the remainder was likely emitted. For the treated alfalfa the concentration of bromide in the ash was almost double that of the unburned alfalfa.
Ultimately, the higher levels of some pollutants from treated biomass as well as the uncertainties and timeline involved in permitting an incinerator may factor into decisions on disposal methods. These data will be useful in informing future decisions regarding agricultural biomass disposal options and risk assessments related to thermal destruction methods. The emission factors can be used for other situations in which health and ecosystem risks need to be assessed but proper consideration should be given to biomass- and treatment-specific factors that could affect emissions.
Supplemental information
Additional information on PM, VOCs, and PXDD/PXDF are included.
Supporting_Infor_Emissions_MeBr_treated_biomass_07_15_21_Clean.docx
Download MS Word (67.4 KB)Disclosure statement
No potential conflict of interest was reported by the author(s).
Data availability statement
Data used in the writing of this manuscript is available at the U.S. Environmental Protection Agency’s Environmental Dataset Gateway (https://edg.epa.gov).
Supplemental Material
Supplemental data for this paper can be accessed on the publisher’s website.
Additional information
Funding
Notes on contributors
Johanna Aurell
Johanna Aurell is a Principal Environmental Scientist with expertise in sampling and characterizing emissions from open and commercial combustion sources using unmanned aerial systems.
Brian Gullett
Brian Gullett is a Scientific and Technical Professional (ST level), Senior Research Engineer with the U.S. Environmental Protection Agency’s Office of Research and Development (ORD), located in Research Triangle Park, North Carolina. His research has investigated formation mechanisms of chlorinated dioxins and furans in combustion systems, as well as other organohalogen compounds. His current work involves development of emission samplers for use on unmanned aircraft systems to characterize hazardous pollutants from open air combustion and detonation processes.
Dirk Helder
Dirk Helder worked for ten years at the U.S. Environmental Protection Agency’s Office of Pesticide Programs developing risk mitigation strategies to ensure pesticides can be safely used while also protecting human health and the environment. He focused on protecting pesticide applicators and farmworkers from the harmful effects of pesticide thru more effective and understandable pesticide label language. He has spent the past fifteen years in EPA Region 10, in the Enforcement and Compliance Assurance Division working primarily with Northwest state departments of agriculture on water quality, ESA, pesticide applicator and farmworker issues. The opportunity to work more closely with field staff from the states and have the chance to interface between EPA and farmer workers and pesticide applicators has been his primary focus.
Robert Elleman
Robert Elleman works for U.S. Environmental Protection Agency Region 10 (Alaska, Idaho, Oregon, Washington) as the science research liaison. His research has focused on airborne particulate matter in the U.S. Pacific Northwest and Alaska to understand the emissions, transport, short-term forecasting, and control technologies of biomass burning.
References
- 40 CFR Part 50, Appendix L. 1987. Reference method for the determination of particulate matter as PM2.5 in the atmosphere. Accessed July 2021. https://www.gpo.gov/fdsys/pkg/CFR-2014-title40-vol2/pdf/CFR-2014-title40-vol2-part50-appL.pdf.
- Aurell, J., and B. K. Gullett. 2013. Emission factors from aerial and ground measurements of field and laboratory forest burns in the Southeastern US: PM2.5, Black and Brown Carbon, VOC, and PCDD/PCDF. Environ. Sci. Technol. 47:8443–52. doi:https://doi.org/10.1021/es402101k.
- Aurell, J., B. K. Gullett, C. Pressley, D. Tabor, and R. Gribble. 2011. Aerostat-lofted instrument and sampling method for determination of emissions from open area sources. Chemos 85:806–11. doi:https://doi.org/10.1016/j.chemosphere.2011.06.075.
- Aurell, J., B. K. Gullett, and D. Tabor. 2015. Emissions from southeastern U.S. Grasslands and pine savannas: Comparison of aerial and ground field measurements with laboratory burns. Atmos. Environ. 111:170–78. doi:https://doi.org/10.1016/j.atmosenv.2015.03.001.
- Aurell, J., B. K. Gullett, D. Tabor, and N. Yonker. 2017a. Emissions from prescribed burning of timber slash piles in Oregon. Atmos. Environ. 150: 395–406. doi:https://doi.org/10.1016/j.atmosenv.2016.11.034.
- Aurell, J., D. Hubble, B. K. Gullett, A. Holder, and E. Washburn. 2017b. Characterization of emissions from liquid fuel and propane open burns. Fire Technol. 53:2023–38. doi:https://doi.org/10.1007/s10694-017-0670-2.
- Banowetz, G. M., S. M. Griffith, J. J. Steiner, and H. M. El-Nashaar. 2009. Mineral accumulation by perennial grasses in a high-rainfall environment. Energ. Fuel. 23:984–88. doi:https://doi.org/10.1021/ef800488j.
- Black, R. R., J. Aurell, A. Holder, I. J. George, B. K. Gullett, M. D. Hays, C. D. Geron, and D. Tabor. 2016. Characterization of gas and particle emissions from laboratory burns of peat. Atmos. Environ. 132:49–57. doi:https://doi.org/10.1016/j.atmosenv.2016.02.024.
- Burling, I. R., R. J. Yokelson, D. W. T. Griffith, T. J. Johnson, P. Veres, J. M. Roberts, C. Warneke, S. P. Urbanski, J. Reardon, D. R. Weise, et al. 2010. Laboratory measurements of trace gas emissions from biomass burning of fuel types from the southeastern and southwestern United States. Atmos. Chem. Phys. 10:11115–30. doi:https://doi.org/10.5194/acp-10-11115-2010.
- Da Rosa Couto, R., J. Faversani, C. A. Ceretta, P. A. A. Ferreira, C. Marchezan, D. Basso Facco, L. P. Garlet, J. S. Silva, J. J. Comin, C. A. Bizzi, et al. 2018. Health risk assessment and soil and plant heavy metal and bromine contents in field plots after ten years of organic and mineral fertilization. Ecotox. Environ. Safe. 153:142–50. doi:https://doi.org/10.1016/j.ecoenv.2018.01.046.
- Dhammapala, R., C. Claiborn, J. Corkill, and B. Gullett. 2006. Particulate emissions from wheat and Kentucky bluegrass stubble burning in eastern Washington and northern Idaho. Atmos. Environ. 40:1007–15. doi:https://doi.org/10.1016/j.atmosenv.2005.11.018.
- George, I. B., R. R. Black, C. Geron, J. Aurell, M. Hays, W. Preston, and B. Gullett. 2016. Volatile and semivolatile organic compounds in laboratory peat fire emissions. Atmos. Environ. 132:163–70. doi:https://doi.org/10.1016/j.atmosenv.2016.02.025.
- Grandesso, E., B. Gullett, A. Touati, and D. Tabor. 2011. Effect of moisture, charge size, and chlorine concentration on PCDD/F emissions from simulated open burning of forest biomass. Environ. Sci. Technol. 45:3887–94. doi:https://doi.org/10.1021/es103686t.
- Gullett, B. K., B. Wyrzykowska, E. Grandesso, A. Touati, D. G. Tabor, and G. S. Ochoa. 2010. PCDD/F, PBDD/ F,and PBDE emissions from open burning of a residential waste dump. Environ. Sci. Technol. 44:394–99. doi:https://doi.org/10.1021/es902676w.
- Gullett, B. K., J. Aurell, A. Holder, W. Mitchell, D. Greenwell, M. Hays, R. Conmy, D. Tabor, W. Preston, I. George, et al. 2016. Characterization of emissions and residues from simulations of the deepwater horizon surface oil burns. Mar. Pollut. Bull. 117:392–405. doi:https://doi.org/10.1016/j.marpolbul.2017.01.083.
- Gullett, B., and A. Touati. 2003. PCDD/F emissions from burning wheat and rice field residue. Atmos. Environ. 37:4893–99. doi:https://doi.org/10.1016/j.atmosenv.2003.08.011.
- Gullett, B., A. Touati, and L. Oudejans. 2008. PCDD/F and aromatic emissions from simulated forest and grassland fires. Atmos. Environ. 42:7997–8006. doi:https://doi.org/10.1016/j.atmosenv.2008.06.046.
- Holder, A. L., B. K. Gullett, S. P. Urbanski, R. Elleman, S. O’Neill, D. Tabor, W. Mitchell, and K. R. Baker. 2017. Emissions from prescribed burning of agricultural fields in the Pacific Northwest. Atmos. Environ. 166:22–33. doi:https://doi.org/10.1016/j.atmosenv.2017.06.043.
- IPCS-WHO. 1998. Polybrominated Dibenzo-p-Dioxins and Dibenzofurans. Geneva: International Program on Chemical Safety, World Health Organization. Environmental Health Criteria 205. Accessed July 2021. http://www.inchem.org/documents/ehc/ehc/ehc205.htm.
- Jenkins, B. M., A. D. Jones, S. Q. Turn, and R. B. Williams. 1996. Emission factors for polycyclic aromatic hydrocarbons from biomass burning. Environ. Sci. Technol. 30:2462–69. doi:https://doi.org/10.1021/es950699m.
- Keene, W. C., J. M. Lobert, P. J. Crutzen, J. R. Maben, D. H. Scharffe, T. Landmann, C. Hély, and C. Brain. 2006. Emissions of major gaseous and particulate species during experimental burns of Southern African biomass. J. Geophys. Res. Atmos. 111:D04301. doi:https://doi.org/10.1029/2005JD006319.
- Lemieux, P. M., E. S. Stewart, and J. V. Ryan. 2002. Pilot-scale studies on the effect of bromine addition on the emissions of chlorinated organic combustion by-products. Waste Manage. 22:381–89. doi:https://doi.org/10.1016/S0956-053X(02)00020-X.
- McCarty, J. L., S. Korontzi, C. O. Justice, and T. Loboda. 2009. The spatial and temporal distribution of crop residue burning in the contiguous United States. Sci. Total Environ. 407:5701–12. doi:https://doi.org/10.1016/j.scitotenv.2009.07.009.
- McKenzie, L. M., W. M. Hao, G. N. Richards, and D. E. Ward. 1995. Measurement and modeling of air toxins from smoldering combustion of biomass. Environ. Sci. Technol. 29:2047–54. doi:https://doi.org/10.1021/es00008a025.
- Nelson, R. M., Jr. 1982. An evaluation of the carbon balance technique for estimating emission factors and fuel consumption in forest fires. USA Research Paper SE-231, U.S. Department of Agriculture, Forest Service, Southeastern Forest Experiment Station, Asheville, NC.
- NIOSH 7907. 2014. Volatile acids by ion chromatography. Accessed July 2021. https://www.cdc.gov/niosh/docs/2003-154/pdfs/7907.pdf.
- Seltman, H. J. 2015. Experimental Design and Analysis. Carnegie Mellon University http://www.stat.cmu.edu/~hseltman/309/Book/Book.pdf.
- Shtangeeva, I., P. Perämäki, M. Niemelä, E. Kurashov, and Y. Krylova. 2018. Potential of wheat (Triticum aestivum L.) and pea (Pisum sativum) for remediation of soils contaminated with bromides and PAHs. Int. J. Phytoremediation 20:560–66. doi:https://doi.org/10.1080/15226514.2017.1405375.
- Sinha, P., P. V. Hobbs, R. J. Yokelson, D. R. Blake, S. Gao, and T. W. Kirchstetter. 2004. Emissions from miombo woodland and dambo grassland savanna fires. J. Geophys. Res-Atmos. 109 (D11):D11305. doi:https://doi.org/10.1029/2004JD004521.
- Turn, S. Q., B. M. Jenkins, J. C. Chow, L. C. Pritchett, D. Campbell, T. Cahill, and S. A. Whalen. 1997. Elemental characterization of particulate matter emitted from biomass burning: Wind tunnel derived source profiles for herbaceous and wood fuels. J. Geophys. Res-Atmos. 102:3683–99. doi:https://doi.org/10.1029/96JD02979.
- U.S. EPA Compendium Method TO-11A. 1999a. Determination of formaldehyde in ambient air using adsorbent cartridge followed by high performance liquid chromatography (HPLC). Accessed July 2021. https://www3.epa.gov/ttnamti1/files/ambient/airtox/to-11ar.pdf.
- U.S. EPA Compendium Method TO-15. 1999c. Determination of volatile organic compounds (VOCs) in air collected in specially-prepared canisters and analyzed by gas chromatography/mass spectrometry (GC/MS). Accessed July 2021. https://www3.epa.gov/ttnamti1/files/ambient/airtox/to-15r.pdf.
- U.S. EPA Hazardous Air Pollution List. 2008. Clean air act: Title 42 - The public health and welfare. U.S. Government Printing Office. §7412. Accessed July 2021. http://www.gpo.gov/fdsys/pkg/USCODE-2008-title42/pdf/USCODE-2008-title42-chap85.pdf.
- U.S. EPA Method 23. 1991. Determination of polychlorinated dibenzo-p-dioxins and polychlorinated dibenzofurans from stationary sources. Accessed February 12, 2019. https://www.epa.gov/sites/production/files/2017-08/documents/method_23.pdf.
- U.S. EPA Method 25C. 2017a. Determination of nonmethane organic compounds (NMOC) in landfill gases. Accessed July 2021. https://www.epa.gov/sites/production/files/2017-08/documents/method_25c.pdf.
- U.S. EPA Method 3A. 2017b. Determination of oxygen and carbon dioxide concentrations in emissions from stationary sources (instrumental analyzer procedure). Accessed July 2021. https://www.epa.gov/sites/production/files/2017-08/documents/method_3a.pdf.
- U.S. EPA Method 6850. 2007. Perchlorate in water, soils and solid wastes using high performance liquid chromatography/electrospray inonization /mass spectrometry (HPLC/ESI/MS or HPLC/ESI/MS/MS). Accessed July 2021. https://www.epa.gov/sites/production/files/2015-12/documents/6850.pdf.
- U.S. EPA Method TO-13A. 1999b. Determination of polycyclic aromatic hydrocarbons (PAHs) in ambient air using gas chromatography/mass spectrometry (GC/MS). Accessed July 2021. https://www.epa.gov/sites/production/files/2019-11/documents/to-13arr.pdf.
- U.S. EPA. 2013. Photochemical assessment monitoring stations compound target list. Accessed July 2021. https://www.epa.gov/amtic/photochemical-assessment-monitoring-stations-pams-volatile-organic-compound-target-list.
- Urbanski, S. P., W. M. Hao, and S. Baker. 2009. Chemical composition of wildland fire emissions. In Developments in Environmental Science, ed. A. Bytnerowicz, M. Arbaugh, A. Riebau, and C. Andersen, 79–107. https://www.fs.usda.gov/treesearch/pubs/33764.
- Van Den Berg, M., L. S. Birnbaum, M. Denison, M. De Vito, W. Farland, M. Feeley, H. Fiedler, H. Hakansson, A. Hanberg, L. Haws, et al. 2006. The 2005 World Health Organization reevaluation of human and mammalian toxic equivalency factors for dioxins and dioxin-like compounds. Toxicol. Sci. 93:223–41. doi:https://doi.org/10.1093/toxsci/kfl055.
- Yokelson, R. J., I. R. Burling, S. P. Urbanski, E. L. Atlas, K. Adachi, P. R. Buseck, C. Wiedinmyer, S. K. Akagi, D. W. Toohey, and C. E. Wold. 2011. Trace gas and particle emissions from open biomass burning in Mexico. Atmos. Chem. Phys. 11:6787–808. doi:https://doi.org/10.5194/acp-11-6787-2011.
- Zhang, M., A. Buekens, and X. Li. 2016. Brominated flame retardants and the formation of dioxins and furans in fires and combustion. J. Hazard. Mater. 304:26–39. doi:https://doi.org/10.1016/j.jhazmat.2015.10.014.