
 ?Mathematical formulae have been encoded as MathML and are displayed in this HTML version using MathJax in order to improve their display. Uncheck the box to turn MathJax off. This feature requires Javascript. Click on a formula to zoom.
ABSTRACT
Air pollution control is a worldwide problem of common concern to all mankind. Electrostatic precipitator (ESP) plays an important role in the purification of flue gas and dust. At present, in a multi-electrode ESP, the middle discharge electrode is often inhibited by the outer discharge electrode, commonly known as electrostatic shielding, which seriously affects the electric field distribution and dust removal effect of ESP. In order to explore this characteristic, this research established a mathematical model of ESP and simulated the electrostatic shielding phenomenon of wire-plate ESP, which quantified the influence of various factors on the degree of electrostatic shielding and analyzed the potential impact of electrostatic shielding on particle charging and dust removal efficiency. The results of the study show that the wire-to-plate distance has the greatest impact on electrostatic shielding, followed by the discharge electrode radius, voltage, and the wire-to-wire distance. When the degree of electrostatic shielding increases, the dust removal efficiency of ESP decreases. In addition, increasing the number of discharge electrodes to increase the dust removal efficiency of ESP is only feasible within a certain range. When the number of discharge electrodes exceeds a certain threshold, the dust removal efficiency of ESP decreases due to the effect of electrostatic shielding. The results of the research provide guidance for the determination of the geometric parameters of ESP and can make theoretical predictions for the occurrence of electrostatic shielding, thereby effectively avoiding the occurrence of electrostatic shielding.
Implications: Electrostatic precipitator plays an important role in the purification of flue gas and dust. Electrostatic shielding seriously affects the electric field distribution and dust removal effect of ESP. The research quantified the influence of various factors on the degree of electrostatic shielding and analyzed the potential impact of electrostatic shielding on particle charging and dust removal efficiency. It is expected that through the research, some guidance will be provided for the determination of the geometric parameters of ESP and can make theoretical predictions for the occurrence of electrostatic shielding, thereby effectively avoiding the occurrence of electrostatic shielding.
Introduction
In recent years, the problem of environmental pollution has become increasingly serious, which has already affected people’s normal lives and threatened human life and health. The presence of PM10 and PM2.5 in the atmosphere can cause great harm to the human body. Inhalation of these carcinogenic particles by the human body increases the risk of cancer (Yi, Yin, and Huang Citation2013; Zeng, Yu, and Xia Citation2006). Therefore, how to reduce the pollutants in the atmosphere and how to control the discharge of pollutants has become a social issue that has attracted wide public attention (Wu, Yu, and Xia Citation2014). ESP is a device that collects dust in flue gas by electrostatic purification method, and is an ideal equipment for purifying industrial waste gas. The internal high voltage of ESP will cause radio wave interference to most of the instruments, and there are also great safety risks. Therefore, it is difficult to test the space charge density distribution and the movement characteristics of ESP. With the continuous development of computer simulation technology and methods, problems that cannot be solved by testing methods can be solved through numerical simulation.
As early as 1977, Mcdonald, Smith, and Iii (Citation1977) developed a numerical technique to solve the corona electrostatic field in the ESP. So far, the numerical simulation research of ESP process has mainly focused on the use of finite element (FEM) characteristic method (MoC) (Al-Hamouz, Citation2002; Davis and Hoburg Citation1983), FEM-boundary element method (BEM)-MoC (Zhao and Adamiak Citation2008), FEM-charge simulation method (CSM) (Elmoursi and Castle Citation2008), FEM-Volume Element Method (DCM) (Levin and Hoburg Citation1990) and Finite Difference Method (FDM)-MoC (Anagnostopoulos and Bergeles Citation2002) and other methods to solve the complex corona discharge control equations of small laboratory scale ESP. E. Lami (Lami, Mattachini, and Sala Citation1997) and others used the finite difference method to calculate the electric field intensity and space charge density. Lei, Wang, and Wu (Citation2004). used the upwind scheme to calculate the potential distribution in the 3D case of the wire-plate ESP. Lobry (Citation2014) proposed a new numerical method for calculating the corona space charge density and electric field distribution in the wire-plate ESP. The electric potential vector formula is used to calculate the electrostatic field, and the current continuity formula is used to derive the space charge density. The technology of the FEM-DCM combined method is applied, and the solution process is obtained iteratively by using the Newton-Raphson algorithm. Choi and Fletcher (Citation1997) simulated the electric field and ion discharge process by the finite volume method, studied the influence of electric field strength and current on the charging characteristics of particles, and pointed out that the charging characteristics of particles depend on the electric field strength and residence time. The above research ignores the effect of electrostatic shielding, and currently only a few studies consider the effect of electrostatic shielding. Kasdi (Citation2016) studied a single-channel ESP with multiple discharge electrodes through experiments and numerical simulations, and analyzed the V–I characteristics of ESP and found that under certain conditions, the discharge current from the intermediate discharge electrode was suppressed, in other words, the current density of the dust collecting plate facing the middle discharge electrode is lower than the current density of the dust collecting plate facing the outer discharge electrode (He and MohanDass Citation2018a, Citation2018b; Kasdi Citation2016). The cumulative effect of this phenomenon is that when the wire-to-wire distance is reduced to a certain threshold, the total corona current will decrease. Al-Hamouz, El-Hamouz, and Abuzaid (Citation2011) used experimental measurement and numerical simulation techniques to study the performance of the wire-plate ESP, including the corona current with the functional relationship between the wire-to-wire distance, wire-to-plate distance and discharge electrode radius, whose results are similar with Kasdi (Citation2016). In an ESP with three discharge electrodes in a single channel, the current density of the middle discharge electrode is lower than that of the outer two discharge electrodes. Wang, Zhang, and Gao (Citation2021) established a comprehensive model to study the effect of optimizing corona wire arrangement on improving the performance of ESP. It is concluded that the total current was increased initially and then decreased with the increase of wire-wire distance, and the dust removal efficiency increased with the decrease of wire-plate distance. In addition, electrostatic shielding is also mentioned in the study of Abdel-Salam and Eid (Citation2002). The ESP with multiple discharge electrodes reduces the corona current of the middle discharge electrode, which is commonly known as electrostatic shielding. So far, the influence factors of electrostatic shielding of ESP and the influence of electrostatic shielding on the performance of ESP are rarely mentioned (Arif, Branken, and Everson Citation2018).
Based on the above research background, this research systematically analyzes the influencing factors of electrostatic shielding. The previously verified numerical model (Chen, Guo, and Li Citation2020) is used to further study the electrostatic shielding effect between adjacent discharge electrodes in ESP. First, by comparing with the experimental results of Penney and Matick (Citation1960) and Kasdi (Citation2016), it is verified that the previously published numerical model can accurately evaluate the electrostatic shielding effect. Secondly, by analyzing the space charge density distribution cloud chart of the surface of the dust collection plate when the applied voltage, the wire-to-wire distance (the distance between adjacent discharge electrodes), the wire-to-plate distance (the distance between the discharge electrode and the dust collection plate), the discharge electrode radius and the number of discharge electrodes changes, we systematically studied the electrostatic shielding effect between adjacent discharge electrodes, and analyzed the significance of each factor on the electrostatic shielding effect by using the method of orthogonal experiment. Finally, the influence of electrostatic shielding on particle charging and dust removal efficiency of ESP is analyzed. The work carried out in the paper quantified the impact of electrostatic shielding on ESP, and provided a basis for the selection of geometric parameters of ESP.
Mathematical model and solution method
Governing equation
The electric field distribution in the wire-plate ESP is not uniform. In this paper, the influence of the particles on the electric field after being charged is ignored. The electric potential distribution in the space is mainly controlled by the Poisson equation, and the movement of the space charge is mainly controlled by the current continuity equation. When ESP is working, the airflow containing a large number of dust particles enters ESP. Because the gas ions are affected by the electric field force, this paper uses the momentum conservation equation and the k-ω turbulence model to simulate the airflow in ESP. Assuming that the dust particles passing through ESP are electrically neutral spherical particles, there are two particle charging mechanisms inside ESP. One is that high-speed moving ions collide with the dust particles under the action of an electric field to charge the particles, which is called electric field charging. The other is that ions collide with dust particles due to thermal motion, thereby charging the particles, which is called diffusion charging. Therefore, this study adopts the Lawless charging model, which considers both electric field charging and diffusion charging. In addition, this paper pays more attention to the characteristics of single particles when analyzing particle motion characteristics, and uses Lagrangian motion model to describe particle motion. In addition to the electric field force, the charged particles are also subjected to drag force and gravity, and finally the particles move toward the dust collector under the combined force.
shows the governing equations of the electric field, flow field and particle transport field during the working process of ESP, and shows the boundary conditions of ESP. The detailed description of the model can be found in previous research (Chen, Guo, and Li Citation2020). In order to further analyze the effect of electrostatic shielding, this study defines the boundary conditions of electric field and space charge density respectively, and defines each discharge electrode as a separate boundary. Using the Kaptzov assumption to set the electric field intensity on the discharge electrode, the field intensity on the surface of the discharge electrode remains constant after corona discharge, and its value is the field intensity of the corona threshold, which is calculated by the Peek formula.
Table 1. Governing equation
Table 2. Boundary conditions
Calculation model of ESP
This paper conducts research on the wire-plate ESP. Its main structure is composed of parallel dust collecting plates and several discharge electrodes. The height and length of the dust collecting plates are fixed. The main parameters are shown in . Considering the low Mach number and the small pressure drop in ESP, the airflow is assumed to be an incompressible Newtonian fluid, the viscosity of the airflow is also assumed to be constant, and the turbulence intensity is set as 1 atm at the outlet of ESP. The particles are introduced into the calculation domain at the entrance of ESP channel, the density is 2000 kg/m3, the particles have a uniform diameter of 1 μm, and the inlet velocity is equal to the gas velocity at the inlet, assuming that the velocity is 1 m/s.
Table 3. Main parameters of ESP
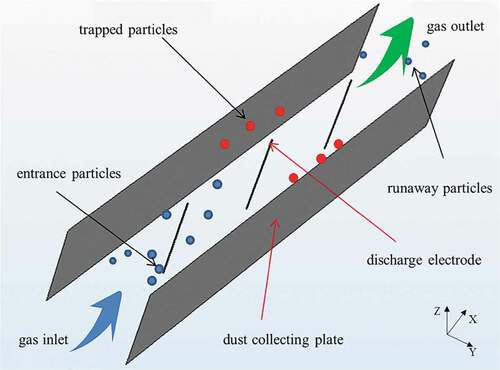
The three-dimensional model diagram of the wire-plate ESP is shown in . It can be seen from that the discharge electrode is located in the middle of ESP channel along the positive direction of the Z axis. The airflow containing particles flows in the positive direction of the X axis. Some particles are trapped on the dust collecting plate, and the other particles escape along the X axis.
Figure 1. Three-dimensional diagram of ESP.
When dividing the mesh, we use the meshing tool that comes with COMSOL/Multiphysics. Using a triangular grid, the geometry changes near the discharge electrode wire and the parameter change gradient near the discharge electrode wire is large, so the mesh is refined, and the number of grid cells in the computational domain changes, depending on the number of discharge electrodes, the wire-to-wire distance, the wire-to-plate distance, and the size of the discharge electrode radius. Both vary. is a schematic diagram of the grid diagram of the computational domain and the schematic diagram of grid diagram around the discharge electrode wire.
Figure 2. Schematic diagram of the grid map of the computational domain and the grid map around the discharge electrode line.
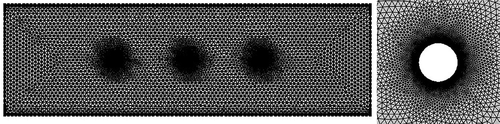
Due to the small radius of the discharge electrode, the grid conditions of the discharge electrode are set strictly, and the grid near the discharge electrode is much finer to ensure the accuracy of the calculation results in the higher current density area.
Results and discussion
Model verification
The general layout of ESP experimental device built in this paper is shown in . It is composed of ESP main body, high-voltage power supply system, board current distribution test system and data acquisition system.
Figure 3. Diagram of experimental setup.
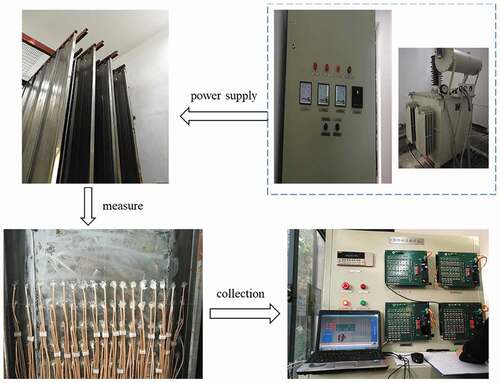
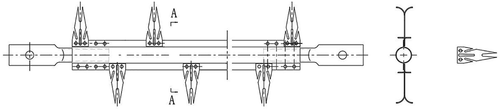
The test bench uses BS barbed discharge electrode, which is the mainstream burr discharge electrode of ESP of coal-fired power generating units, as shown in . The center of the discharge electrode is supported by a circular tube, and the barbed pieces are staggered and fixed on the steel plates on both sides of the circular tube.
Figure 4. BS barbed discharge electrode.
In order to obtain the discharge characteristics of the BS barbed discharge electrode, a copper sheet is arranged on the dust collecting plate to measure the current on the dust collecting plate. The measured current density is shown in . The experimental results in the figure are represented by red dots, and the simulation results are represented by black solid lines, and the experimental and numerical simulation results are compared.
Figure 5. Current density distribution corresponding to the tip of BS discharge.
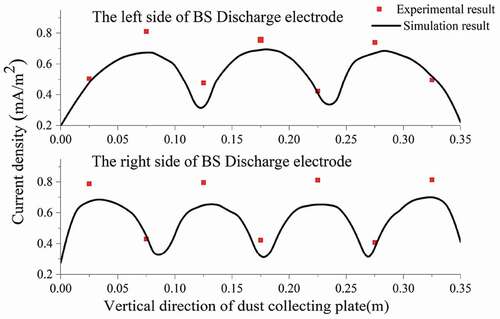
shows the current density distribution of the discharge tip on the left side (right side) of the BS barbed discharge electrode on the dust collecting plate. The current density is highest at the discharge tip, and the current density is the smallest between the two discharge tips. Due to the effect of electrostatic shielding, the current density at the middle position is suppressed and is significantly lower than the current density at the outermost position. It can be found from that there is a certain error between the experimental results and the simulation results, which may be caused by the incomplete correspondence between the measured copper sheet and the barbed discharge electrode, but it can still be seen that the simulation results are consistent with the experimental results, which verified the accuracy of the simulation model.
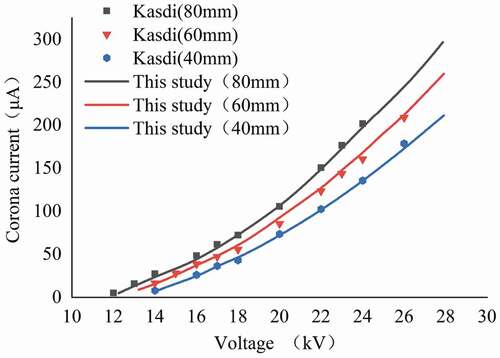
In addition, as shown in , this study further verified the relationship between corona current (I) and applied voltage (kV) by comparing with the experimental results obtained by Kasdi (Citation2016). The results show that there is a good agreement between the simulated value of this model and the experimental measured value of Kasdi (Citation2016). The model also accurately predicts the change of the corona current when the wire-to-wire distance changes. It can be seen from that the corona current increases with the increase of the wire-to-wire distance. Due to the effect of electrostatic shielding, the reduction of the wire-to-wire distance will cause the corona current to decrease.
Figure 6. Comparison between this study and Kasdi V–I characteristic experiment.
Finally, as shown in , the current density distribution on the surface of the dust collector obtained by the numerical simulation of this study is compared with the experimental measurement value of Kasdi (Citation2016).
Figure 7. Comparison between this study and Kasdi current density experiment.
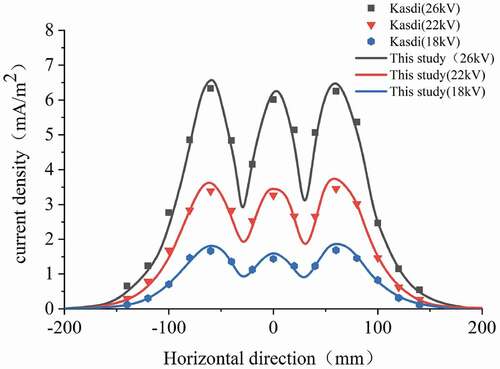
It can be clearly seen from that the current density reaches the maximum value at the outermost discharge electrode and the minimum value between adjacent discharge electrodes. In addition, due to the effect of electrostatic shielding, the current density of the intermediate discharge electrode is obviously suppressed, and the simulation results accurately predict the existence of electrostatic shielding. The suppression of corona current due to the interaction between the electric fields generated by adjacent discharge electrodes (electrostatic shielding) has been mentioned by other researchers (Abdel-Salam and Eid Citation2002; Al-Hamouz, El-Hamouz, and Abuzaid Citation2011).
In summary, it can be clearly seen from the previous comparison that the simulation results of the current numerical model are highly consistent with the previous experimental measurement results. Therefore, the numerical model used in this research lays a good foundation for the following systematic research of the electrostatic shielding effect of ESP.
Analysis of electrostatic shielding
Electrostatic shielding is an important physical phenomenon in ESP. In order to further study this phenomenon, this section conducts research on voltage, wire-to-wire distance, wire-to-plate distance, discharge electrode radius and number of discharge electrodes, and quantifies the influence of various factors on electrostatic shielding.
The influence of voltage on electrostatic shielding
The applied voltage is set to 30kV, 40 kV and 50 kV, while keeping the wire-to-wire distance (0.1 m) and wire-to-plate distance (0.05 m) unchanged, the discharge electrode radius is set to 1 mm, 3 discharge electrodes are used, and analyze the influence of voltage on electrostatic shielding.
It can be seen from that as the applied voltage increases, the charge density value at the discharge electrode increases significantly. To further explain this phenomenon, extract the space charge density distribution on the surface of the dust collector, as shown in , the space charge density values at the first and third discharge electrodes are slightly larger than the value at the second discharge electrode.
Figure 8. Cloud map of space charge density distribution (voltage).
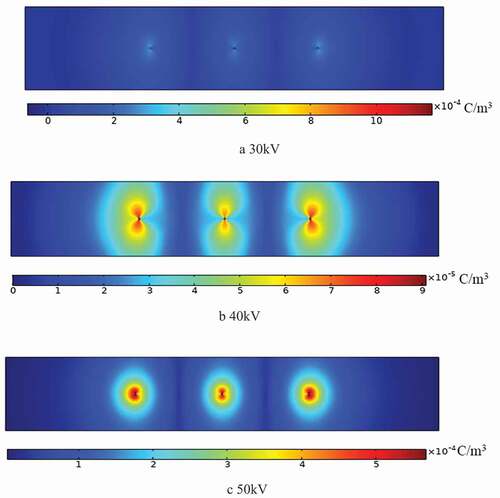
Figure 9. Space charge density distribution curve under different voltages.
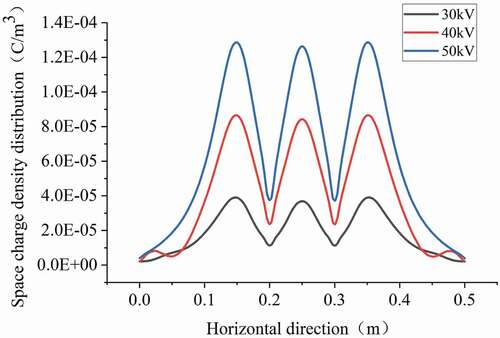
It can be seen from that under different voltages, the difference of the electrostatic shielding degree (the ratio of the space charge density of the outer discharge electrode to the inner discharge electrode) is small, and as the voltage increases, the electrostatic shielding degree decreases. This shows that in the low voltage range, the electrostatic shield is stronger, and in the high voltage range, the electrostatic shield is weak.
Table 4. Electrostatic shielding degree under different voltages
The effect of the wire-to-wire distance on electrostatic shielding
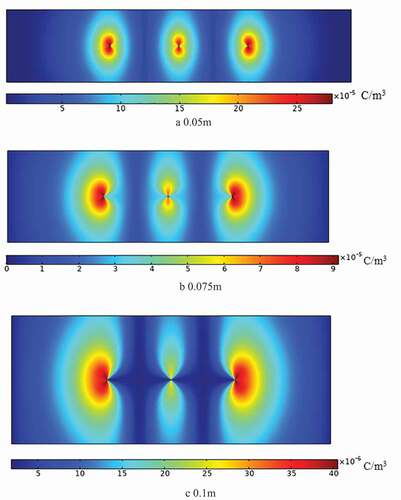
In order to study the influence of the wire-to-wire distance on the electrostatic shielding, ESP with the wire-to-wire distance of 0.05 m, 0.075 m and 0.1 m was simulated, keeping the wire-to-plate distance at 0.05 m, the number of discharge electrodes is 3, the discharge electrode radius is 1 mm, and the applied voltage is constant at 40kV.
It can be clearly seen from that when the wire-to-wire distance increases from 0.05 m to 0.075 m, and finally to 0.1 m, the charge density value at the discharge electrode increases significantly.
Figure 10. Cloud map of space charge density distribution (wire-to-wire distance).
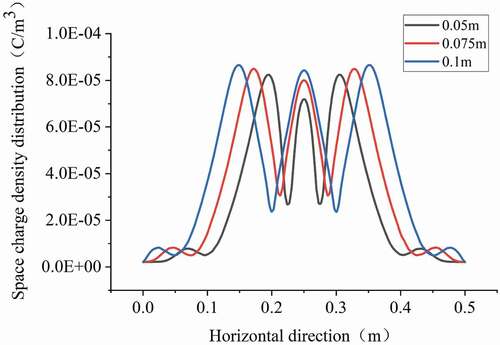
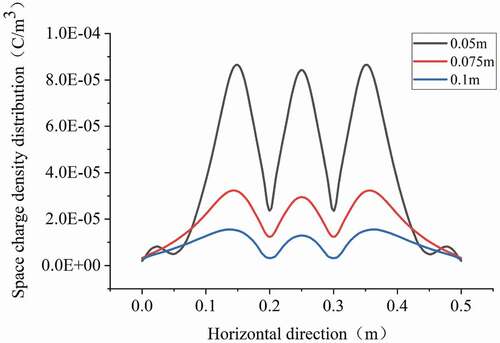
Through the study of the space charge density on the surface of the dust collector, as shown in and , the wire-to-wire distance has a significant effect on electrostatic shielding, and as the wire-to-wire distance increases, the degree of electrostatic shielding decreases, in other words, within a certain range, the smaller the distance between the discharge electrodes, the more significant the electrostatic shielding effect.
Table 5. Electrostatic shielding degree under three wire-to-wire distances
Figure 11. The distribution curve of space charge density under three wire-to-wire distances.
The influence of the wire-to-plate distance on electrostatic shielding
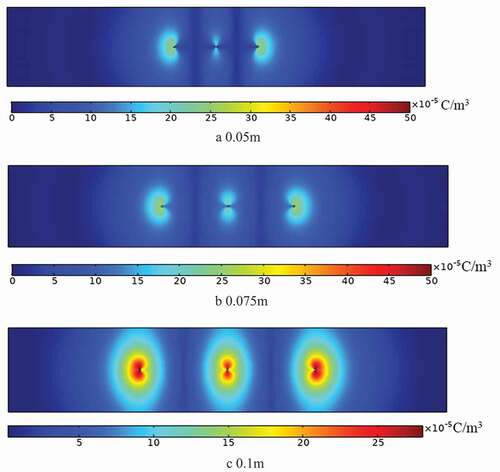
Using a constant wire-to-wire distance of 0.1 m, applied voltage of 40kV, discharge electrode of 1 mm and three discharge electrodes, the effect of the wire-to-plate distance on electrostatic shielding was studied. The simulation simulates the space charge density when the wire-to-wire distance is 0.05 m, 0.075 m and 0.1 m. As shown in , when the wire-to-wire distance increases from 0.05 m to 0.1 m, and the charge density value at the discharge electrode increases greatly.
Figure 12. Cloud map of space charge density distribution (wire-to-plate distance).
From and , it can be seen that with the increase of the wire-to-plate distance, the space charge density value caused by corona discharge is significantly suppressed at the middle discharge electrode. In other words, compared with the outer discharge electrode, on the surface of the middle discharge electrode, when the electric field strength calculated by the Peek formula is reached, the required space charge density is significantly reduced, and the degree of electrostatic shielding increases with the increase of the wire-to-plate distance.
Table 6. Electrostatic shielding degree under three wire-to-plate distances
Figure 13. Space charge density distribution curve under three wire-to-plate distances.
The influence of discharge electrode radius on electrostatic shielding
In order to study the influence of discharge electrode radius on electrostatic shielding, ESP with discharge electrode radius of 1 mm, 1.5 mm and 2 mm was simulated, keeping the wire-to-wire distance (0.1 m) and wire-to-plate distance (0.05 m) unchanged, the number of discharge electrodes is 3, and the applied voltage is set to a constant 40kV.
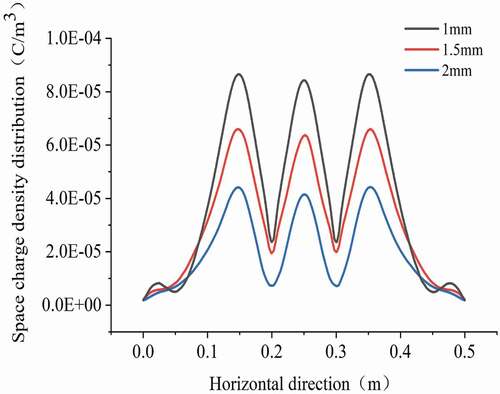
Through the analysis of , it can be seen that the discharge electrode radius increases from 1 mm to 2 mm, the charge density value at the discharge electrode decreases, and the electrostatic shielding degree is different under different discharge electrode radius. It can be seen from that with the increase of the discharge electrode radius, the suppression of the middle discharge electrode becomes more obvious. When the discharge electrode radius is 2 mm, the electrostatic shielding degree is the greatest.
Table 7. Electrostatic shielding degree under different discharge electrode radius
Figure 14. Cloud map of space charge density distribution (discharge electrode radius).
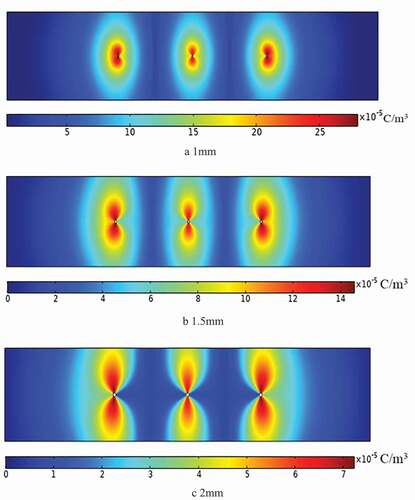
Figure 15. Space charge density distribution curve under different discharge electrode radius.
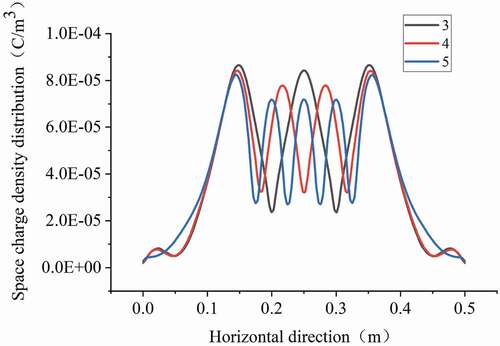
The influence of the number of discharge electrodes on electrostatic shielding
In order to study the effect of the number of discharge electrodes on the electrostatic shielding, this section sets the applied voltage to 40kV and the discharge electrode radius to 1 mm. By changing the number of discharge electrodes, the influence of the number of discharge electrodes on electrostatic shielding is studied at 0.05 m of wire-to-plate distance. In the simulation, the position of the outermost discharge electrode is fixed. Since the length of ESP dust collecting plate is also fixed (), increasing the number of discharge electrodes in ESP means reducing the wire-to-wire distance.
The space charge distribution cloud diagram and the space charge density distribution curve given in show that the increase of the number of discharge electrodes has little effect on the charge density value at the outermost discharge electrode, but has a greater impact on the middle discharge electrode. The degree of electrostatic shielding increases with the increase of the number of discharge electrodes. As shown in , it can be seen from section 2.2.3 that the degree of electrostatic shielding decreases with the decrease of the wire-to-plate distance. Therefore, in order to avoid the influence of electrostatic shielding, when increasing the number of discharge electrodes, the value of the wire-to-plate distance must be considered.
Table 8. Electrostatic shielding degree under different number of discharge electrodes
Figure 16. Cloud map of space charge density distribution (number of discharge electrodes).
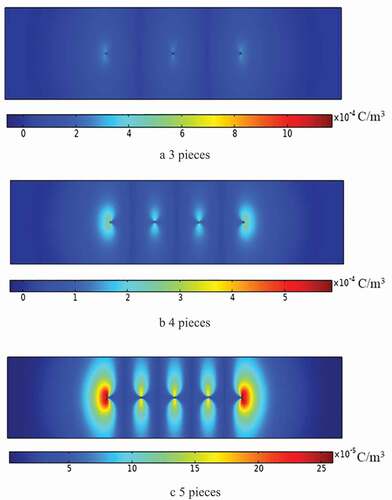
Figure 17. Space charge density distribution curve under different number of discharge electrodes.
Analysis of orthogonal test
Through the analysis of the numerical simulation results in Section 3.2, the influence of voltage, wire-to-wire distance, wire-to-plate distance, discharge electrode radius and number of discharge electrodes on electrostatic shielding of ESP is obtained. Since the change of the number of discharge electrodes is the change of the wire-to-wire distance, this section selects four factors of voltage, wire-to-wire distance, wire-to-plate distance and discharge electrode radius to design an orthogonal test table. The orthogonal test is three levels and four factors, without considering the interaction between the factors, L9 (34) is selected as shown in .
Table 9. The level table that affects the degree of electrostatic shielding
Through analyzing the ratio of the space charge density of the outer discharge electrode and the inner discharge electrode under nine working conditions, the degree of electrostatic shielding can be evaluated. As shown in , the orthogonal test results show that the factors that affect electrostatic shielding from large to small are as follows: wire-to-plate distance, discharge electrode radius, voltage and wire-to-wire distance.
Table 10. Orthogonal test analysis
The effect of electrostatic shielding on particle charging and dust removal efficiency
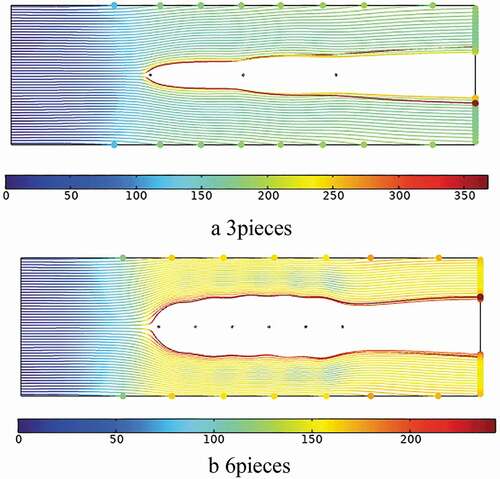
Electrostatic shielding will have a greater impact on particle charging and dust removal efficiency. This section uses the previous simulation method to simulate particle charging and dust removal efficiency (Arif, Branken, and Everson Citation2018). Set the applied voltage to 40kV and the particle size of 1 μm, the number of discharge electrodes of ESP increased from three to six. It can be clearly seen from ) that as the number of discharge electrodes increases, the degree of shielding in ESP channel is significantly improved. From the point of view of particle charge, the charge of particles in a is more, and the charge of particles in b is less, which shows that electrostatic shielding is not conducive to the charge of particles. Setting 1000 particles in the simulation model, the dust removal efficiency can be obtained by dividing the number of particles captured by the dust collection plate by the total number from the simulation results. From the perspective of dust removal efficiency, the dust removal efficiency (32%) in Figure a is higher than that in b (28%). The simulation results well illustrate that the electrostatic shielding caused by the increase of the number of discharge electrodes (the decrease of the wire-to-wire distance) causes the reduction of dust removal efficiency.
Figure 18. Particle charging and dust removal efficiency under different number of discharge electrodes.
In order to further explain this phenomenon, the relationship between the number of discharge electrodes and the dust removal efficiency under different voltages is obtained, as shown in . It can be clearly seen from the figure that by increasing the number of discharge electrodes to improve the dust removal efficiency of ESP, this is only feasible within a certain range. After further increasing the number of discharge electrodes (decrease of the wire-to-wire distance), a significant reduction in dust removal efficiency was observed. According to the previous discussion, the reduction of dust removal efficiency is attributed to the increase of the degree of electrostatic shielding.
Figure 19. The relationship between the number of electrodes at different voltages and the dust removal efficiency.
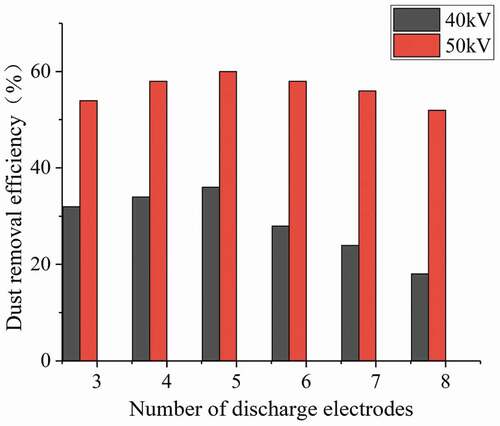
It can be seen from the results of dust removal efficiency in that the number of discharge electrodes is 5 as the threshold. At this time, the dust removal efficiency of ESP is the highest. If the number of discharge electrodes is less than 5 or more than 5, the dust removal efficiency will be reduced. When the number of discharge electrodes increases from 5 to 6, the higher applied voltage can partially offset the negative impact of electrostatic shielding on the dust removal efficiency. Although under these two applied voltages, electrostatic shielding still exists, the relative degree of electrostatic shielding will not change greatly with the increase of applied voltage. Therefore, increasing the applied voltage will reduce the electrostatic shielding and increase the particle charge. It plays an important role in improving dust removal efficiency.
Conclusion
This paper systematically analyzes the influencing factors of electrostatic shielding through numerical simulation technology, quantifies the degree of influence of each factor on electrostatic shielding, and analyzes the effect of electrostatic shielding on the performance of ESP, and the following conclusions are obtained..
(1) By analyzing the distribution of space charge density, the influence of voltage, wire-to-wire distance, wire-to-plate distance, discharge electrode radius and the number of discharge electrodes on electrostatic shielding is obtained. The degree of electrostatic shielding decreases with the increase of the voltage and the wire-to-wire distance, while the increase of the wire-to-plate distance, the increase of the discharge electrode radius and the increase of the number of discharge electrodes will increase the degree of electrostatic shielding.
(2) The numerical model in this paper is in good agreement with the previous experimental measurement results. This model is used to quantify the degree of influence of various factors on electrostatic shielding. Through orthogonal test analysis, the significance ranking of each factor on electrostatic shielding from large to small is obtained: wire-to-plate distance, discharge electrode radius, voltage and wire-to-wire distance.
(3) It is only feasible within a certain range to increase the dust removal efficiency of ESP by increasing the number of discharge electrodes. When the number of discharge electrodes increases beyond a certain threshold, the dust removal efficiency of ESP will be significantly reduced due to the effect of electrostatic shielding. Therefore, when increasing the number of discharge electrodes, the value of the wire-to-plate distance must be fully considered, and the wire-to-plate distance must be appropriately reduce.d
Nomenclature
| = | Electric field intensity [V/m] | |
| = | Space charge density [C/m3] | |
| = | Vacuum dielectric constant [F/m] | |
| = | Current density [A/m2] | |
| = | Ion mobility [m2/ (V·s)] | |
| = | Diffusion coefficient [m2/s] | |
| = | Corona initiation electric field intensity [V/m] | |
| = | Discharge electrode radius [cm] | |
| = | Identity matrix | |
| = | Airflow velocity [m/s] | |
| = | Pressure [Pa] | |
| = | Airflow density [kg/m3] | |
| = | Turbulent kinetic energy [m2/s2] | |
| = | Volume force | |
| = | Specific dissipation rate [s−1] | |
| = | Viscosity coefficient [Pa·s] | |
| = | Particle saturation charge [C] | |
| = | The amount of charge a particle reaches somewhere [C] | |
| = | Relative permittivity [F/m] | |
| = | Boltzmann constant [J/K] | |
| = | Particle diameter [μm] | |
| = | Time constant of particle charging | |
| = | Temperature [K] | |
| = | Space charge density per unit area [C/m3] |
Disclosure statement
No potential conflict of interest was reported by the author(s).
Data availability statement
Available on request (https://doi.org/ 10.1080/10962247.2021.2017374).
Additional information
Funding
Notes on contributors
Bing Chen
Bing Chen received Ph.D. degree in Beijing Institute of Technology (BIT) in 2005, Beijing, People’s Republic of China. Now he works in University of Science and Technology Beijing (USTB) as an associate professor and supervisor of master graduate students, he is also the Associate Chair of the Department of Mechanical Equipment and Control Engineering. His current research interests include Air pollutant control, electrostatic precipitation technology and simulation.
Shiqing Li
Shiqing Li is a student of Beijing University of Science and Technology.
Yongheng Guo
Yongheng Guo is a student of Beijing University of Science and Technology.
Hongjiao Li
Hongjiao Li is a student of Beijing University of Science and Technology.
Wenning Zhou
Wenning Zhou is a teacher at Beijing University of Science and Technology.
Baiqian Liu
Baiqian Liu is a teacher at Beijing University of Science and Technology.
References
- Abdel-Salam, M., and A. Eid. 2002. Finite element simulation of Corona in wire-duct precipitators. C. Indus. Appl. Conf. IEEE 2:383–1389. doi:https://doi.org/10.1109/ias.2002.1042737.
- Al-Hamouz, Z., A. El-Hamouz, and N. Abuzaid. 2011. Simulation and experimental studies of Corona power loss in a dust loaded wire-duct electrostatic. J. Adv. Pow. Tech. 22 (6):706–14. doi:https://doi.org/10.1016/j.apt.2010.10.005.
- Al-Hamouz, Z. M. 2002. A combined algorithm based on finite elements and a modified method of characteristics for the analysis of the Corona in wire-duct electrostatic precipitators. J. IEEE. Trans. Ind. Appl. 38 (1):43–49. doi:https://doi.org/10.1109/28.980343.
- Anagnostopoulos, J., and G. Bergeles. 2002. Corona discharge simulation in wire-duct electrostatic precipitator. J. Electrost. 54:129–47. doi:https://doi.org/10.1016/s0304-3886(01)00172-3.
- Arif, S., D. J. Branken, and R. C. Everson. 2018. The influence of design parameters on the occurrence of shielding in multi-electrode ESPs and its effect on performance. J. Electrost. 93:17–30. doi:https://doi.org/10.1016/j.elstat.2018.03.001.
- Chen, B., Y. H. Guo, and H. J. Li. 2020. Insights into the effect of the shape of collecting plates on particle precipitation processes in electrostatic precipitator. J. Air Waste Manage. Assoc. 70 (9):892–903. doi:https://doi.org/10.1109/28.55991.
- Choi, B. S., and C. A. J. Fletcher. 1997. Computation of particle transport in an electrostatic precipitator. J. Electrost. s40-41:413–18. doi:https://doi.org/10.1016/s0304-3886(97)00080-6.
- Davis, J. L., and J. F. Hoburg. 1983. Wire-duct precipitator field and charge computation using finite element and characteristics methods. J. Electrost. 14:187–99. doi:https://doi.org/10.1016/0304-3886(83)90006-2.
- Elmoursi, A., and G. S. P. Castle. 2008. Modeling of Corona characteristics in a wire-duct precipitator using the charge simulation technique. IEEE Trans. Ind. Appl. 23:95–102. doi:https://doi.org/10.1109/tia.1987.4504872.
- He, Z. J., and E. T. MohanDass. 2018a. Correlation of design parameters with performance for electrostatic Precipitator. Part I. 3D model development and validation. J. Appl. Math. Mod. 57:633–55. doi:https://doi.org/10.1016/j.apm.2017.05.042.
- He, Z. J., and E. T. MohanDass. 2018b. Correlation of design parameters with performance for electrostatic precipitator. Part II. Design of experiment based on 3D FEM simulation. J. Appl. Math. Mod. 57:656–69. doi:https://doi.org/10.1016/j.apm.2017.06.031.
- Kasdi, A. 2016. Computation and measurement of Corona current density and V-I characteristics in wires-to-plates electrostatic precipitator. J. Electrost. 81:1–8. doi:https://doi.org/10.1016/j.elstat.2016.02.005.
- Lami, E., F. Mattachini, and R. Sala. 1997. A mathematical model of electrostatic field in wires-plate electrostatic precipitators. J. Electrost. 39:1–21. doi:https://doi.org/10.1016/s0304-3886(96)00044-7.
- Lei, H., L. Z. Wang, and Z. N. Wu. 2004. Applications of upwind and downwind schemes for calculating electrical conditions in a wire–plate electrostatic precipitator. J. Jour. Comp. Phys. 193 (2):697–707. doi:https://doi.org/10.1016/j.jcp.2003.08.016.
- Levin, P. L., and J. F. Hoburg. 1990. Donor cell-finite element descriptions of wire-duct precipitator fields, charges, and efficiencies. J. IEEE Trans. Ind. Appl. 26 (4):662–70. doi:https://doi.org/10.1109/28.55991.
- Lobry, J. 2014. A new numerical scheme for the simulation of Corona fields. J. IEEE Trans. Mag. 50 (2):541–44. doi:https://doi.org/10.1109/TMAG.2013.2281999.
- Mcdonald, J. R., W. B. Smith, and H. W. S. Iii. 1977. A mathematical model for calculating electrical conditions in wire-duct electrostatic precipitation devices. J. Jour. Appl. Phys. 48 (6):2231–43. doi:https://doi.org/10.1063/1.324034.
- Penney, G. W., and R. E. Matick. 1960. Potentials in D-C Corona fields. J. Trans. AIEE 79:91–99. doi:https://doi.org/10.1109/TCE.1960.6368550.
- Wang, F., H. Zhang, and W. C. Gao. 2021. Improving the removal of particles via electrostatic precipitator by optimizing the Corona wire arrangement. J. Pow. Tech. 388:201–11. doi:https://doi.org/10.1016/j.powtec.2021.04.087.
- Wu, D., Y. X. Yu, and J. R. Xia. 2014. Research review of haze pollution in my country. J. Environ. Sci. Technol. s2:295–304.
- Yi, C. W., T. Yin, and H. Q. Huang. 2013. Study on new laboratory scale transverse plate electrostatic precipitator collecting fly ash. C. Appl. Mech. Mater. Trans. Tech. Pub. 433-435:2260–64. doi:https://doi.org/10.4028/AMM.433-435.2260.
- Zeng, M. M., Y. X. Yu, and J. R. Xia. 2006. Numerical simulation of movement and deposition of microparticles in human upper respiratory tract. J. Jour. Zhejiang Uni. (Eng. Sci. Edi.) 07:1164–1167-1256.
- Zhao, L., and K. Adamiak. 2008. Numerical simulation of the electrohydrodynamic flow in a single wire-plate electrostatic precipitator. J. IEEE Trans. Ind. Appl. 44 (3):683–91. doi:https://doi.org/10.1109/tia.2008.921453.