
ABSTRACT
A combustion model, originally developed to simulate the destruction of chemical warfare agents, was modified to include C1-C3 fluorinated organic reactions and kinetics compiled by the National Institute of Standards and Technology (NIST). A simplified plug flow reactor version of this model was used to predict the destruction efficiency (DE) and formation of products of incomplete combustion (PICs) for three C1 and C2 per- and poly-fluorinated alkyl substances (PFAS) (CF4, CHF3, and C2F6) and compare predicted values to Fourier Transform Infrared spectroscopy (FTIR)-based measurements made from a pilot-scale EPA research combustor (40–64 kW, natural gas-fired, 20% excess air). PFAS were introduced through the flame, and at post-flame locations along a time-temperature profile allowing for simulation of direct flame and non-flame injection, and examination of the sensitivity of PFAS destruction on temperature and free radical flame chemistry. Results indicate that CF4 is particularly difficult to destroy with DEs ranging from ~60 to 95% when introduced through the flame at increasing furnace loads. Due to the presence of lower energy C-H and C-C bonds to initiate molecular dissociation reactions, CHF3 and C2F6 were easier to destroy, exhibiting DEs >99% even when introduced post-flame. However, these lower bond energies may also lead to the formation of CF2 and CF3 radicals at thermal conditions unable to fully de-fluorinate these species and formation of fluorinated PICs. DEs determined by the model agreed well with the measurements for CHF3 and C2F6 but overpredicted DEs at high temperatures and underpredicted DEs at low temperatures for CF4. However, high DEs do not necessarily mean absence of PICs, with both model predictions and limited FTIR measurements indicating the presence of similar fluorinated PICs in the combustion emissions. The FTIR was able to provide real-time emission measurements and additional model development may improve prediction of PFAS destruction and PIC formation.
Implications: The widespread use of PFAS for over 70 years has led to their presence in multiple environmental matrixes including human tissues. While the chemical and thermal stability of PFAS are related to their desirable properties, this stability means that PFAS are very slow to degrade naturally and potentially difficult to destroy completely through thermal treatment processes often used for organic waste destruction. In this applied combustion study, model PFAS compounds were introduced to a pilot-scale EPA research furnace. Real-time FTIR measurements were performed of the injected compound and trace products of incomplete combustion (PICs) at operationally relevant conditions, and the results were successfully compared to kinetic model predictions of those same PFAS destruction efficiencies and trace gas-phase PIC constituents. This study represents a significant potential enhancement in available tools to support effective management of PFAS-containing wastes.
Introduction
Per- and polyfluoroalkyl substances (PFAS) are an anthropogenic class of organic compounds valued for their hydrophobic and lipophobic properties, as well as for their chemical and thermal stability. These useful properties have led to the synthesis of thousands of PFAS for use in military, industrial, and consumer applications and products (Lemal Citation2004; Okazoe Citation2009). This widespread use has led to the presence of residual PFAS in multiple environmental matrices including air, soil, drinking water, groundwater, remediation media, animals, plants, and humans (Sunderland et al. Citation2019). Toxicology studies are limited, but several PFAS show toxic effects in animals and people (Cordner et al. Citation2019). To protect human health and the environment, governments and industry have prioritized limitations on their release into the environment and the development and testing of methods to measure PFAS.
Some PFAS-laden waste streams are treated thermally within oxidizers, combustors, and incinerators designed for the purpose of organic waste destruction. These include manufacturing process wastes, aqueous film forming foams (AFFFs), industrial and municipal solid wastes, spent activated carbons and anionic exchange resins from water treatment processes, contaminated soils, and sewage sludges. Incineration has been used as a method of destroying related halogenated organic chemicals, including refrigerants and ozone depleting substances (ODSs). High temperatures and long residence times break the carbon-halogen bonds after which the halogen can be scrubbed from the flue gas, typically as an alkali-halogen salt (Oppelt Citation1987). However, incineration of PFAS (including fluorinated refrigerants) pose a unique challenge as the C-F bond is at least 50% stronger than those of other carbon-halogen bonds (O’Hagan Citation2008). The stability of fluorinated compounds makes them difficult to destroy and useful as fire retardants. Fluorine’s electronegativity, reactivity, and ability to terminate flame-sustaining free radical chain reactions creates concerns about PFAS and fluorinated products of incomplete combustion (PICs) being emitted from thermal oxidizers, combustors, and incinerators. These emissions have only been minimally addressed by scientific research.
Thermal decomposition of halogenated organic compounds occurs via unimolecular decomposition and bimolecular reactions, often with flame radicals. Unimolecular decomposition occurs at high temperatures, and fluorinated organic compounds require higher temperatures to achieve 99.99% destruction in 1 second gas-phase residence time than do their chlorinated counterparts. Based on calculated bond energies, the most difficult fluorinated organic compound to decompose is carbon tetrafluoride (CF4), requiring temperatures over 1400°C to achieve 99.99% destruction efficiency (DE) in 1 second gas-phase residence time (Tsang, Burgess, and Babushok Citation1998). The stability is due to the presence of four C-F bonds and additional electrostatic nature of the bonds caused by partial positive charge on the carbon created by the electronegative fluorine atoms (O’Hagan Citation2008). Unimolecular decomposition of highly fluorinated organics may proceed with C-C bond breakage and subsequent cleavage of the C-F bonds. The presence of C-C or C-H bonds (as in hexafluoroethane (C2F6) or trifluoromethane (CHF3)) provides a weak point in the structure and results in significantly lower decomposition temperatures for those molecules compared to CF4 (Tsang, Burgess, and Babushok Citation1998).
Fluorinated organic compounds can also be destroyed in flames by free radical initiation, propagation, and branching mechanisms. While hydroxyl (OH) radical reaction with hydrocarbons is a common combustion flame propagating mechanism, the strength of the C-F bond makes this pathway unlikely. Atomic hydrogen, formed at high temperatures from hydrocarbon fuels, is likely the radical reacting with the carbon-bonded fluorine (Tsang, Burgess, and Babushok Citation1998). The high electronegativity of fluorine creates unstable radicals that, if formed, quickly react with other radical species, preventing flame-free radical propagation and branching processes. For this reason, it is likely important to provide high concentrations of H radicals (as is present in flames) to promote hydrofluoric acid (HF) formation and inhibit PIC formation.
The effectiveness of incineration to destroy PFAS compounds and the propensity for the formation of fluorinated or mixed halogenated organic byproducts are not well understood. Few systematic experiments have been conducted under oxidative and temperature conditions representative of field-scale incineration. Limited studies on the thermal destructibility of fluoropolymers found no detectable levels of perfluorooctanoic acid after 2 sec residence time and 1000°C (Taylor et al. Citation2014; Yamada et al. Citation2005), but significant production of one to three carbon long fluorocarbons has been observed (García, Viciano, and Font Citation2007). Also, the functional groups present on many PFAS can be removed at low temperatures, allowing the fluorinated backbone to react with other species and complicating the determination of destruction and removal efficiencies (DREs) and the identification of relevant PICs (Krusic, Marchione, and Roe Citation2005; Krusic and Roe Citation2004). Emission studies, particularly for PICs, have been incomplete due to the lack of rigorous sampling and measurement methods, and analytical standards for fluorinated and mixed halogenated organic compounds. Most recent flame studies of PFAS such as small hydrofluorocarbons (Takahashi et al. Citation2019, Citation2020) and perfluorinated sulfonic acids (Altarawneh and Chemical Kinetic Citation2021) including experimental and modeling work suggest destruction of these compounds occurs through complex reaction pathways driven by the unique fluorine flame chemistry resulting in significant potential for PIC formation.
This initial PFAS destruction study uses experimental data from an Environmental Protection Agency (EPA) 80 kW (rated) refractory-lined research combustor, aka “the Rainbow furnace,” coupled with modeling. The modeling, developed by Reaction Engineering International (REI), consists of a computational fluid dynamics (CFD) combustion model to calculate mean temperature and flow fields and a post-processor that uses these calculated flow fields to create streamlines along which detailed kinetic calculations can be performed to calculate various species concentrations. The objectives of this paper are to describe the modeling and experimental approaches and present comparisons of initial predictions for a simplified plug flow reactor (PFR) model with experimental results including DEs and PIC concentrations as a function of PFAS, injection location, and temperature. Experiments are focusing on the injection of three fluorinated refrigerants including CF4 (R-14), CHF3 (R-23), and C2F6 (R-116) with the natural gas and combustion air (through the flame), and at several axial post-flame locations. CF4, CHF3, and C2F6 were chosen for this study because they are three commonly available relatively nontoxic gas-phase PFAS compounds with varying degrees of thermal stability. Real-time Fourier Transform Infrared spectroscopy (FTIR) measurements of extracted flue gas samples made continuously at a fixed downstream location, are used to determine DEs and characterize a limited set of PICs. Additionally, detailed chemical kinetics for these C1 and C2 PFAS are already available in the literature, allowing comparison of experimental results with model predictions. Note that multiple definitions of what constitutes a PFAS exist. Buck et al. (Citation2011) defines PFAS (perfluoroalkyl and polyfluoroalkyl substances) as highly fluorinated compounds that contain 1 or more C atoms on which all of the H substituents have been replaced by F atoms in such a manner that they contain the perfluoroalkyl moiety CnF2n+1. When n = 1, this moiety is -CF3. Other definitions require multiple carbons or that the moiety not contain H, Cl, Br, or I. As defined by Organization for Economic Co-operation and Development (OECD, Citation2018), any chemical with at least a perfluorinated methyl group (-CF3) or a perfluorinated methylene group (-CF2-) is a PFAS. Regardless of the evolving definition, as defined here, CH4 and CH3 are an alkane and an alkyl group, respectively. Therefore, CF4, CHF3, and C2F6 are all considered PFAS.
Model description
CFD modeling of a combustion environment involves discretizing the combustor volume into thousands of smaller volumes and solving sets of Navier–Stokes (NS) equations, with appropriate boundary conditions, for the mass, momentum, and energy balances of reacting species flowing in and out of each sectional volume. Flows are often turbulent, and variable grid sizes are used to capture smaller length scales within and close to the flame. REI’s Configured Fireside Simulator (CFS) is a CFD model with reactive flow (Lemieux et al. Citation2021). The model solves material and energy balances of turbulent reacting gases in a combustion environment. The model includes the full coupling of turbulent fluid mechanics, all modes of heat transfer (including radiation) and equilibrium combustion chemistry for the fuel coupled with an assumed probability density function to capture intermittency in the turbulent flow field. This CFD model allows the construction of streamlines along which the Lagrangian time/temperature history of the fluid have been determined. The temporal evolution along a streamline, of non-equilibrium concentrations of major, minor, and intermediate species, including PFAS, can then be calculated using a (modified) plug flow detailed kinetics program. The detailed kinetic mechanism can contain hundreds, if not thousands of elementary reactions. For this work, the CFD program is built around REI’s in-house code, GLACIER, which solves the system of equations to determine temperatures and species concentrations initially using a base (natural gas-air only) kinetics set for a given combustion environment. This establishes base fluid trajectories with their Lagrangian time/temperature histories, and these then form the kinetic environment for the detailed kinetics post-processor.
The CFS model previously developed by REI is currently being extended to the EPA Rainbow furnace. The existing overall framework of the CFS has in the past developed from the need to capture the periodic loading of materials into incinerators resulting in an inherently time-dependent operation that must be adequately captured in the model. Modeling the operation with a true transient CFD simulation would require excessive computing resources. To represent the time-dependent nature of the furnaces in a computationally efficient manner, they are modeled using a combination of a transient “zonal” model and a steady-state CFD model.
The transient zonal model captures the transient effect of solid waste material combustion on the furnace temperature, overall gas composition and heat-up of the materials being processed. The conditions predicted by the transient zonal model are subsequently used to define the boundary conditions used by the steady-state three-dimensional (3D) CFD model that computes the local mixing and combustion for a prescribed instant in time. GLACIER has a long history of development for modeling 3D reacting two-phase flow of gases and particles or droplets in complex geometries. This CFD model originally implemented into the CFS for the Army demilitarization program, includes the physics required to analyze the incinerator units and subsequent secondary combustion chambers. The CFD model is run assuming a quasi-steady-state solution where the boundary conditions are taken from the transient zonal model results at a user defined specific point in time. Waste destruction and PIC formation are determined by the time, temperature, and species history over multiple streamlines from the CFD calculations. The assumption is that the generally low concentrations of waste-related species of interest are insufficient to greatly affect the temperature and velocity profiles established during the base calculations. The result is a predictive model that can be solved in tens of minutes on a personal computer (PC). This approach also allows timely execution and comparison of multiple scenarios. Elementary reactions are included in large data sets with accompanying thermodynamic and kinetic rate constants in Chemkin format (Kee, Rupley, and Miller Citation1989).
The CFS was originally developed for the Department of Defense (DoD) to examine incineration of several chemical warfare (CW) agents (GB [Sarin], HD [Sulfur Mustard], and VX) at the chemical demilitarization incinerators located at the Tooele Army Depot in Utah (Denison et al. Citation2002). Kinetic sets were developed for these CW agents by Lawrence Livermore National Laboratories and elsewhere. As part of weapons decommissioning, explosive components are removed, and liquid CW agents drained and incinerated in separate furnaces. The remaining contaminated metal components are then conveyed into the Metal Parts Furnace, which destroys any residual agent before the metal can be disposed as scrap. More recently, the EPA’s Homeland Security Research Program (HSRP) has extended these efforts to include four additional combustion environments (a commercial rotary kiln incinerator, a reciprocating grate stoker boiler, a starved air medical/pathological incinerator, and a small pilot-scale rotary kiln incinerator simulator located at EPA’s research facilities in Research Triangle Park, NC) (Lemieux et al. Citation2021). HSRP was particularly interested in determining if GB, HD, and VX contaminated materials (soils, biomass, building materials, etc.) could be adequately processed in a variety of incineration and combustion systems (varying time/temperature profiles) in the event of a terrorist incident, to aid permitting authorities to make decisions in the absence of full-scale test data and to help guide waste packaging operations to optimize incinerator feeding processes. An important feature of the CFS as applied to both the Metal Parts Furnace and HSRP needs, is the ability to simulate the release of waste species from the solid phase at varying locations and temperatures within the incinerator/combustor. While this transient feature is also important to describe PFAS and fluoropolymer release from solid wastes in certain incineration situations, initial modeling efforts, described here, focus on PFAS introduced to the furnace continuously as a gas. Although GB (Sarin) contains fluorine, inspection of the fluorine chemistry in the Sarin mechanism includes only one unimolecular decomposition reaction of a phosphorous-oxygen-fluorine (POF) intermediate. Fluorocarbon chemistry, in the form of a detailed fluorine thermodynamic and kinetic data set, needed to be added to make the CFS applicable to PFAS combustion. However, given the availability or development of an adequate set of fluorocarbon reaction kinetics, prior efforts by DoD and EPA HSRP, already provide a working platform to solve equations describing the fluid dynamics for three practical incinerator designs. It is recognized that predicting the formation of PICs is limited by the complexity of the chemistry included in the model. That is, if only C1 and C2 chemistry is included, the formation of C3 PICs cannot be predicted. Furthermore, mixed fluoro-chloro-organic species cannot be predicted unless all relevant chlorinated and mixed element reactions are included.
Fluorocarbon kinetics
In the early 1990s, the National Institute of Standards and Technology (NIST) launched an effort to identify potential replacements for Halon 1301 (CF3Br) for the U.S. Army, Navy, Air Force, and Federal Aviation Administration. While Halon 1301 is an extremely effective flame inhibiting agent, it was also identified as a potent ozone depleting substance (ODS). The NIST research included both experimental and modeling components, with the major objective of the modeling “to develop a chemical mechanism based on elementary reactions steps for their destruction, their participation in and influence on hydrocarbon flame chemistry, as well as for prediction of potential by-products of incomplete combustion.” Results of these kinetic mechanism studies are available in numerous publications (Babushok et al. Citation1994, Citation1995; Grosshandler et al. Citation1994, Citation1995; Daniel et al. Citation1994; Linteris and Truett Citation1995; Westmoreland et al. Citation1993, Citation1994) and summarized in a seminal review paper (Burgess et al. Citation1996). Interestingly, the four candidate compounds specifically being considered as replacements for Halon 1301, CH2F2, CF3-CH2F, CF3-CHF2, and CF3-CF3, all meet the definition of PFAS. Hexafluoroethane is also one of the three species examined here. The NIST authors reasoned that when these species decompose in flames, they generate a pool of fluorinated hydrocarbon stable species and radicals and the formation of many other fluoromethanes and fluoroethanes. To capture the behavior of the candidate replacement compounds, they needed to adequately describe the chemistry of all the intermediates and products that are created.
A likely (lowest energy) decomposition pathway for CF3-CF3, for example, is disassociation of the C-C bond to form two CF3 radicals. These may then react with methyl radicals (CH3), present in hydrocarbon flames, to form fluoroethanes and fluoroethylenes (plus HF). These species then undergo additional reactions. The NIST authors constructed a large comprehensive reaction set for fluorinated hydrocarbon chemistry including stable and radical hydrocarbon and fluorocarbon species and partially oxidized fluorinated hydrocarbons. The authors then compiled and extracted thermodynamic and kinetic data from the literature. Almost 700 related references are cited by their review. When empirical data were unavailable, the authors used ab initio calculations (both from the literature and performed in-house) to estimate parameters. For the review, they limited this chemistry to C1 and C2 species. The C1 chemistry included 15 species and approximately 150 reactions, and the C2 chemistry added 34 species and approximately 450 reactions. Since publication of the review paper in 1996, the NIST group has continued to maintain and expand the fluorocarbon kinetic mechanism. Their studies have expanded from substitutes for Halon 1301 to examining the stability and flame safety of new generation fluorinated refrigerants (Babushok et al. Citation2020). The latest NIST fluorocarbon reaction set obtained from Drs. Donald Burgess and Gregory Linteris in the spring of 2020 contains 105 species and 1001 elementary reactions, including a limited set of C3 fluorocarbon reactions. We hypothesize that PFAS destruction mechanisms are analogous to those for fluorine-based fire retardants and refrigerants and include initial dissociation of C-C bonds to form CF3 and CF2 radicals followed by additional defluorination or recombination reactions.
Experimental approach
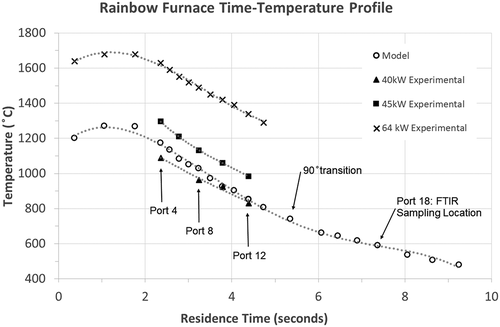
Experiments were performed using the Rainbow furnace (). This research combustor was designed to simulate the time-temperature and mixing characteristics of practical industrial liquid waste incineration systems. The Rainbow furnace is a single burner combustor and did not incorporate an afterburner as part of this study. All measurements reported were collected by a probe through Port 18 () before the effluent enters a facility air pollution control system (APCS). Thus, since particulate and acid gas controls are not included, we report DEs rather than DREs. For these experiments, natural gas and combustion air were introduced into the combustor separately through an International Flame Research Foundation (IFRF) moveable-block variable air swirl burner. This burner incorporates an interchangeable fuel injector positioned along its center axis. Swirling air passes through the annulus around the fuel injector promoting flame stability and attachment to the refractory quarl. The movable block design allows the aerodynamic flows from the burner to be precisely defined for subsequent CFD simulations (Fudihara, Glodstein, and Mori Citation2003). Excess air was maintained at 20% (stoichiometric ratio, SR = 1.2), and burner swirl was set at 4, midway on the 0–8 scale. Natural gas and combustion air were measured with two mass flow meters (Kurz Instruments Inc., models 504 FT-12 and 504 FT-32, respectively, Monterey, CA). The natural gas flow was controlled by a mass flow controller (Alicat model MCRW, Tucson, AZ) and the combustion air adjusted manually using a variable frequency drive to control the speed of the blower. Furnace load (fuel consumption) was used to vary peak furnace temperatures. A furnace load of 64 kW was initially used, but quickly reduced to 40 and 45 kW. At 64 kW, peak bulk gas temperatures measured ~46 cm from the burner exceed 1400°C (~2560 °F), and post-flame, gas temperatures of over 1000°C (>1800 °F) are maintained for ~3 sec (Yoo et al. Citation2005). These conditions were deemed too aggressive for reasonable comparison to different commercial incinerators. Commercial hazardous waste incinerators (HWIs), in comparison, are typically required to maintain gas-phase temperatures between 980–1200°C (1800–2200 °F) for a minimum of 2 sec. presents the temperature profile vs. calculated residence time for the Rainbow furnace at 45 kW (open circles). Note that the peak bulk gas temperature of ~1270°C is more typical of HWIs. Another advantage of reducing the furnace load, is that it reduced post-flame temperatures along the axial length of the furnace, allowing investigation of PFAS destruction at lower injection temperatures away from the flame. At 45 kW and SR = 1.2, natural gas and air flow rates are 72 and 828 L/min, respectively. Natural gas combustion (assuming CH4) is equimolar, and a slight induced draft (~0.5 cm H2O) was maintained within the combustor. Temperature measurements were performed at 45 kW load using a suction pyrometer with a ceramic shielded thermocouple (Omega, model Type R, Norwalk, CT) located at the furnace centerline and used as the model temperature profile (see ). A residence time profile was calculated using input flow rates, discretizing the Rainbow furnace volume between ports, and calculating temperature-corrected volumetric flow rates and residence times for each section. Incremental residence times were then summed along the length of the furnace. Note that suction pyrometer-based temperature profiles, residence times, and model calculations were performed at 45 kW (20% excess air). However, ceramic shielded non-suction pyrometer thermocouple (Omega, model Type R, Norwalk, CT) temperature measurements were also performed at 40, 45, and 64 kW (20% excess air) during PFAS experiments and are included in . A combination of FTIR (MKS Instruments Inc., model 2030, Andover, MA) and a continuous emission monitor (CEM, California Analytical, model ZRE Analyzer, Orange, CA) measured furnace exhaust concentrations of oxygen (O2), carbon monoxide (CO), and carbon dioxide (CO2). These measurements are intended to verify combustion conditions and quantify small amounts of air leakage caused by the facility’s induced draft blower. Further details regarding the experimental combustor can be found elsewhere (Linak et al. Citation2004; Linak, Srivastava, and Wendt Citation1994; Yoo et al. Citation2005).
Figure 1. EPA’s pilot-scale “Rainbow” research furnace with temperature and calculated residence time profiles at 45 kW natural gas, 20% excess air used for model conditions. FTIR samples were collected at Port 18. Note the 1 m length scale. The Air Pollution Control System (APCS) consists of a facility afterburner, temperature quench, baghouse, and NaOH wet scrubber.
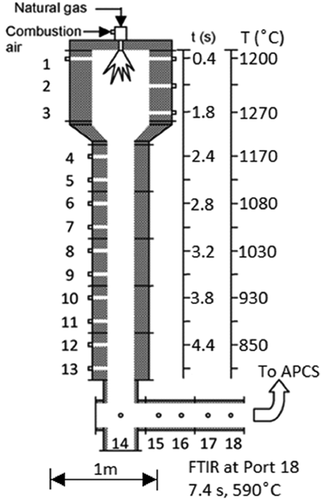
Figure 2. Temperature profile vs. calculated residence time for the Rainbow furnace at 20% excess air. Residence times correspond to the measured temperature profile used for the model (45 kW load) and the 64 kW experiment. These temperatures were obtained by suction pyrometer. Temperatures for the 40 and 45 kW experiments (solid symbols) are from bare thermocouple furnace centerline measurements taken immediately before PFAS injection at corresponding model port locations.
PFAS destruction experiments were conducted by introduction of CF4, CHF3, or C2F6, using a mass flow controller (Sierra Instruments, model Smart Trak C100-L, Monterey, CA). The PFAS compounds were added to the natural gas or combustion air immediately before the burner or axially through furnace ports at post-flame locations. The FTIR continuously extracted gases from a fixed location (Port 18, see ), and in addition to O2, CO, and CO2, provided continuous spectral data that could be used to simultaneously quantify emission concentrations of the three PFAS, limited fluorinated PICs, HF, and additional non-fluorinated species. From the FTIR “library” of compounds, a subset “recipe” list of analytes was created. The recipe is the group of compounds selected to represent not only compounds we wanted to measure but also compounds that may be present and need to be accounted for that may have overlapping absorption features. The specific recipe of compounds established for these measurements is presented in . The FTIR system consisted of a heated probe and filter for particulate removal and gas distribution, a heated sample line, and a heated pump for sample delivery. All heated components were maintained at 180°C (356 °F) while the FTIR was maintained at 191°C (376 °F). Measurements were informed by EPA Method 320 (Vapor Phase Organic and Inorganic by Extractive FTIR) (U.S. EPA Citation2019) and ASTM D6348-12 (Standard Test Method for Determination of Gaseous Compounds by Extractive Direct Interface Fourier Transform Infrared (FTIR) Spectroscopy) (ASTM Citation2012) as the primary approach. Reference gases containing known concentrations of CF4, CHF3, and C2F6 were used to confirm measurement data quality. These gases were injected directly to the FTIR to verify FTIR reference spectra accuracy. These gases were also injected at the probe through the entire FTIR sampling system using dynamic spiking, a form of standard addition, to assess overall measurement quality and measurement sensitivity. To determine emission concentrations, experimental conditions were established, and once the FTIR achieved a steady state, one-minute readings over 5 min were averaged. FTIR spectral residuals were calculated by classical least squares (CLS) in the MKS MG2000 software. If an unknown gas was present, then the CLS regression will have a poor fit with the adsorption spectrum of the unknown being shown in the residual. In this way, the residual acts as a built-in quality control feature to indicate interference or the presence of an unknown absorbance in the same wavelength spectrum. The residuals were averaged and compared to the FTIR target analyte concentration averages. Concentrations that were greater than 3x the residuals were considered a “real” result. Unlike many conventional CEMs, FTIR does not require removal of water vapor from the gas samples. In fact, FTIR can quantify the water vapor concentrations, so that results could be reported on either a wet- or dry-basis.
Table 1. Compounds measured by FTIR in the present study
Due to concerns about HF formation and degradation of furnace refractory and metal materials by fluorine attack, the PFAS feed rates were limited as much as possible. It was determined that flows of ~30.6 mL/min, roughly equivalent to 34 ppmv CF4 in the combustion gases, and 135 ppmv HF (theoretical) in the furnace exhaust gases was sufficient to quantify concentrations and calculate DEs while minimizing potential damage to the refractory and other furnace components. As discussed below, DEs for CF4 were significantly less than 99.99%.
The same combustion conditions and injection feed rate were used for both CHF3 and C2F6, resulting in theoretical furnace exhaust HF concentrations of approximately 101 and 203 ppmv, respectively. When introduced with the natural gas or with the combustion air, the PFAS experience different reducing or oxidizing conditions within the flame. The three PFAS were also introduced at the same flow rate at selected ports post-flame to investigate the effect of temperature and reduced radical concentrations on DEs and PIC formation. We used a quartz tube (4 mm inside diameter) to introduce PFAS gases through side access ports along the furnace centerline (see ). Thus, PFAS introduced with the natural gas or combustion air (tres = 0 sec) experience the full temperature profile (see ) and flame chemistry before being analyzed by FTIR at Port 18 (tres~7.4 sec). However, PFAS introduced at Ports 4–12 experienced reduced temperatures, residence times, and exposure to flame chemistry. For example, CHF3 introduced at Port 12 (at 40 kW), was exposed to peak temperatures of ~830°C (1526 °F) before being analyzed by FTIR at Port 18 ~3 sec later. The effect of PFAS concentration and DE and PIC formation was not investigated in this study. However, we believe that this may be an important parameter as increased PFAS concentrations may lead to increased concentrations of fluorinated free radicals and partial decomposition products. Since fluorinated PIC formation appears to include both first and second order kinetic processes, fluorinated PIC emissions will be related to increased concentrations of these intermediate fluorinated species.
The chemical kinetics PFR integrator available in the CFS was used to perform kinetic calculations as a stand-alone external to the CFS software. As will be described below, 17 cases, representing CF4, CHF3, and C2F6 introduced individually through the flame and five post-flame locations are presented. For PFAS injected downstream through one of multiple axial ports, the calculations involved a two PFR network where the first PFR modeled the combustion of the natural gas followed by the second PFR with the PFAS injected. Suction pyrometry measurements taken at a firing rate of 45 kW provided the temperature-time profile used (see ). For residence times earlier than the first measurement location (Port 1) a linear temperature profile was assumed where at time = 0 the adiabatic flame temperature (methane-air at SR = 1.2, 2071°C) was assumed.
Results and discussion
As described by Tsang, Burgess, and Babushok (Citation1998), CF4 is the most difficult fluorocarbon to dissociate, as its strong symmetrical C-F bonds (552 kJ/mol) are extremely difficult to break through unimolecular decomposition. In contrast, the relatively weak HO-F bond (216 kJ/mol) formed through reaction with OH makes this pathway non-viable. This leaves the attack of the C-F bonds by H radicals to form even stronger H-F bonds (569 kJ/mol) as the only viable CF4 dissociation pathway. However, H radicals are not expected to persist in high concentrations far outside fuel-rich flame regions, as they tend to readily form OH radicals in the strongly oxidative post-flame region. C2F6 has a relatively weak C-C bond (408 kJ/mol) which interestingly, is lower than the C-H bond for CHF3 (456 kJ/mol). For C2F6, unimolecular C-C dissociation seems to be the preferred pathway, and the relatively higher energy required to break the C-C bond will make subsequent decomposition of the weaker CF2-F bond (352 kJ/mol) viable. However, the resulting symmetrical CF2 radicals formed subsequently have relatively strong C-F bond energies (508 kJ/mol), and further decomposition of the CF2 radicals will be more difficult with significant potential for PIC formation.
presents DE calculations based on FTIR measurements at Port 18 for CF4, CHF3, and C2F6 introduced with the natural gas (through the flame), combustion air, and at selected post-flame locations. Results for 40, 45, and 64 kW furnace loads are included. DEs, based on model calculations at 45 kW are included for comparison. Calculation of DEs for both the measurements and model were based on EPA Method 19 (U.S. EPA Citation2017) and include volume corrections based on the natural gas fuel composition (stoichiometry) and use measured CO2 (wet) concentrations to adjust for small amounts of in leakage caused by the combustor’s induced draft blower. These corrections are unnecessary for the model, as the fuel is assumed to be methane (CH4), and no systemic leakage is present. Evident from is that DEs for CF4 are less than 60, 90, and 95% for 40, 45, and 64 kW loads, respectively, even when introduced through the flame. Introduced further downstream at post-flame conditions, CF4 DEs are very consistent, decreasing from ~14% (45 kW, Port 4, 1295°C/2363 °F) to ~8% (40 kW, Port 11, ~875°C/1607 °F). Clearly, even directly exposed to flames, CF4 is very difficult to destroy, and we postulate that the nearly constant (perhaps slowly declining) DEs of CF4 downstream of the flame may be related to partial catalytic destruction of CF4 on the alumina-rich high temperature refractory lining the Rainbow furnace. CF4 is used for plasma etching purposes in several industries including semiconductor production and metal catalysts, including γ-alumina, are used as a control technology to catalytically oxidize residual CF4 (Anus et al. Citation2021; Han et al. Citation2018). Calculation of the relative time scales for diffusion and advection suggests that while mass transfer by advection dominates, there is sufficient residence time for a portion of the CF4 to diffuse to and react with the refractory walls. In comparison, at 45 kW, the model calculates ~98% DE when CF4 is introduced through the flame. However, the DEs are predicted to fall to ~0% for CF4 introduced at Port 4 (1170°C/2138 °F) through Port 10 (930°C/1706 °F). The kinetics both overpredict DEs in the frame, and underpredict DEs downstream. This could be related to both the ideal assumptions made and to the use of the adiabatic flame temperature (2070°C/3758 °F) and linear profile used by the model between the burner exit and Port 1. The model also does not include any heterogeneous chemistry and is unable to account for any potential catalytic reactions on the refractory surfaces. However, the model does capture the very high dependence of temperature on CF4 destruction. At 45 and 64 kW, we compared measured DEs for CF4 introduced with the natural gas and combustion air. Both are introduced through the burner, but each experiences a different oxidizing/reducing environment and temperature history. Interestingly, DEs for CF4 introduced with the natural gas 90 and 95% are higher than for CF4 introduced with the combustion air 83 and 89% (45 and 64 kW, see ). The increased DE through natural gas in the burner suggests that mixing CF4 with hydrogen at the diffusion flame front may be beneficial for the destruction of C-F bonds through free radical reaction mechanisms. Our observations indicate premixing natural gas with CF4 to make more hydrogen radicals readily available in the flame facilitates destruction of C-F bonds.
Table 2. Comparison of measured (Exp) and calculated (Model) PFAS destruction efficiencies (DEs) within the Rainbow furnace as a function of compound and injection location. Measurements performed by FTIR at Port 18 (see )
Table 3. Comparison of measured (Exp) and calculated (Model) PFAS PICs (including residual PFAS and HF, in bold italic font) from the Rainbow furnace as a function of compound and injection location. Measurements performed by FTIR at Port 18 (see ). Measured species were >3x the SLC residuals and are shown to the nearest 10 ppbv with ± one standard deviation. Modeled species were >10 pptv, 45 kW furnace load
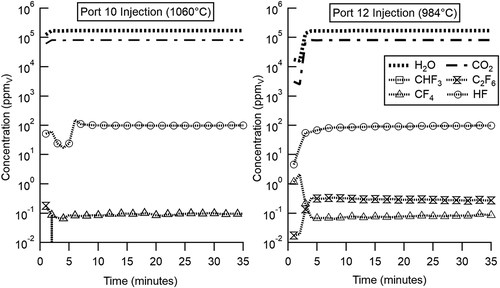
In contrast to CF4, measured DEs for CHF3 introduced through the flame or through Ports 4 through 12 are very high (>99%) at 45 kW. Even at 40 kW when introduced at Port 12 (830°C/1526 °F), the DE is ~94%. In this case, the model calculations agree very well, also predicting >99% DEs through Port 10. Model calculations and species profiles predict that unlike H radicals, significant concentrations of OH radicals persist for seconds post-flame through Ports 10 and 12 (0.035 and 0.017 ppmv, respectively) and that hydrogen abstraction by OH accounts for the high DEs determined for CHF3 when introduced at these relatively moderate temperature locations. However, as indicated in , high DE does not necessarily mean the absence of PICs, as hydrogen abstraction of the CF3-H bond results in the formation of trifluoromethyl (CF3) radicals, which can undergo further reactions including reactions with other fluorinated species. (45 kW) shows example FTIR traces during experiments where CHF3 was injected at relatively cool Port 10 (1060°C/1940 °F) and Port 12 (984°C/1803 °F) locations, well downstream of the flame. Real-time measurements were acquired not only for the CHF3 that was being injected, but also for the CF4 and C2F6 that were formed as PICs. also presents HF as well as the CO2 and H2O generated predominantly in the flame. Concentrations of multiple species spanning six orders of magnitude were measured simultaneously. Evident from is that even though CHF3 concentrations are below detection levels when introduced at Ports 10 and 12 (45 kW), and DEs >99% are achieved, CF4 emissions (~0.10 ppmv) are evident for Port 10, and CF4 and C2F6 emissions (~0.08 and ~0.30 ppmv, respectively) are evident for Port 12. For CHF3, Port 12 (45 kW) also represents conditions where the model first predicts DE falling below 99.9%.
Figure 3. Real-time FTIR species concentrations measured at Port 18 depicting CHF3 injection at Ports 10 and 12 (45 kW load). In this case, CHF3 was introduced, and after a brief transitory period stable FTIR traces are achieved. Note the absence of detectable CHF3, CF4 formation as a PIC at both Port 10 and Port 12, and C2F6 formation as a PIC during Port 12 injection. CF4 concentrations (above) were <3x the CLS residual value and therefore, not reported in .
Finally, the thermal stability of C2F6 lies somewhere in between CF4 and CHF3. At 45 kW, measured DEs for C2F6 are >99% inside the flame zone and through Port 10 (930°C/1706 °F) but drop to ~86% at Port 12 (830°C/1526 °F). At 40 kW, DEs fell to ~78% at Port 8 (1132°C/2070 °F) and decreased rapidly from there. Measured and modeled DEs agree remarkably well, particularly the 40 kW experimental data, which is slightly cooler than the ascribed temperatures employed in the model (see ) and the drop to 0% DE is correctly predicted at Port 12. It appears that destruction of this simple perfluoro compound occurs near the flame zone where high temperature unimolecular dissociation and free radical reactions, likely involving H radicals, are the predominant destruction mechanisms. We believe that C2F6 may be an important potential surrogate PFAS compound for combustion studies because its single C-C bond is analogous to the multiple C-C bonds in larger PFAS. While CHF3 may model the behavior of polyfluoro species compared to perfluoro species, C2F6 models C-C dissociation reactions common to almost all PFAS.
presents fluorinated PIC species measured by FTIR and fluorinated PIC species predicted by the kinetic model as a function of PFAS and injection location. When non-zero, we include concentrations of the original PFAS, as well as HF concentrations, also determined by FTIR. These are presented in italic font to distinguish them from the fluorinated PICs. Concentrations are presented as ppmv. For the model, concentrations less than 1 part per trillion by volume (pptv) are treated to be zero, but only species with concentrations >10 pptv are included in . Measured and predicted HF concentrations can be compared directly to show that fluorine conservation is variable. However, the HF predictions from the model are equal to the theoretical residual HF since reactions involving the furnace surfaces are not considered. Presumably there are losses of HF to the refractory and furnace surfaces via reaction and adsorption. Even though CF4 DEs are always low, few PICs (identifiable by FTIR) were quantified. We believe that for CF4, the high energies necessary to remove the first fluorine (552 kJ/mol) (Tsang, Burgess, and Babushok Citation1998) also provide adequate energies for complete defluorination. That is, for CF4, destruction tends to be all or nothing, due to the high energies needed to break the first bond. While not presented in the table due to being below the detection limit, FTIR spectra did indicate the presence of low concentrations (<1 ppmv) of CH2F2 while the model predicted carbonyl fluoride (CF2O). In fact, CF2O was a predicted PIC for all three experimental PFAS compounds for almost every model scenario. CF2O is measurable by FTIR (see ) though it has been suggested that CF2O will readily decompose into CO2 and HF through homogeneous gas phase hydrolysis at low temperatures (Lu et al. Citation2021; Uchimaru et al. Citation2004), which could make the sampling and FTIR measurement of CF2O in the cooling flue gas particularly difficult. Conversely, there was also some absorbance indicating 0.1–0.2 ppmv difluoromethane (CH2F2) as a PIC from CF4 destruction although below FTIR detection limit and not included in , but also not predicted by the model at concentrations >10 pptv.
During injection of CHF3 at 45 kW, CF4 was identified as a PIC in Ports 4 (1295°C/2363 °F), 6 (1210°C/2210 °F) and 8 (1132°C/2070 °F). However, at these ports the model predicted CF2O as a PIC. At 40 kW, no FTIR-measurable PICs were identified until Ports 10 (925°C/1697 °F) and 12 (930°C/1528 °F) where ~1 ppmv of C2F6 was measured by FTIR. This corresponds to DE measurements (see ), which for CHF3 began to fall below 99% after Port 10. The model also predicts emissions of C2F6 at Port 8 (1 ppbv), Port 10 (20 ppbv), and Port 12 (80 ppbv). These measurements and model predictions of notable concentrations of C2F6 are important not only because of their relative agreement, but also because they suggest that larger PFAS can be formed from smaller PFAS and PFAS fragments outside the flame zone. In addition to C2F6 and CF2O, other PICs predicted by the model (>10 pptv) for CHF3 include CF4, CF3COF (Port 10, 930°C/1706 °F) and CHFO, CHF2CF3, C2F4, CF3COH (Port 12, 850°C/1562 °F). Note that in addition to C2F6, the model predicts the emissions of several other stable C2 fluorinated species. Unlike CF4, the relatively weaker C-H bond, susceptible to hydrogen abstraction by OH, in CHF3 promotes high DEs even when introduced away from the flame zone at relatively low post-flame temperatures. However, this also means that reactive CF3 radicals are being formed under conditions that may not be conducive to further degradation, and instead promote recombination reactions with other fluoromethyl radicals at lower temperatures (930°C/1706 °F). It has been suggested in other recent studies that oxidation of hydrofluorocarbons is initiated by hydrogen atom abstraction of the compounds by OH radicals and in this case, resulting in CF3 radicals formed as the reaction product (Takahashi et al. Citation2019, Citation2020). It appears that available energy at such post-flame zone conditions in our tests is high enough to initiate the decomposition of CHF3 through hydrogen abstraction (CHF3 + OH = CF3 + H2O), but it is not high enough to sustain further decomposition of the CF3 radicals through breaking the higher energy C-F bonds and resulting in recombination of two reactive CF3 radicals to form C2F6 as a PIC. This is supported by the modeling results that indicate ppmv concentrations of OH well downstream of the flame.
Again, C2F6 behavior lies between those of CF4 and CHF3. No FTIR measured PICs were identified until Port 4 where CF4 was measured at 0.76 ppmv for 40 kW (1090°C/1994 °F) and 30.6 ppmv for 45 kW (1295°C/2363 °F). Beyond Port 4, DEs for C2F6 at 40 kW fall below 99%, and no measured PICs are observed by FTIR. At 45 kW, injection at Port 8 (1132°C/2070 °F) led to the formation of 0.93 ppmv CF4, interestingly indicating that CF4 begins to be formed just below 1100°C, with concentrations increasing with temperature. In addition to CF2O, the model predicts emissions of CF4 (10 ppbv) and CHF3 (10 ppbv), but only beginning at Port 10 (930°C/1706 °F). For C2F6, no other fluorinated C2 species are measured or predicted. This is very different than experiments injecting CHF3 where C2F6 was both measured and predicted, and several other C2 species were predicted. This could be due to the relatively higher temperatures needed for >99% DEs for C2F6 compared to CHF3. Assuming the initial reaction for C2F6 (which has no C-H bond and is not a hydrofluorocarbon) is limited to C-C dissociation, these higher temperatures may sustain further disassociation rather than radical recombination. CF4 was the most significant PIC measured (30.6 ppmv) when C2F6 was introduced at Port 4. Formation of CF4 may proceed from the hydrolysis of CF2O which forms through unimolecular dissociation of CF3-CF3 (408 kJ/mol), followed by further dissociation of the relatively weak CF2-F bond (352 kJ/mol) (Tsang, Burgess, and Babushok Citation1998). Further dissociation of the CF-F radical may be limited by its very high bond energy (508 kJ/mol), resulting in preferred oxidation of CF2 by O to form CF2O as a PIC. Although many additional experiments and modeling scenarios need to be performed, these initial results suggest that PICs may be most prevalent at transition conditions between those dominated by fast free radical chain reactions occuring in the flame zone to promote high PFAS destruction (>99%) and those more slow and selective free radical recombination reactions occuring just outside the flame zone with very low PFAS destruction. The transition conditions from fast kinetics to slow kinetics near the end of the flame zone seems to have a significant effect on PIC emissions from PFAS destruction; further studies are required to understand these effects.
Conclusion
Experimental results indicate that CF4 is the most difficult to destroy of the tested compounds with DEs of only ~90% when introduced through the 45 kW flame (~1295°C/2363 °F peak bulk gas temperature) and <14% when introduced post-flame (<1295°C/2363 °F). Increasing the furnace load (64 kW), and peak bulk gas temperature (~1400°C/2552 °F), increased CF4 DE through the flame (~95%). However, DEs for CF4 introduced with the combustion air were lower (~89%), suggesting the opportunity for CF4 to partially bypass the flame. Model calculations over predicted CF4 DE through the flame (~98%), and underpredicted CF4 DE post-flame (~0%). However, these results suggest that CF4 may be a very useful surrogate indicator of the relative thermal exposures of PFAS treated by different incinerators and introduced at different locations. Small CF4 DEs measured at moderate and low temperatures, may be the result of catalytic reactions with alumina-rich high temperature refractory surfaces within the furnace. These heterogeneous reactions are not part of the current kinetic model.
The presence of C-H and C-C bonds in these PFAS molecules greatly affected the DEs. For CHF3, DEs of >99% were measured even when introduced well downstream of the flame (~930°C/1706 °F). C2F6 was somewhat more difficult to destroy but still exhibited DEs >99% in the flame and through 1060°C/1940 °F post-flame locations. Model calculations were much better able to predict CHF3 and C2F6 destruction and largely captured the temperatures where DEs for both compounds fell below 99%. These initial modeling results are encouraging and are likely to be improved as the PFR kinetic model is replaced by a full CFD treatment of the mixing and fluid dynamics, a better treatment of the flame temperature, and calculated temperature profiles. Since most PFAS of practical interest contain C-C bonds, these initial results for C2F6 suggest that PFAS can be destroyed when subjected to reasonably aggressive thermal environments that include free radical flame chemistry.
This study successfully demonstrated the feasibility of using FTIR as a CEM capable of measuring multiple gas-phase species (including some fluorocarbons) extracted from the combustion flue gases. Real-time FTIR-based PIC measurements were able to characterize the presence of several fluoro-organic species in the combustion flue gases including C2F6, and CF4 at operationally relevant concentrations, as well as conventional flue gas constituents like CO, CO2, water vapor, and HF. For the most part, PICs were identified during experiments when the PFAS was introduced at lower temperatures downstream from the flame. However, the relatively lower energies associated with C-C and C-H bond, which is particularly susceptible to hydrogen abstraction by OH radicals, suggest the possibility of the formation of CF2 and CF3 radicals at thermal conditions that are unable to fully de-fluorinate these species resulting in fluorinated PIC formation. Model calculations were able to predict many species (CH2F2, C2F6, COF2, CF4, CHF3, CHF2CF3, C2F4, CF3COF, and CF3CHO) at concentrations >1 pptv some of which were also measured by FTIR. While several fluoro-organic PICs were measured and predicted for CHF3 and C2H6, very few PICs were measured or predicted for CF4. CF4 destruction seems to be an all or nothing phenomenon, suggesting that thermal conditions conducive to dissociate the first C-F bond are also sufficient to continue the defluorination reaction mechanism of the remaining lower energy C-F bonds to yield CO2 and HF. Most interestingly, C2 fluoro-organic PICs were measured and predicted for CHF3. This suggests that CF3 radicals formed after hydrogen abstraction, recombine to produce larger PFAS. For CHF3, C2F6 was both measured (0.26–0.98 ppmv) and predicted (0.02–0.08 ppmv), and CF3COF, CHF2CF3, C2F4, CF3COF, and CF3CHO were predicted at very low concentrations. Several fluorinated PICs were indicated during different experiments, but at concentrations below 3x the CLS residual value, and not included in . presents one such instance for CF4. Additional fluorinated PICs were indicated at levels below limits specified by ASTM D6348 and not included in . This is likely due to the very low PFAS feed rate used (~34 ppmv in the combustion gases) and warrants further investigation.
Model calculations and species profiles predict that significant concentrations of OH radicals persist for seconds in the post-flame through Ports 10 and 12 (0.035 and 0.017 ppmv, respectively), and that hydrogen abstraction by OH accounts for the high DEs determined for CHF3 when introduced at these relatively low temperature locations. Further, recombination of the CF3 radicals formed after hydrogen abstraction result in the formation of C2F6 as a PIC. In contrast, CF4 and C2F6 have no C-H bonds, and therefore, hydrogen abstraction is not a viable pathway for these two compounds. No significant consumption of OH radicals was predicted when C2F6 was injected at Port 8 or at Port 10.
Finally, even when both experimental measurements and model predictions indicate DEs >99% (see ), FTIR measurements of HF agreed poorly with HF concentrations predicted by the model. A significant factor may be due to fluorine or HF adsorption, reaction, or loss to refractory and other combustor surfaces. Fluorine reaction with the silica (Si) present in most refractories (producing vapor-phase SiF4) is a known issue (Che, Iaquaniello, and Olivieri Citation2002), and the cause of many instances of refractory failure in incinerator systems.
Further studies may be performed investigating the effects of PFAS concentration on DEs, injection of additional PFAS surrogate compounds such as octafluoropropane, and the use of atomization techniques to introduce larger liquid-phase PFAS. Future work is planned to perform full CFD runs of the CFS model enabling a comparison of PFR and full CFD results, and inclusion of additional incinerators designs involving different temperatures and stoichiometric conditions into the CFS model. Eventually, as more complex fluoro-organic kinetics are developed, the CFS model could be used to predict PFAS destruction and PIC formation in practical incineration systems.
Acknowledgment
Portions of this work were sponsored under EPA contract 68HERC20F0377-001 with Jacobs Technology Inc. The authors are grateful to Josh Varga, Mike Tufts, Larry Virtaranta, Eric Squier, and Carl Ray for their assistance in the construction, maintenance, calibration, and operation of the experimental combustor, and sample collection and analyses. The research described in this paper has been reviewed by the U.S. EPA Center for Environmental Measurement and Modeling and approved for publication. The contents of this paper should not be construed to represent Agency policy nor does mention of trade names or commercial products constitute endorsement or recommendation for use.
Disclosure statement
No potential conflict of interest was reported by the author(s).
References
- Altarawneh, M. 2021. A chemical kinetic for model for the decomposition of perfluorinated sulfonic acids. Chemosphere 263:128256. doi:https://doi.org/10.1016/j.chemosphere.2020.128256.
- Anus, A., M. Sheraz, S. Jeong, E.-K. Kim, and S. Kim. 2021. Catalytic thermal decomposition of tetrafluoromethane (CF4): a review. J. Anal. Appl. Pyrol. 156. doi:https://doi.org/10.1016/j.jaap.2021.105126.
- ASTM. 2012. ASTM D6348-12 (Standard test method for determination of gaseous compounds by extractive direct interface Fourier transform infrared (FTIR) spectroscopy). West Conshohocken, PA: American Society for Testing and Materials. https://www.astm.org/d6348-12.html.
- Babushok, V. I., D. R. Burgess, M. J. Hegetschweiler, and G. T. Linteris. 2020. Flame propagation in the mixtures of O2/N2 oxidizer with fluorinated propene refrigerants (CH2CFCF3, CHFCHCF3, CH2CHCF3). Combust. Sci. Technol. 1–24. doi:https://doi.org/10.1080/00102202.2020.1860954.
- Babushok, V., D. R. Burgess, W. Tsang, and A. Miziolek, 1994. Simulations studies of the influence of fluorine and bromine containing fire suppressants on ignition behavior. Halon Options Technical Working Conference, Albuquerque, NM, 217–28.
- Babushok, V. I., T. Noto, D. R. Burgess, A. Hamins, and W. Tsang. 1995. Influence of CF3I, CF3Br, and CF3H on the High-temperature combustion of methane. Combust. Flame. 107:351–67. doi:https://doi.org/10.1016/S0010-2180(96)00052-1.
- Buck, R. C., J. Franklin, U. Berger, J. M. Conder, I. T. Cousins, P. de Voogt, A. A. Jensen, K. Kannan, S. A. Mabury, and S. P. J. van Leeuwen. 2011. Perfluoroalkyl and polyfluoroalkyl substances in the environment: Terminology, classification, and origins. Integr. Environ. Assess. Manag. 7 (4):513–41. doi:https://doi.org/10.1002/ieam.258.
- Burgess, D. R., M. R. Zachariah, W. Tsang, and P. R. Westmoreland. 1995. Key species and important reactions in fluorinated hydrocarbon flame chemistry. ACS Symp. Ser. 611:322–40.
- Burgess, D. R., M. R. Zachariah, W. Tsang, and P. R. Westmoreland. 1996. Thermochemical and chemical kinetic data for fluorinated hydrocarbons. Prog. Energ. Combust. 21:453–529.
- Che, S. C., G. Iaquaniello, and L. Olivieri. 2002. Selection of refractory for thermal oxidizers on gas streams containing fluorine. Environ. Prog. 21 (2):116–20. doi:https://doi.org/10.1002/ep.670210214.
- Cordner, A., V. Y. De La Rosa, L. A. Schaider, R. A. Rudel, L. Richter, and P. Brown. 2019. Guideline levels for PFOA and PFOS in drinking water: The role of scientific uncertainty, risk assessment decisions, and social factors. J. Expo. Sci. Environ. Epidemiol. 29 (2):157–71. doi:https://doi.org/10.1038/s41370-018-0099-9.
- Daniel, R. G., K. L. McNesby, A. W. Miziolek, D. R. Burgess, W. Tsang, and M. R. Zachariah, 1994. IR laser adsorption and modeling studies of hydrogen flames inhibited by candidate halon replacement compounds. Halon Options Technical Working Conference, Albuquerque, NM.
- Denison, M. K., C. J. Montgomery, A. F. Sarofim, M. J. Bockelie, A. G. Webster, and R. J. Mellon, 2002. Advanced computational modeling of military incinerators. 21st International Conference on Incineration and Thermal Treatment Technologies (IT3), New Orleans, LA, May.
- Fudihara, T. J., L. Glodstein Jr., and M. Mori. 2003. The three-dimensional numerical aerodynamics of a movable block burner. Braz. J. Chem. Eng. 20 (4):391–401. doi:https://doi.org/10.1590/S0104-66322003000400006.
- García, A. N., N. Viciano, and R. Font. 2007. Products obtained in the fuel-rich combustion of PTFE at high temperature. J. Anal. Appl. Pyrol. 80 (1):85–91. doi:https://doi.org/10.1016/j.jaap.2007.01.004.
- Grosshandler, W., R. Gann, and W. Pitts. 1994. Summary and Recommendations (NIST SP 861), Special Publication (NIST SP). National Institute of Standards and Technology Gaithersburg, MD. https://doi.org/https://doi.org/10.6028/NIST.SP.861 [Accessed January 7, 2022].
- Han, T. U., B.-S. Yoo, Y.-M. Kim, B. A. Hwang, G. L. Sudibya, Y.-K. Park, and S. Kim. 2018. Catalytic conversion of 1,1,1,2-tetrafluoroethane (HFC-134a). Korean J. Chem. Eng. 35 (8):1611–19. doi:https://doi.org/10.1007/s11814-018-0051-7.
- Kee, R. J., F. M. Rupley, and J. A. Miller 1989. Chemkin-II: A FORTRAN chemical kinetics package for the analysis of gas-phase chemical kinetics. SAND89-8009.UC-401, Sandia National Laboratories, September.
- Krusic, P. J., A. A. Marchione, and D. C. Roe. 2005. Gas-phase NMR studies of the thermolysis of perfluorooctonoic acid. J. Fluorine Chem. 126 (11–12):1510–16. doi:https://doi.org/10.1016/j.jfluchem.2005.08.016.
- Krusic, P. J., and D. C. Roe. 2004. Gas-phase NMR technique for studying the thermolysis of materials: Thermal decomposition of ammonium perfluorooctanoate. Anal. Chem. 76 (13):3800–03. doi:https://doi.org/10.1021/ac049667k.
- Lemal, D. M. 2004. Perspective on fluorocarbon chemistry. J. Org. Chem. 69 (1):1–11. doi:https://doi.org/10.1021/jo0302556.
- Lemieux, P., T. Boe, A. Tschursin, M. Denison, K. Davis, and D. Swensen. 2021. Computational simulation of incineration of chemically and biologically contaminated wastes. J. Air Waste Manage. 71 (4):462–76. doi:https://doi.org/10.1080/10962247.2020.1853627.
- Linak, W. P., C. A. Miller, J. P. Wood, T. Shinagawa, J. I. Yoo, D. A. Santoianni, C. J. King, J. O. L. Wendt, and Y. C. Seo. 2004. High temperature interactions between residual oil ash and dispersed kaolinite powders. Aerosol. Sci. Technol. 38:900–13. doi:https://doi.org/10.1080/027868290500805.
- Linak, W. P., R. K. Srivastava, and J. O. L. Wendt. 1994. Metal aerosol formation in a laboratory swirl flame incinerator. Combust. Sci. Technol. 101:7–27. doi:https://doi.org/10.1080/00102209408951863.
- Linteris, G. T., and L. F. Truett. 1995. Inhibition of premixed methane-air flames by fluoromethanes. Combust. Flame. 105:15–27. doi:https://doi.org/10.1016/0010-2180(95)00152-2.
- Lu, Y., T. Zhang, M. Lily, W. Wang, F. Liu, and W. Wang. 2021. The catalytic effects of H2O, basic and acidic catalysts on the gas-phase hydrolysis of carbonyl fluoride (CF2O). Int. J. Quantum Chem. 121 (13). doi: https://doi.org/10.1002/qua.26657.
- O’Hagan, D. 2008. Understanding organofluorine chemistry. An introduction to the C-F Bond. Chem. Soc. Rev. 37 (2):308–19. doi:https://doi.org/10.1039/B711844A.
- OECD, Organization for Economic Co-operation and Development. 2018. Toward a new comprehensive global database of per-and polyfluoroalkyl substances (PFAS): Summary report on updating the OECD 2007 List of per and polyfluoroalkyl substances (PFAS). Series on Risk Management No. 39, ENV/JM/MONO(2018) 7, May. https://www.oecd.org/officialdocuments/publicdisplaydocumentpdf/?cote=ENV-JM-MONO(2018)7&doclanguage=en
- Okazoe, T. 2009. Overview on the history of organofluorine chemistry from the viewpoint of material industry. Proc. Jpn. Acad., Ser. B, Phys. Biol. Sci. 85 (8):276–89. doi:https://doi.org/10.2183/pjab.85.276.
- Oppelt, E. T. 1987. Incineration of hazardous waste. A critical review. JAPCA J. Air Waste Ma 37 (5):558–86.
- Sunderland, E. M., X. C. Hu, C. Dassuncao, A. K. Tokranov, C. C. Wagner, and J. G. Allen. 2019. A review of the pathways of human exposure to poly- and perfluoroalkyl substances (PFASs) and present understanding of health effects. J. Expo. Sci. Environ. Epidemiol. 29 (2):131–47. doi:https://doi.org/10.1038/s41370-018-0094-1.
- Takahashi, S., H. Nakamura, T. Tezuka, and K. Maruta. 2020. Oxidation of a C2HF5/air mixture examined by weak flames in a micro flow reactor with a controlled temperature profile. Combust. Flame. 217:12–20. doi:https://doi.org/10.1016/j.combustflame.2020.03.013.
- Takahashi, S., H. Nakamura, T. Tezuka, S. Hasegawa, and K. Maruta. 2019. Multi-stage oxidation of a CH2F2/air mixture examined by weak flames in a micro flow reactor with a controlled temperature profile. Combust. Flame. 201:140–47. doi:https://doi.org/10.1016/j.combustflame.2018.12.014.
- Taylor, P. H., T. Yamada, R. C. Striebich, J. L. Graham, and R. J. Giraud. 2014. Investigation of waste incineration of fluorotelomer-based polymers as a potential source of PFOA in the environment. Chemosphere 110:17–22. doi:https://doi.org/10.1016/j.chemosphere.2014.02.037.
- Tsang, W., D. R. Burgess, and V. Babushok. 1998. On the incinerability of highly fluorinated organic compounds. Combust. Sci. Technol. 139 (1):385–402. doi:https://doi.org/10.1080/00102209808952095.
- U.S. EPA. 2017. Method 19, determination of sulfur dioxide removal efficiency and particulate matter, sulfur dioxide, and nitrogen oxide emissions rates. Washington, DC: U.S. Environmental Protection Agency. https://www.epa.gov/emc/method-19-sulfur-dioxide-removal-and-particulate-sulfur-dioxide-and-nitrogen-oxides-electric. August 3.
- U.S. EPA. 2019. U.S. EPA method 320 (vapor phase organic and inorganic by extractive FTIR). Washington, DC: U.S. Environmental Protection Agency. https://www.epa.gov/emc/method-320-vapor-phase-organic-and-inorganic-emissions-extractive-ftir.
- Uchimaru, T., S. Tsuzuki, M. Sugie, K. Tokuhashi, and A. Sekiya. 2004. Ab Initio study of the hydrolysis of carbonyl difluoride (CF2O); importance of an additional water molecule. Chem. Phys. Lett. 396:110–16. doi:https://doi.org/10.1016/j.cplett.2004.08.022.
- Westmoreland, P. R., D. R. Burgess, W. Tsang, and M. R. Zachariah, 1993. Kinetics of fluoromethanes in flames, chemical and physical processes in combustion. Eastern States Sect., Combustion Institute, New Orleans, LA.
- Westmoreland, P. R., D. R. Burgess, W. Tsang, and M. R. Zachariah. 1994. Fluoromethane chemistry and its role in flame suppression. 25th Symp. (Int) Combust. 25:1505–11. doi:https://doi.org/10.1016/S0082-0784(06)80795-2.
- Yamada, T., P. H. Taylor, R. C. Buck, M. A. Kaiser, and R. J. Giraud. 2005. Thermal degradation of fluorotelomer treated articles and related materials. Chemosphere 61 (7):974–84. doi:https://doi.org/10.1016/j.chemosphere.2005.03.025.
- Yoo, J. I., T. Shinagawa, J. P. Wood, W. P. Linak, D. A. Santoianni, C. J. King, Y. C. Seo, and J. O. L. Wendt. 2005. High-temperature sorption of cesium and strontium on dispersed kaolinite powders. Environ. Sci. Technol. 39 (13):5087–94. doi:https://doi.org/10.1021/es048064n.