
ABSTRACT
Environmental operators perform their activities in accordance with the relevant legal provisions; however, this does not mean that they operate at their technological optima using the operational information available. The possible negative effects (odor, noise, etc.) of a sub-optimal operation can be felt first and foremost by those living in the immediate vicinity of the given object. It would be important to make effective use of these citizens feedback (quickly to revealing the root causes) thus minimize negative environmental impact of operations. The solution proposed in this paper is a portal called EnviroMind, which allows citizens feedback to be recorded in an easy, immediate, and structured way via a form and on the other hand, it provides a real-time graphical odor transmission model output in a dashboard to operators. Using this portal as a monitoring system the magnitude of the odor effect could be reduced and a smaller area around the industrial object could be affected. In a landfill monitoring pilot project where this monitoring system was used the decrease in the number of indicated odor observations was 85% and the decrease in maximal distance from landfill to odor detection positions was 45%. It is proposed to use EnviroMind monitoring system for all industrial objects which have a significant odor effect on the environment, because by using it we can make the odor effect visible to operators in real time, thus, the reaction time for solving the problem can be minimized.
Implications: monitoring is available online to the surrounding community, the affected population, so that quick responses and interventions are available; in the knowledge of the current technological activity carried out on the site its expected odor effect in the area can be determined, whether a protected area can be reached and what odor concentration is expected; in every 15 minutes model results to accurately track expected odor emission values; possibility of intervention, stopping or modification of the technology steps. Experience and main achievements of portal operation in a landfill monitoring pilot project from recent 3 years: the decreasing number of odor perceptions (the decrease in the number of indicated observations was 85%) and the cessation of odor effects in certain areas (and the decrease in maximal distance from landfill to odor detection positions was 45%).
Introduction
In most cases, the involvement of the population – who are familiar with the given area and directly experience certain environmental impacts specific to the area – is insufficient in terms of either the measurements or decision-making processes. In most cases, the population only has the opportunity to raise questions and receive ex-post information. When environmental events and impacts that have a negative effect on the quality of life are detected, the decision-making mechanisms of the competent bodies and agencies are slow, moreover, the implementation and monitoring or remeasurement of interventions ordered by them – not to mention finding a real solution and communicating it effectively – is a laborious process lasting months or even years. Greater involvement of the population could result in the implementation of faster and more efficient solutions.
Residential environmental monitoring systems have already been implemented successfully in several areas. In these cases, data collected by the population provided relevant information to more effectively map and resolve the problem. For example, in the Airplane Monitor Schiphol project, the noise pollution from air traffic was monitored (Carton and Ache Citation2017). The main goal of the project Amsterdam Smart Citizens Lab is to monitor air quality [w1] and operates as a completely bottom-up innovation. The project Safecast is a living, functioning example of monitoring radioactivity on a global scale [w2].
In addition to the signals from the population, sensor-based data collection is also of great importance in the implementation of effective monitoring systems. For example, Jain paper proposed a system, where the completeness of waste in the dustbins is checked with the help of sensors so collection of garbage can be made efficiently (Jain and Bagherwal Citation2017). The real-time measurement of atmospheric ammonia at municipal solid waste landfills and adjacent areas is proposed in a paper for landfill management and the health of nearby residence (Yi, Zhang, and Smith Citation2021).
In the field of waste management, if insufficient consideration is given to citizens, e.g. incomplete or insufficiently detailed modeling of odor transmission, in the planning and operation of waste treatment and landfill facilities located near residential areas, a landfill can cause problems that directly affect residents (mainly noise and odor impacts, see about direct impacts in Viotti et al. Citation2020). In addition to the immediate negative effects on living conditions, frequent and unpleasant odor impacts can cause health problems both directly and indirectly, namely headaches, nausea, breathing problems and psychological stress (Brattoli, de Gennaro, and de Pinto Citation2012; Morgan et al. Citation2015). Furthermore, if the odors are significant and occur frequently, the negative perception of the affected communities and residential properties can also result in additional significant negative effects, e.g. the depreciation of residential properties.
In the case of an already existing landfill, a comprehensive and lasting solution would be to remeasure and reduce the actual effects of odor emissions, i.e. find the optimal technological directions and/or operational practices resulting in minimal emissions and odor impacts. Some aspirations for aftercare of landfill leachate are shown in the paper of Scandelai (Scandelai et al. Citation2018) and in paper of Chen (Chen et al. Citation2019); however, it would be best if already biologically stabilized substances were deposited in the landfill.
In this paper, a case study is presented where a regional waste treatment and landfill facility was analyzed to this purpose. From the second-third year after the start of operation of facility, the population of the surrounding settlements indicated in many cases that it smelled strange odors. The environmental authority was slow to respond to citizens signals and not all cases were investigated. Therefore, the root cause of the problem has not been explored either. The facility has three main parts: the mechanical processing plant, the biological treatment plant and the landfill. Last two were in focus of our study as possible main sources of odor in technology process. The case study describes in detail an integrated residential environmental monitoring system developed and proposed by us for the problem, the EnviroMind portal (https://www.enviromind.hu). In the research work, the operation of the facility was evaluated by integrating odors detected by citizens, local weather data, and operating parameters. Taking advantage of the benefits of data integration, much more efficient analyses can be performed by integrating the data sources that characterize the factors of a phenomenon into one system. The novelty of the research and its main value is that integrated data management that can solve such odor problems quickly and efficiently. It does not take months or years to solve the problem, but ad hoc intervention is possible, thus achieving optimal operation and minimizing the odor effect.
The structure of this paper is as follows: in Chapter 2 the data and methods are detailed used in a comprehensive analysis of biological and landfill processes, in Chapter 3 the main results of the analyses and main achievements of monitoring system using presented from last years are presented and in Chapter 4 conclusions are summarized.
Materials and methods
The focus of the study was to explore the true relationship between odor emission and odor detection, so first the available and necessary data were assessed and then steps were taken to collect data in areas where the extraction of relevant information had been impossible because of the lack and poor quality of the data available at the time.
Based on initial information, the detailed examination of two main technological steps – biological stabilization and deposition – was the most feasible. Therefore, experiments and series of measurements were planned at the landfill and biological treatment plant. At the biological treatment plant, a test chamber was used to examine the bacterial composition of the biological waste fraction (the non-recyclable fraction deposited), which had been processed and then deposited, as well as the storage conditions. In the case of the landfill, in addition to the analysis of meteorological data available for the area (from an external data source), a weather station was also developed and deployed to make much more accurate, real-time measurements of local environmental effects. Therefore, the real effects of internal (technological) and external (e.g., environmental) factors could be demonstrated.
Biological treatment (stabilization)
Sampling method
During the studied period (the end of 2018), the biological waste fraction was stored in the chambers of the biological treatment plant of the regional waste treatment facility, where it was also turned by machines, for 21–28 days. The capacity and floor area of each chamber is approximately 300 tons and 200 m2, respectively. To determine the bacterial composition, samples were taken from the designated test chamber on four occasions between 10/25/2018 and 12/11/2018. First at the time of loading (10/25/2018), during the two turnings (11/08/2018, 11/20/2018) and then on the day before removal (12/11/2018). The sampling technique in each case was as follows: approx. 10–10 half a handfuls of waste material were collected by hand (using rubber gloves) from five different points and heights across the width of the chamber/heap of waste material, then placed in a 1-l sampling bag labeled as inner (1st), central (2nd) and outer (3rd) to show which part of the chamber the samples were taken from before these three 1-l sampling bags were placed in a common larger collection bag. After sampling, the samples were stored at −20°C until evaluated. In the laboratory, each 1-l sample was homogenized to provide 1 standard sample for DNA isolation.
Sampling DNA extraction and sequencing
500 mL of Molecular Biology grade water (AccuGENE, Lonza) was added up to 500 g of matrices, which were homogenized in rotary shaker for 20 minutes at a speed setting of 150 rpm. Bacterial DNA was extracted from 1.5 mL of aqueous samples using the AquaGenomic Kit (MoBiTec) and further purified using KAPA PureBeads (Roche) according to the manufacturer’s protocols. The concentration of genomic DNA was measured using a Qubit 3.0 Fluorometer with Qubit dsDNA HS Assay Kit (Thermo Fisher Scientific). Bacterial DNA was amplified with tagged primers (5ʹ-TCGTCGGCAGCGTCAGATGTGTATAAGAGACAGCCTACGGGNGGCWGCAG and 5ʹ-GTCTCGTGGGCTCGGAGATGTGTATAAGAGACAGGACTACHVGGGTATCTAATCC) covering V3–V4 region of the bacterial 16S rRNA gene (Klindworth et al. Citation2013). Polymerase chain reactions (PCR) and DNA purifications were performed according to Illumina’s demonstrated protocol (Part # 15044223 Rev. B, [w3]). The PCR product libraries were quantified and qualified by using High Sensitivity D1000 ScreenTape on TapeStation 2200 instrument (Agilent). Equimolar concentrations of libraries were pooled and sequenced on an Illumina MiSeq platform using MiSeq Reagent Kit v3 (600 cycles PE).
Processing of sequencing data
320.317 ± 46.895 raw sequencing reads per sample were generated, which were demultiplexed and adapter-trimmed by using MiSeq Control Software (Illumina). FastQ Toolkit (Illumina) was applied to trim bases at the 3ʹ- and the 5ʹ-end with a quality score less than 30. Reads having mean quality score less than 30 and shorter than 250 bp were filtered out. The remaining 250.206 ± 58.553 high-quality sequences per sample were aligned and classified by using the Kraken software and its MiniKraken database 20141208 (Wood and Salzberg Citation2014).
Landfill processes
Meteorological data
During the studied period, the biological fraction was deposited in the landfill following biological treatment. Therefore, the main environmental effects present at the landfill, which significantly affect odor transmission and emission of the deposited material/odor source, had to be investigated.
When external data sources are used to obtain information on the effects of the weather at the landfill, information can only be extracted from the measurement data recorded at relatively remote weather stations. Due to frequent changes in wind direction and speed typical of the area, the modeling of odor transmission can lead to inaccurate results so the availability of local weather data is crucial. At the beginning of our investigations, no suitable local measurement data sets were available so a weather station was built and deployed at the landfill. Our goal was to develop a cost-effective weather station that can be adapted to the characteristics and environmental effects of different locations. In the absence of an electricity network, the station must be capable of being battery-powered for at least 24 hours and operating from mains electricity at 230 V when available, as was the case at the landfill studied. The station must also be capable of switching between the two power supplies at any time. An offline and online mode for data storage was also important. In the offline mode, the station must continuously save data to its own storage space and retrieve data without data migration or shutting the station down. In the online mode, it must send data to the EnviroMind portal in MQTT. Considering the aforementioned requirements, the weather station was built using a Raspberry Pi, which offers low-cost basic hardware, has a relatively low power consumption and an extensive program code base as its main benefits. Sampling frequency was set to one minute. Currently, the following sensors can be connected to the completed station: temperature and humidity sensor (DHT22); temperature, barometric pressure and altitude sensor (BMP180); temperature, barometric pressure, altitude and humidity sensor (BMP280); waterproof thermometer (DS18B20); wind speed and direction meter; precipitation gauge.
Processing of data
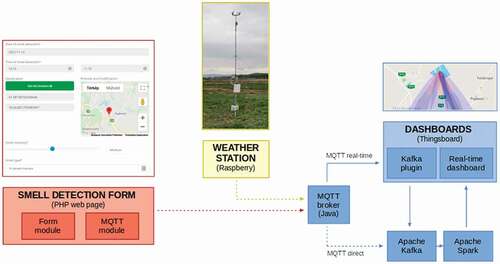
For the central storage and processing of the data, a monitoring system was developed based on the schematic diagram of the system shown in . The three main components of the system are: 1. Forms: users can record what they detect easily and quickly on forms designated for different problem areas, e.g. odor detection. The forms are responsive, the display, navigation, and data entry on the pages are optimized for both desktop and mobile devices. 2. Automated measurement systems: external data collection devices and automated measurement systems, e.g. weather stations or other sensors that provide environmental data, can be connected to the system, providing additional information besides detections by citizens. 3. Dashboards: it is possible to track the quantity and quality of detections/measurements recorded in the system for specific problem areas in a given area and period of time, e.g. odor detections recorded in the vicinity of the landfill. In addition to public dashboards, dashboards can be created with any data content – even data collected by a person or a group, e.g. a dashboard for the waste treatment facility with data from local weather stations. The collected data can also be queried ad hoc from the system database for any kind of future analyses and processing (further modeling), provided that the person accessing the information has the appropriate authorization.
Figure 1. A schematic diagram of the EnviroMind environmental monitoring system.
Odor transmission modeling
Prior to our investigations, a visit was paid to the regional landfill on 09/18/2018 to learn about the reasons for residential complaints – both onsite and offsite, the odor impact caused by the biological fraction could be personally experienced. The biological fraction is characterized by a characteristic sour, slightly pungent odor. The specific situation was examined in detail and several models of odor transmission were developed, e.g. using AERMOD: a second generation Gaussian model [w4]. The results of the initial modeling also showed that perceptible odor concentrations can develop at points relatively far from the landfill, e.g. in the surrounding communities, under suitable meteorological conditions such as stable, inversion states. At the same time, it can be seen that in the case of unstable states, the limit of perceptibility is much closer to the source. This is why locally obtained weather data are crucial for future studies as it is needed in models of odor transmission.
Data from this weather station can be utilized not only offline but also for the development of quasi-real-time online models of odor transmission. Therefore, in addition to the EnviroMind system, a software environment has been developed that facilitates this kind of modeling. For the calculation, the following data inputs are required: the parameters of the odor source, e.g. emission, temperature, altitude, diameter, geometry, etc., calculation area, receptor grid, and meteorological inputs. Based on these data, the AERMOD model calculates the expected odor concentration at the given points of a regular grid, which can then be visualized.
AERMOD is a second generation Gaussian transport model developed by the United States Environmental Protection Agency (US EPA), which is used worldwide. It was used to study local transport processes based on known local meteorological parameters. Based on near-surface meteorological data, time of exposure, calculated irradiance, and combinations thereof, approximal estimation was partly used to determine the data of the meteorological input files needed to run the model, e.g. the average wind speed was determined based on [w5]. Being familiar with the technology applied at the landfill, the expected odor emission was connected to the existing and investigated odor sources. The magnitude of the emissions was also provided for three different states of odor emission: low, medium, and high. The results of the model are displayed on the grid points of a regular grid to calculate the expected concentration of the emitted odor at these points which is then plotted on a map using an isoconcentration color scale (on a map dashboard interface within EnviroMind). Thus, the results of the model and possible detections by citizens can be compared immediately then validated; moreover, the source of the detected odor can be identified.
Knowledge of the model and local meteorological parameters can also be key for the optimal operation of certain elements and steps of the entire technological line. For example, technological steps that produce more significant odor emissions, e.g. the turning and loading of chambers as well as opening the prism, can only be performed under suitable meteorological conditions. These technological steps should be avoided should meteorological conditions be unfavorable in terms of transmission.
Results and discussion
Microbial taxonomic analysis at the order and at the genus levels
During the investigation, the bacterial composition of a total of 10 samples, homogenized by aqueous extraction, was determined (DNA extraction from two samples failed): three samples were taken during loading (10–25_a, 10–25_b, 10–25_c), one (11–08_a) and three samples (11–20_a, 11–20_b, 11–20_c) taken during the two turnings, and three more samples (12–11_a, 12–11_b, 12–11_c) collected at the time of deposition.
The top 15 bacterial orders found in the second sample (10–25_b) taken whilst loading were regarded as the base reference (these 15 bacterial orders comprised 95% of all the bacterial orders found) and for each sample, the relative ratio of these top 15 bacterial orders was determined.
shows the changes in bacterial composition over time broken down according to sampling sites illustrated in the area charts (a: inner part of the chamber, b: central part of the chamber, c: outer part of the chamber next to the door). The relative proportions of the major bacterial orders varied differently over time in the different parts of the chamber. Proceeding from the inner to the outer parts of the chamber (in the order of a to c), the relative proportions of each order changed to a much greater extent. In the samples taken from the inner part, the relative proportions of certain orders hardly changed, e.g., Sphingobacteriales and Flavobacteriales, denoted in light blue and purple, respectively. However, the proportions of other orders changed in a different manner in the samples from the inner part than those extracted from the central and outer parts of the chamber, e.g. Bacillales and Pseudomonodales denoted in dark blue and yellow, respectively: in these cases, an increase can be observed in the samples from the inner part alongside a decrease in the other samples. Consequently, different degradation processes may occur in different proportions in different parts of the chamber which accounts for the differences in the individual bacterial compositions.
Figure 2. Size of the experimental chamber, sampling locations (a: inner part of the chamber, b: central part of the chamber, c: outer part of the chamber next to the door) and DNA sequencing results. The order-level bacterial compositions are grouped by site per sample.
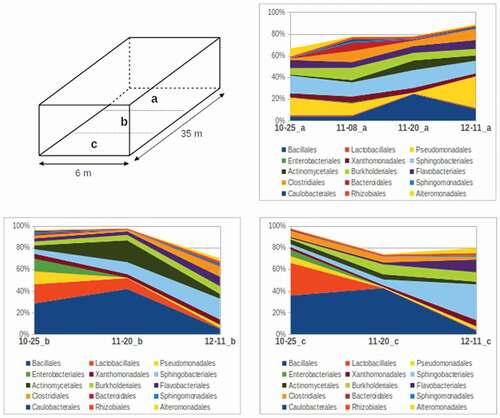
To investigate the degradation processes (aerobic/anaerobic) and phases in the test chamber, the genus-level compositions were also examined. Based on a review (Buchroithner Citation2015), the main degradation processes of the genera known in the literature on waste management and DNA sequencing were assigned to the bacterial genera found in the samples. Focusing on the acid-forming phase of anaerobic degradation, bacterial genera, whose presence and function may be responsible for the undesirable odor impact during maturation, were sought. This odor impact is the result of organic acids starting to form since the lack of oxygen prevents aerobic digestion (a one-step process where only CO2 and water are produced). The genera listed in the table below fall into this category, namely Acinetobacter, Bacteroides, Clostridium, and Pseudomonas. It is clear from the table and the area charts that the proportion of these genera in the samples from the inner part of the chamber was higher compared to the total composition at each sampling time (initially almost 15%, which may have also been caused by residues of material in the inner part of the chamber that have already matured). Samples taken from the central and outer parts of the chamber contained a much lower proportion of these bacteria (ventilation in these environments might have been more effective as the gaps along the door on the outside of the chamber could have provided a minimal amount of extra ventilation). It is also worth mentioning that these four genera were hardly present in the samples taken on November 20, however, once more they were present in a higher proportion in the overaged samples that were aged for an additional 3 weeks before being deposited (the chamber had not been opened for 21 days and no further turnings were performed, therefore, the oxygen supply did not improve during this period).
Dynamic changes of microbial structure and diversity
If suitable amounts of oxygen and water are present, metabolism takes place in one step producing CO2 and water from glucose and oxygen while generating a significant amount of thermal energy. However, anaerobic processes are characterized by the production of less thermal energy. Chamber temperature data from the existing monitoring system also support this assumption. The ideal, expected metabolic process restarted/accelerated following each turning: the temperature of the chamber increased significantly to approximately 70°C, but over time, it decreased once more and remained stable at around 50°C until the following turning. In other words, yet again a significant amount of energy was only produced when a sufficient oxygen supply was provided (ideal environmental conditions were only present on the surface of the loaded and subsequently turned pile). In the case of more frequent turnings or the utilization of alternative methods for the lower sections of the pile, the ratio of the ideal one-step metabolic process could be improved by increasing the oxygen supply, thereby reducing the conditions ideal for anaerobic processes and thus inhibiting acid formation.
Monitoring and optimization of process
The presented monitoring system is, therefore, suitable for connecting data that characterizes individual work processes (e.g., deposits of materials according to their type and quantity specified for the waste pile, or the breakdown of an already existing prism by applying the specified surface parameter), current local environmental and meteorological effects as well as feedback from citizens (in the form of odor detections) within the portal in real time. Therefore, work processes are as feasible as possible and produce minimal odor impacts, that is, the optimal operating point and range for the given environmental effects can be determined.
It is also possible to use automated alert functions in the monitoring system which can indicate to the operator the optimal operating period at the waste pile, as well as the so-called prohibited or discouraged periods where stable atmospheric conditions can lead to a significant odor impact affecting surrounding communities even in the case of relatively low levels of emissions.
The system also has a function called real-time odor transmission modeling that visualizes the theoretical odor plume transmitted directly below the weather data plotted on a map. By zooming in on the site on the map, Scenario 3 can be seen for the set period assuming the worst-case scenario, i.e. the highest level of emission, based on the current environmental parameters in order to determine where and to what extent a transmitted odor may have been present in the vicinity of the site (see for examples). Currently, the model runs automatically every 15 minutes and is always calculated according to the weather data over the previous 60 minutes before the time of the run.
Figure 3. The location of the landfill and examples for real-time modeling of odor transmissions (1: unstable atmospheric conditions for two hours, 2: unstable atmospheric conditions for five hours, 3: stable atmospheric conditions, distant effect, 4: changing wind speeds and directions at the end of the day).
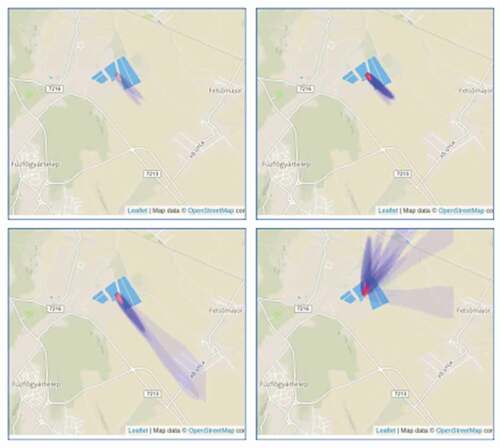
In addition to the output of the model, the location of any odor detections that may have been recorded in the area at the time are also labeled on the map. Therefore, if, for example, an odor detection is received in the form of an e-mail notification based on the set alert function, it is only necessary to go to the portal where it can be immediately seen whether the detector could have realistically detected an odor impact originating from the site within the previous 1 to 3 hours, depending on the wind speed and direction at the indicated place and time.
Main results and implications
Experience and main achievements of portal operation from recent years: drastic decreasing in number of odor perceptions (the decrease in the number of indicated observations was 85%) and the cessation of odor effects in certain areas (the decrease in maximal distance from landfill to odor detection positions was 45%), see details in .
Table 1. The main impact of the use of the monitoring system: number of odor observations and the maximal distance of observation within a radius of 8 km from the landfill
Conclusion and future work
In the case of a regional waste treatment and landfill facility, the combined usage of community and environmental (meteorological) data (in addition to operational data) can determine the optimal operating range, resulting in a win-win-win situation for the operator, residents, and authorities alike.
The EnviroMind portal described in this paper effectively increases public e-participation by giving the public a chance to share relevant information on odor detection quickly, enabling the real-time connection and use of previously scattered data sources, thus facilitating the correction of critical points in the waste management process. By allowing operators to see real-time odor transmission diagram and real-time citizens odor detection feedback (with exact parameters provided through web forms filled out by citizens), they have the opportunity to stop or modify the current activity (e.g. the spreading process of a given substance at the surface of landfill). Moreover on the basis of the data collected in this way, the individual steps of the technology process can be thoroughly examined: when were the most odors detected, and at that time, what operations took place at the site and how were these operations carried out (was there an human omission or could there be a problem with some technological step, etc.).
Once the critical points have been identified (as the biological treatment in our case study), correlations revealed by detailed studies can and must be utilized to improve the applied technology in the short term (according to the IPPC Directive). In the case of the waste treatment technology described in detail in this case study, such a detailed investigation revealed that increasing the maturation time during biological stabilization alone cannot lead to an optimal solution. Because without proper ventilation and the required amount of oxygen, anaerobic digestion processes will be present to a large extent or can recur later. It is crucial to make ventilation more efficient: with more frequent and more thorough turnings (e.g. over a period of 28 days, on days 7, 14, and 21 after loading or even more frequently); and/or by modifying the steps of the operating process (e.g. loading smaller quantities or using a different layout so the surface area of the loaded material exposed to air is increased); and/or by making other technological modifications (e.g. a significant modification of the ventilation system to improve the efficiency of the air supply). In a future study, it would be worthwhile to perform a test with the proposed modifications to investigate the bacterial composition (by DNA sequencing or the PCR: Polymerase Chain Reaction) specifically targeted at the main bacterial strains responsible for acidification) so that the effect of any modifications of technology step this can be verified at the bacterial level as well. Furthermore, it is also recommended to monitor the temperature of the chamber (even at different points) and compare the temperature profile(s) with the bacterial composition, as increasing and persistently high temperatures may indicate a higher rate of favorable processes of decomposition (aerobic decomposition produces energy). The temperature dropped below 50°C in the test chamber during the previous weeks when the bacterial genera responsible for anaerobic digestion processes, e.g. acidification resulting in the odor impact, appeared mainly in the central and inner parts. In the future, the optimal operating point could be simply maintained by properly monitoring the temperature because DNA sequencing (or PCR), which is rather costly and time-consuming, could be replaced by measuring the temperature.
The odor effect can be significantly reduced with these proposed modifications and the continued use of the EnviroMind monitoring system, as demonstrated in our case study. Furthermore, the collected data and model parameters can help select and plan the location of new sites or the odor transmission model can also be used to answer the “what if” type questions in simulation scenarios (e.g., if doubled amount of waste want to be processed, what would be the expected odor effect in the landfill, what would be the odor effect under different weather conditions, etc.).
The system can be used to other waste treatment facilities, but also for any other industrial facility (manufacturing plants, industrial parks) where significant odor effects may be present. For complete adaptation, the odor transmission model must be parameterized based on the given technological data, local and real-time weather data are required. However, by itself, only the collection of citizens odor observations can be done immediately anywhere in the world (an English-language smell detection form is available on the site: https://www.enviromind.hu/en/smell-detection and the real-time dashboard of detected smell observations is also available on the portal with one click to Detection in main menu of the portal, where everyone can review the submitted observations in map and tabular form, filter to any time and/or area on the map).
Based on operational experience, the extending and further developing of the portal’s functions to other areas has already started: land degradation and ecotourism, where monitoring would also rely on citizen data as one of the main sources of relevant information about problems (these enhancements are realized in the Landsupport portal, https://www.landsupport.eu/).
Authors’ contribution
The work was divided amongst the authors as follows: Ferenc Péter Pach: system design, research management and data analysis, László Morzsa: system development (hardware and software), Gergely Erdős: system development support (data security validation and graphic design of the user interface), Imre Magyar: modeling of odor transmission, and Zoltán Bihari: DNA sequencing and determination of bacterial composition.
Abbreviation
| AERMOD | = | American Meteorological Society/Environmental Protection Agency Regulatory Model |
| DNA | = | Deoxyribonucleic Acid |
| IPPC | = | Integrated Pollution Prevention and Control |
| MQTT | = | Message Queuing Telemetry Transport standard. |
Web references
(w1) Waag, technology & society portal: https://waag.org/en/lab/smart-citizens-lab
(w2) Safecast Japan: portal: https://blog.safecast.org/about/
(w3) 16S Metagenomic Sequencing Library Preparation: https://support.illumina.com/content/dam/illumina-support/documents/documentation/chemistry_documentation/16s/16s-metagenomic-library-prep-guide-15,044,223-b.pdf
(w4) AERMOD Implementation Guide: https://www3.epa.gov/ttn/scram/models/aermod/aermod_implementation_guide.pdf
(w5) Vector computations of wind: http://www.webmet.com/met_monitoring/622.html
Supplemental Material
Download MS Excel (89.5 KB)Disclosure statement
No potential conflict of interest was reported by the author(s).
Supplementary material
Supplemental data for this paper can be accessed on the publisher’s website.
Additional information
Funding
Notes on contributors
Ferenc Péter Pach
Ferenc Péter Pach graduated as master of engineering in information technology at Pannon University in 2004. Between 2004 and 2007 he participated in research and development projects of chemical systems and he received a PhD in 2008 (at Pannon University). Between 2007 and 2012 he worked as a data analyst in the pharmaceutical, telecommunication and retail sectors. He worked as a researcher between 2012 and 2015, with primary research in data mining and system and process development (secondary areas: biostatistics, bioinformatics). Since 2015 he has been working as a data scientist consultant in his own company, Tritoo Informatics Ltd. Peter works primarily in health and sustainability projects of the Institute of Advanced Studies Kőszeg.
László Morzsa
László Morzsa studied computer engineering at the Óbuda University. He completed his studies with a specialization in software technology at the University of Dunaújváros. He has experience in the development of geographic information systems, the design of databases and data cleaning. He works as a software and data engineer at the Institute of Advanced Studies Kőszeg in projects related to business and cultural networks and sustainability.
Gergely Erdős
Gergely Erdős studied at the Budapest University of Technology and Economics and at the Harvard Business School. He gained qualifications in big data and bioinformatics at the University of California, the University of Toronto and the Johns Hopkins University. His big data-based research focuses on the fields of healthcare, transport and environmental protection. The major objective of his research in the Institute of Advanced Studies Kőszeg is to identify the anomalies of patients pathways with colon and colorectal cancer.
Imre Magyar
Imre Magyar studied at the University of Veszprem and Budapest University of Technology and Economics. He got diploma M.Sc. in Chemical Engineering, later he got diploma of advanced level in Environmental Engineering and a postgraduate diploma in Occupational Health and Safety Engineering. He worked at the Pannon University as assistant professor and researcher. His educational and research activity was geographical information systems, environmental modeling and monitoring, and environmental information systems. Nowadays he works as environmental expert. His projects are related to environmental modeling (air pollutants, noise, hydrodynamics and transport in subsurface water, surface water), environmental and occupational monitoring (measuring workplace air properties, noise level, make air pollution and noise maps). He develops GIS based EHS information systems.
Zoltán Bihari
Zoltán Bihari is a molecular biologist who earned his PhD in biotechnology from the University of Szeged. During his research career, he was the Head of Department for Metagenomics and then the Head of the GMP-certified Laboratory of Medicine at Bay Zoltán Nonprofit Ltd. for Applied Research. Formerly, Zoltán was the Field Application Specialist of Illumina NGS products at GeneTiCA Ltd. His main areas of expertise are Next Generation Sequencing, metagenomics and human diagnostics. He has been coordinating R&D&I projects and supervising high-throughput NGS laboratories for 10 years. He is the Founder & CEO of an NGS service provider company, Xenovea Ltd.
Related Research Data
References
- Brattoli, M., G. de Gennaro, and V. de Pinto. 2012. Odor impact monitoring for landfills. In Integrated waste management integrated waste management - Volume I, ed. Sunil Kumar, 507–20. India: National Environmental Engineering Research Institute. doi:https://doi.org/10.5772/698.
- Buchroithner, D. 2015. Microbiology of landfill sites review of the present state of knowledge with particular focus on the carbon cycle. MsC Thesis, University of Natural Resources and Life Sciences, Vienna
- Carton, L., and P. Ache. 2017. Citizen-sensor-networks to confront government decision-makers: Two lessons from the Netherlands. J. Environ. Manage. 196:234–51. doi:https://doi.org/10.1016/j.jenvman.2017.02.044.
- Chen, W., A. Zhang, G. Jiang, and Q. Li. 2019. Transformation and degradation mechanism of landfill leachates in a combined process of SAARB and ozonation. Waste Manage. 85 (15):283–94. doi:https://doi.org/10.1016/j.wasman.2018.12.038.
- Jain, A., and R. Bagherwal. 2017. Design and implementation of a smart solid waste monitoring and collection system based on Internet of Things. 8th International Conference on Computing, Communication and Networking Technologies (ICCCNT), Delhi, India, 1–5. doi:https://doi.org/10.1109/ICCCNT.2017.8204165.
- Klindworth, A., E. Pruesse, T. Schweer, J. Peplies, C. Quast, M. Horn, and F. O. Glöckner. 2013. Evaluation of general 16S ribosomal RNA gene PCR primers for classical and next-generation sequencing-based diversity studies. Nucleic Acids Res. 41 (1):e1–e1. doi:https://doi.org/10.1093/nar/gks808.
- Morgan, B., R. Hansgen, W. Hawthorne, and S. L. Miller. 2015. Industrial odor sources and air pollutant concentrations in Globeville, a Denver, Colorado neighborhood. J. Air Waste Manage. Assoc. 65 (9):1127–40. doi:https://doi.org/10.1080/10962247.2015.1064833.
- Scandelai, A. P. J., L. C. Filho, D. C. C. Martins, T. K. F. de Souza Freitas, J. C. Garcia, and C. R. G. Tavares. 2018. Combined processes of ozonation and supercritical water oxidation for landfill leachate degradation. Waste Manage. 77:466–76. doi:https://doi.org/10.1016/j.wasman.2018.04.031.
- Viotti, P., F. Tatti, A. Rossi, A. Luciano, S. Marzeddu, G. Mancini, and M. R. Boni. 2020. An eco-balanced and integrated approach for a more-sustainable MSW management. Waste Biomass Valori. 11:5139–50. doi:https://doi.org/10.1007/s12649-020-01091-5.
- Wood, D. E., and S. L. Salzberg. 2014. Kraken: Ultrafast metagenomic sequence classification using exact alignments. Genome. Biol. 15:R46. doi:https://doi.org/10.1186/gb-2014-15-3-r46.
- Yi, X., Z. Zhang, and P. Smith. 2021. Real-time measurements of landfill atmospheric ammonia using mobile white cell differential optical absorption spectroscopy system and engineering applications. J. Air Waste Manage. Assoc. 71 (1):34–45. doi:https://doi.org/10.1080/10962247.2020.1820405.