
ABSTRACT
This paper presents a carbon footprint investigation of renewable power plants in a city in Turkey. With a total of 71 licensed power plants, this area is significant in terms of energy production resources such as hydroelectric, wind, solar, and lignite. As of April 2021, it has 4401.17 MW of installed power, accounting for 4.87% of Turkey’s installed power and ranked third in terms of installed power cities. This city has 18 natural gas power plants, 3 lignite power plants, 33 hydroelectric (stream), 7 hydroelectric (dam) power plants, 2 solar, 2 coal, 2 wind, 1 waste heat, and 3 biomass power plants. However, all production technologies produce CO2 and other greenhouse gases (GHGs), and emissions might be both direct and indirect. Once harmful gases are released into the atmosphere, they damage the ecosystem and all living things while also contributing to climate change. The Kyoto Protocol and the Paris Climate Agreement were signed to deal with climate change and propose a limitation on carbon emissions. Thus, countries have adopted some strategies to reduce their carbon footprint. For instance, Turkey is aiming to increase the share of domestic and renewable energy in electricity generation to reduce GHG emissions by up to 21% between 2020–2030. In this study, a carbon footprint effect analysis was carried out during electricity generation in a city with abundant renewable energy potential. According to the findings, it was determined that the renewable power plants successfully reduced the carbon footprint of the area as 3,500,794 tons CO2, 3,024,120 tons CO2, and 1,073,039 tons CO2 for 2019, 2020, and 2021 (end of April), respectively.
Implications: The main aim of this study is to investigate a carbon footprint effect during electricity generation in a region (Kahramanmaraş, Turkey) with abundant renewable energy potential in terms of electricity generation. This area is significant in terms of energy production resources including hydroelectric, wind, solar, and lignite, with a total of 71 licensed power plants.
The key contributions of this research study are:
(1) The study of carbon footprint savings based on the electricity generation of this city was carried out for the first time in the literature.
(2) While generating electricity with renewable energy sources, it has been determined that an average of 3,500,794 tons CO2, 3,024,120 tons CO2, and 1,073,039 tons CO2 carbon footprint savings were accomplished for 2019, 2020, and 2021 (end of April), respectively.
(3) This study demonstrated that a city with abundant lignite potential emits a high amount of carbon footprint into the atmosphere while producing energy. By using lignite, 4,462,045 tons CO2, 3,952,348 tons CO2, and 1,140,975 tons CO2 were emitted for 2019, 2020, and 2021 (end of April), respectively.
(4) The study includes encouraging research on renewable energy investment in accordance with the Kyoto Protocols and the Paris Agreement for local governments and investors.
(5) The study sheds light on the distance Turkey has covered on the way to the 2030 targets in the fight against cli-mate change, regionally
Introduction
The demand for energy is being accelerated by the growing global population and rapidly developing technologies (Kerem and Kirbas Citation2021). Electrical energy is also crucial for countries’ economic and social development (Gorgulu Citation2019).
The electricity generation industry is one of the largest contributors to greenhouse gas (GHG) emissions in many countries (MacGill, Outhred, and Nolles Citation2006). All electricity generation technologies emit CO2 and other GHGs into the atmosphere, both directly and indirectly. Emissions from the power plant during operation are considered direct, while emissions from other non-operational phases of the life cycle (LC) are considered indirect. Coal, gas, and oil-based nonrenewable energy technologies have the highest carbon footprint since they burn these fuels during operation. Hydroelectric, wind, solar, nuclear, wave/tidal, and biomass-based renewable energy technologies are considered low carbon as they do not emit CO2 during operation. These technologies emit CO2 at various phases of their LC which involves extraction, transportation, processing, building, maintenance, and decommissioning (Magaril et al. Citation2017; POST. Parlimentary Office of Science and Technology. Carbon Footprint of Electricity Generation Citation2006).
Toxic gases, especially CO2, are released into the atmosphere, causing a greenhouse effect, increasing global warming, and causing global climate change (Florides and Christodoulides Citation2009). Climate change is a major global environmental issue that has the potential to endanger the world economy and may cause international conflict and political crisis with its effects on society and biodiversity (Lima et al. Citation2020). To overcome climate change, many countries have committed to reducing anthropogenic GHGs by signing the Kyoto Protocol of 1997 (Babiker Citation2005). The Paris Agreement was then taken as a critical step in the global response to the threat of climate change. It aims to keep the global average temperature rise below 2°C and limit it to 1.5°C relative to pre-industrial levels (Rogelj et al. Citation2017). On 24 May 2004, Turkey became the 189th party to join the agreement. On 16 February 2005, the Kyoto Protocol came into force. This agreement aims to make countries responsible for keeping GHGs emitted into the atmosphere and the anthropogenic impact on the climate system at a certain level. In addition, this agreement has become more effective in international emissions trading, technology, and capital movements. Turkey aims to reduce GHG emissions by up to 21% between 2020 and 2030 (MENR Citation2021g). Furthermore, according to the European Green Deal, the EU aims to reduce GHG emissions by at least 55% by 2030 and zero GHG emissions by 2050 (EU. European Union Citation2021). Some literature studies on GHGs emitted through electricity generation are given in .
Table 1. Some literature studies on GHGs emitted through electricity generation
In this paper, the carbon footprint research of renewable power plants in the Kahramanmaraş City of Turkey was investigated. With a total of 71 licensed power plants, this city was chosen for research since it is a significant city in terms of energy production resources such as hydroelectric, wind, solar, and lignite (at 2021). This city accounts for 4.87% of Turkey’s installed power and is the third-largest city in terms of installed power in the country. 18 natural gas, 3 lignite, 33 hydroelectric (stream), 7 hydroelectric (dam), 2 solar, 2 coal, 2 wind, 1 waste heat, and 3 biomass power plants have been licensed in this city. However, all production technologies emit CO2 and other GHGs, which are released into the environment either directly or indirectly. Since these gases have adverse effects on global warming, environmental quality, and all living beings, in recent years, countries have adopted strategies to generate electricity with clean and eco-friendly renewable energy sources to reduce their carbon footprint.
The main aim of this study is to investigate a carbon footprint effect during electricity generation in a city with abundant renewable energy potential.
The key contributions of this research study are:
The investigation of carbon footprint savings based on the electricity generation of this city was carried out for the first time in the literature with this study.
While generating electricity with renewable energy sources, it has been determined that an average of 3,500,794 tons CO2, 3,024,120 tons CO2, and 1,073,039 tons CO2 carbon footprint savings were accomplished for 2019, 2020, and 2021 (end of April), respectively.
This study demonstrated that a city with abundant lignite potential emits a high amount of carbon footprint into the atmosphere while producing energy. By using lignite, 4,462,045 tons CO2, 3,952,348 tons CO2, and 1,140,975 tons CO2 were emitted for 2019, 2020, and 2021 (end of April), respectively.
The study includes encouraging research on renewable energy investment in accordance with the Kyoto Protocols and the Paris Agreement for local governments and investors.
The study sheds light on the distance Turkey has covered on the way to the 2030 targets in the fight against climate change, regionally.
The rest of the paper continues as follows. The carbon footprint concept is described in Section 2. An overview of energy resources and energy generation in Turkey and Kahramanmaraş City are given in Section 3. The carbon footprint assessment of power plants in Kahramanmaraş City is explained with methodology in Section 4. Results and discussions are presented in Section 5. Conclusions and recommendations are presented in Section 6.
Carbon footprint
The carbon footprint is a measure of the influence of human activity on the environment, with a focus on climate change impacts (Ciocan and Valter Citation2009). A carbon footprint is the total quantity of CO2 and other GHGs released by a process or product during its entire LC. It can be expressed in gCO2 eq/kWh (grams of CO2 equivalent per kilowatt-hour of generation) (POST. Parlimentary Office of Science and Technology. Carbon Footprint of Electricity Generation Citation2006).
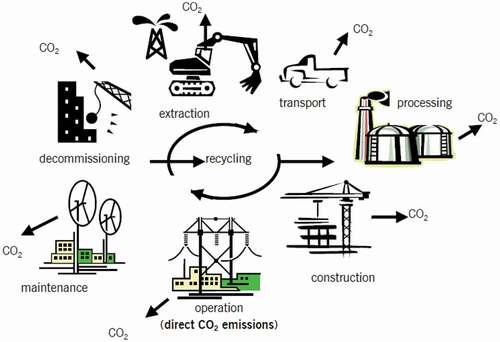
Carbon footprint emissions can occur both directly and indirectly caused by activity and are accumulated over the LC of the product (Wiedmann and Minx Citation2007). That is, while the carbon footprint can occur directly during the operation of the power plant, it also occurs at other non-operational stages of the LC. Fossil-fueled technologies such as coal, oil, and gas have a large carbon footprint since these fuels are used during operation. Non-fossil fuel-based technologies such as wind, solar, hydro, nuclear, wave/tidal, and biomass are called low carbon since they do not emit CO2 during their operation. These technologies, on the other hand, cannot be described as “carbon-free.” CO2 emissions occur during various phases of their LC, including during extraction, transportation, processing, construction, maintenance, and decommissioning, despite the fact that they do not occur during energy generation (POST. Parlimentary Office of Science and Technology. Carbon Footprint of Electricity Generation Citation2006). The LC of carbon emissions for electricity generation technologies is given in .
Figure 1. Life cycle (LC) of carbon emissions for electricity generation technologies (POST. Parlimentary Office of Science and Technology. Carbon Footprint of Electricity Generation Citation2006).
The LC of carbon footprints according to source types are given in . According to , fossil-based sources such as coal, oil, and gas have high carbon emissions, non-fossil-based sources such as solar, biomass, wave/tidal, hydroelectric, wind, and nuclear sources have low carbon emissions (POST. Parlimentary Office of Science and Technology. Carbon Footprint of Electricity Generation Citation2006).
Table 2. Life cycle (LC) of carbon footprints according to source types
In 2019, the energy sector accounted for 72% GHG emissions, followed by agriculture (14%), industrial processes and product usage (11%), and waste (3%) (TSI. Turkish Statistical Institute Citation2021). GHG emissions (million ton CO2 equivalent) by sectors in Turkey are given in .
Table 3. Greenhouse gas (GHG) emissions (million ton CO2 equivalent) by sectors in Turkey (TSI. Turkish Statistical Institute Citation2021)
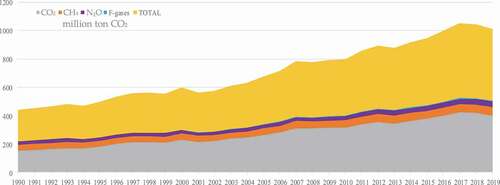
GHG emissions (million ton CO2 equivalent) in Turkey are given in . Total GHG emissions continued to increase from 1990 to 2017, however, they decreased in 2018 and 2019. While the highest GHG emissions were produced in 2017 with 525 million tons of CO2, the lowest figure was observed in 1990 with 219.6 million tons of CO2. (CO2: carbon dioxide, CH4: methane, N2O: nitrous oxide, F-gases: fluorinated gases) (TSI. Turkish Statistical Institute Citation2021).
Figure 2. Greenhouse gas (GHG) emissions (million ton CO2 equivalent) in Turkey.
Overview of energy generation in Turkey
In the last two decades, Turkey’s rapid economic and population growth has increased both energy demand and import dependency (IEA. International Energy Agency Citation2021). Turkey is a foreign-dependent country that imports 74% of its energy (MFA Citation2021). For this reason, Turkey has restructured its energy system to rationalize increasing energy demands, lower energy prices for consumers, and reduce the number of imports. Turkey has tripled its electricity production with renewable resources in the last ten years. It also plans to commission its first nuclear power plant in 2023 to meet its energy demand (IEA. International Energy Agency Citation2021).
The ”National Energy Efficiency Action Plan (2017–2023),” Turkey’s first energy efficiency action plan, came into effect in 2018. Turkey aims to save 23.9 million tons of oil equivalent (MTEP) cumulatively by investing USD 10.9 billion until 2023, thus, observing a 14% reduction in primary energy consumption by 2023. Furthermore, a saving of USD 30.2 billion is expected until 2033 (MENR Citation2021g).
The distribution of licensed electricity generation in Turkey for 2021 is given in (EMRA Citation2021). Electrical energy production was 26,500,154 MWh, 23,607,942 MWh, 27,071,150 MWh, and 25,013,328 MWh for January, February, March, and April, respectively. Thus, the highest production was observed in March. In addition, the largest production for January was natural gas with 8,331,236 MWh, while fuel oil was the lowest with 25,872 MWh. The largest production in February belongs to natural gas again, however, the production amount decreased by 20.39% compared to the previous month to 6,632,169 MWh. In March, natural gas continued to maintain its highest production rate and increased by 22.79% compared to the previous month to 8,143,709 MWh. Having the highest production rate in April, natural gas decreased to 5,649,660 MWh with a decrease of approximately 30.63% compared to the previous month.
Table 4. Distribution of licensed electricity generation in Turkey, 2021
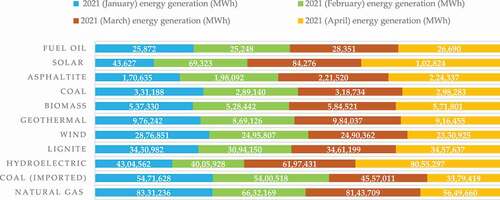
The distribution of licensed electricity generation (MWh) in Turkey, 2021 is given in (EMRA Citation2021). Energy production with fuel oil was realized at the highest level in March with 28,351 MWh. Solar energy production has continued to increase per month since January, and the highest generation was realized in April with 102,824 MWh. Energy generation with asphaltite has continued to increase per month since January and the highest generation was realized in April with 224,337 MWh. Energy generation with coal was realized at the highest level in January with 331,187.90 MWh. The highest amount of biomass used occurred in March with 584,521 MWh for energy generation. The highest geothermal use occurred in March with 984,037 MWh. The highest wind use occurred in January with 2,876,851 MWh, however, this decreased with each subsequent month. Energy generation with lignite was realized at the highest level in March with 3,461,199 MWh. Hydroelectric energy generation increased rapidly in March and April compared to the previous months, with the highest generation of 8,055,297 MWh occurring in April. Energy generation with coal (imported) was realized at the highest level in January with 5,471,628 MWh, and it continued to decrease with each subsequent month. The highest natural gas was used in January with 8,331,236 MWh.
Figure 3. Distribution of licensed electricity generation (MWh) in Turkey, 2021.
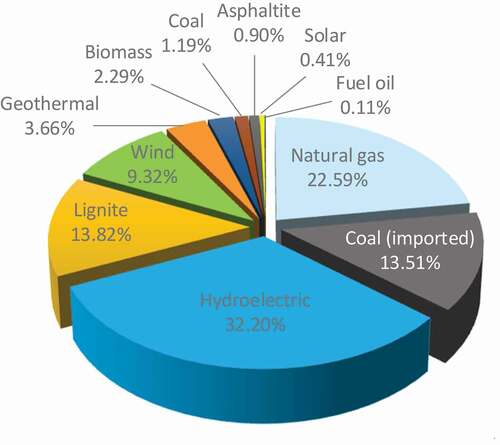
The distribution of licensed electricity generation (%) in Turkey, April 2021 is given in (EMRA Citation2021). Hydroelectric was the highest rate of energy production at 32.20%, followed by natural gas at 22.59%, lignite at 13.82%, coal (imported) at 13.51%, wind at 9.32%, geothermal at 3.66%, biomass at 2.29%, coal at 1.19%, asphaltite at 0.90%, solar at 0.41%, and fuel oil at 0.11%.
Figure 4. Distribution of licensed electricity generation (%) in Turkey, April 2021.
Energy sources and power plants of Kahramanmaraş city
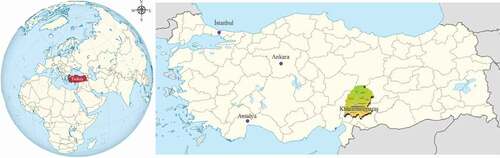
Kahramanmaraş City is the 11th largest city of Turkey with an area of 14,327 km2. The central district is at an altitude of 568 m above sea level. Mediterranean climate is observed in the south of the city and continental climate is observed in the north, in addition, summers are hot and winters are cold (Kahramanmaraş Metropolitan Municipality Citation2021). The geographical location of Kahramanmaraş City is given in .
Figure 5. Geographical location of Kahramanmaraş City, Turkey.
Biomass
This city has agriculturally suitable land. The city produces a total of 2,393,951 tons of cereals, vegetables, and fruits, including 509,822 tons of corn, 503,948 tons of sugar beet, 443,557 tons of wheat, and 90,284 tons of barley. On the other hand, 1,048,483 tons of waste is produced and the energy equivalent is approximately 439,717 tons of oil equivalent (TOE). There are a total of 2,559,683 animals in this city, and 2,537,995 tons of animal waste is produced annually and its energy equivalent is 32,794 TOE. The energy equivalence of the region’s (Hatay, Kahramanmaraş, Kilis and Gaziantep) forest waste approximately is 8421 TOE. Additionally, the energy equivalence of the city’s organic waste is 35,170 TOE per year. Energy equivalence amounts of wastes considered as Kahramanmaraş City biomass potential are given in (BEPA. Turkey Biomass Energy Potential Atlas Citation2021).
Table 5. Energy equivalence amounts of wastes considered as Kahramanmaraş City biomass potential
Wind
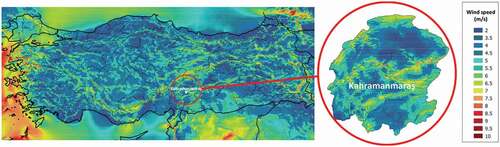
In Turkey, it has been determined that 5 MW wind power plants can be constructed per km2 in areas 50 m above ground level and with wind speeds above 7.5 m/s (MENR Citation2021g). The average wind speed of Kahramanmaraş City is 4 m/s, the average power density is 169,849 W/m2, and the average capacity factor is 20.6% (MENR Citation2021g). The annual average wind speed distribution of Kahramanmaraş City (at 100 m) is presented in (MENR Citation2021g).
Figure 6. Annual average wind speed distribution of Kahramanmaraş City (at 100 m).
Hydroelectric
The overall water potential of Kahramanmaraş City is 9614.8 hm3/year, with 9000 hm3/year above ground and 614.8 hm3/year underground. It receives an average of 620.6 mm of precipitation annually. There are 8 dams and 13 ponds in operation. The total installed power of the hydroelectric power plants in operation is 1707.92 MW, while the power plants under construction have a total installed power of 11.91 MW (SHW. General Directorate of State Hydraulic Works Citation2021). The total area of the dam lakes of this city, which is rich in reservoirs is 105.31 km2 (Kahramanmaraş Metropolitan Municipality Citation2021).
Solar
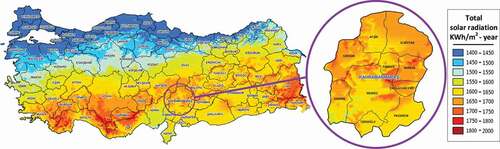
Kahramanmaraş City is located in the south of Turkey. The solar potential of Kahramanmaraş City is given in (MENR Citation2021g). As seen in , the total amount of solar radiation increases from north to south, and the annual solar potential of Kahramanmaraş City is 1650–1700 KWh/m2.
Figure 7. Solar potential of Kahramanmaraş City.
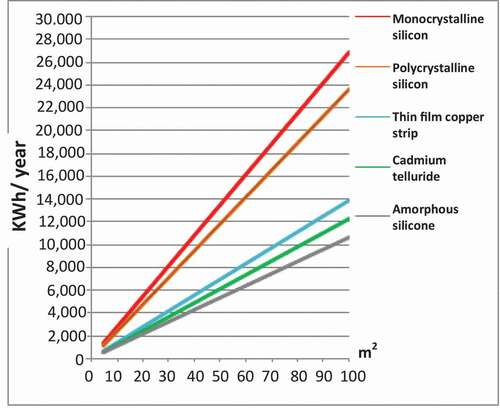
The solar energy generation potential considering PV types and panel space in Kahramanmaraş City, is given in (MENR Citation2021g). The generated energy varies according to PV types and panel areas, as seen in . Monocrystalline silicon PV installed on a 100 m2 space can generate roughly 27,000 KWh of energy per year, and polycrystalline silicon cell solar panels can generate roughly 23,900 KWh, in this city.
Figure 8. Solar energy generation considering the PV types and panel space in Kahramanmaraş City (MENR Citation2021g).
Lignite
Turkey has 19,320,000,000 tons of lignite reserves. Kahramanmaraş (Afşin-Elbistan) has 5,157,340,000 tons of lignite reserves, which corresponds to approximately 26.7% of the total of the country. Furthermore, since 79% of the country’s lignite reserves have a calorific value of less than 2500 kcal/kg, they are primarily utilized in thermal power plants (MRE. Mineral Research and Exploration General Directorate Citation2021). The boiler used in the power Afşin-Elbistan B thermal power plant is a Benson tower type and is approximately 110 m high. The boiler has a maximum steam production capacity of 1100 tons/h at 177 bar and 538°C (AEBTP Citation2021).
The total number of power plants in 2019, 2020, and 2021 are 68, 71, and 71, respectively. There are power plants in which the number of facilities has remained constant across the three years: hydroelectric (stream) (33), hydroelectric (dam) (7), wind (2), waste heat (1), natural gas (18), lignite (3), and coal (2). Furthermore, there were also power plants in which the number of facilities fluctuated over the three years, including biomass (2) for 2019 and (3) for 2020 and 2021, and solar (2) for 2020 and 2021. (Data of plant items, installed power (MW), and energy generation (MWh/year) for 2019, 2020, and 2021 have been officially obtained from the Republic of Turkey Energy Market Regulatory Authority (EMRA)).
The distribution of the licensed power plants of Kahramanmaraş City by resource and installed power is given in .
Figure 9. Distribution of the licensed power plants of Kahramanmaraş City by resource and installed power.
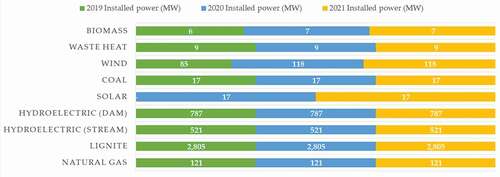
The installed power and annual power generation of the licensed power plants of Kahramanmaraş City are given in Table 6. In 2019, 2020, and 2021, hydroelectricity (stream + dam), which is a renewable energy source, had the highest generation accounting for 4,698,002 MWh, 4,005,213 MWh, and 1,403,809 MWh, respectively.
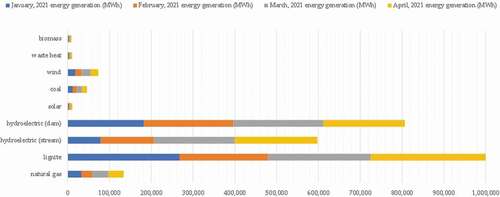
The distribution of Kahramanmaraş City’s licensed power plants energy generation (MWh) by resource in 2021 is given in . Total energy generation has continued to increase since January. The highest generation was realized in April with 770,697 MWh. In January, lignite had the largest value in generation with 267,358 MWh. Hydroelectric (stream + dam) had the biggest value in generation in February, March, and April. These values were 341,736 MWh, 408,972 MWh, and 391,950 MWh for February, March, and April, respectively.
Table 7. Distribution of Kahramanmaraş City’s licensed power plants energy generation (MWh) by resource, 2021
The maximum energy generation with natural gas was realized in March at a level of 37,966 MWh, while the minimum generation was realized in February with 26,590 MWh. The highest lignite use occurred in April with 302,726 MWh, and the least use with 212,136 MWh occurred in February. The highest hydroelectric (stream + dam) use occurred in March with 408,972 MWh, while the least use occurred in January with 261,153 MWh for energy production. Solar energy generation has continued to increase since January, with the highest generation realized in April with 3356 MWh, and the lowest level realized in January with 1895 MWh. Energy generation with coal was realized at the highest level in March with 12,059 MWh, with February generating the least amount with 10,543 MWh. The highest wind use occurred in March with 21,395 MWh, and the least use occurred in February with 15,175 MWh. The highest waste heat use occurred in March with 3157 MWh, and the least with 2049 MWh in January. Energy generation with biomass was realized at the highest level in March with 2439 MWh and the lowest generation was realized in February with 2046 MWh.
The distribution of billed electricity consumption and consumer type of Kahramanmaraş City (April 2021) is given in (EMRA Citation2021). The highest electricity consumption occurred in the industrial sector with 225,033 MWh, constituting approximately 68% of the total consumption. The least consumption occurred in agricultural irrigation with 1729 MWh, constituting approximately 1% of the total consumption.
Table 8. Distribution of billed electricity consumption and consumer type of Kahramanmaraş City (April 2021) (EMRA Citation2021)
The distribution of energy production (MWh) of Kahramanmaraş City’s licensed power plants according to resources for 2021 are given in .
Figure 10. Distribution of energy production (MWh) of Kahramanmaraş City’s licensed power plants according to resources (2021).
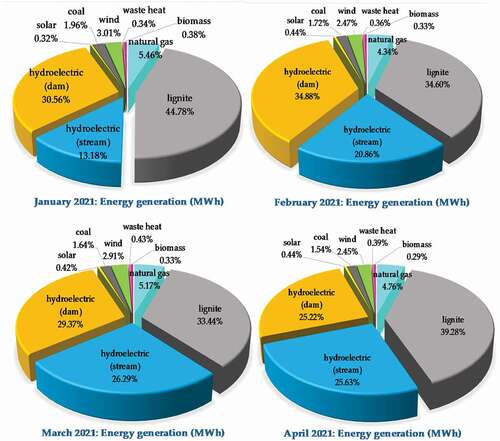
The distribution of energy production (%) of Kahramanmaraş City’s licensed power plants according to resources for 2021 are given in .
Figure 11. Distribution of energy production (%) of Kahramanmaraş City’s licensed power plants according to resources, 2021.
Methodology
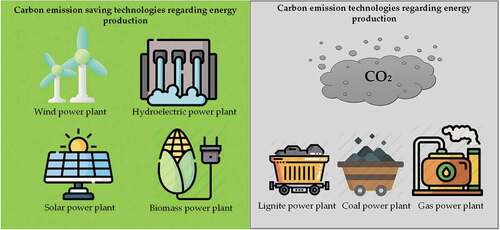
It is emphasized in Section 2 that although no GHG emissions are released to nature while energy is generated using renewable energy sources, GHG emissions occur during LC stages such as extraction, transportation, processing, construction, maintenance, and decommissioning (POST. Parlimentary Office of Science and Technology. Carbon Footprint of Electricity Generation Citation2006). Illustration of the licensed power plants of Kahramanmaraş City is shown in .
Figure 12. Illustration of the licensed power plants of Kahramanmaraş City.
In this section, the carbon footprint savings of Kahramanmaraş City licensed renewable energy power plants (hydroelectric (stream + dam), solar, wind, and biomass) during electricity generation are compared to fossil-based power plants.
Firstly, the carbon footprint saving research began with the determination of the energy generation values using renewable energy per year in the city. Quantities of energy generation using renewable energy at Kahramanmaraş City’s licensed power plants are given in Table 9. The highest amount of energy generated with renewable energy was 4,884,829 MWh in 2019. This value decreased to 4,219,702 MWh in 2020, a fall of about 14%. The generation is still continuing, and 1,497,264 MWh has been produced until the end of April 2021.
Secondly, the carbon footprint values which are the emission equivalents of each kWh were calculated in gCO2 using sources in . It indicates that there are two distinct categories of carbon emissions described as high and low. Fossil-based sources such as coal, oil, and gas constitute high carbon emissions. The carbon footprint values for coal, oil, and gas are >1000 gCO2/kWh, 650 gCO2/kWh, and 500 gCO2/kWh, respectively. However, solar, biomass, wave and tidal, hydroelectric, wind, and nuclear sources constitute low carbon emissions. These carbon footprint values are 58 gCO2/kWh (common) and 35 gCO2/kWh (thin-film technologies) for solar, 93 gCO2/kWh (miscanthus) and 25 gCO2/kWh (wood-chip) for biomass, 25–50 gCO2/kWh for wave and tidal, 10–30 gCO2/kWh (dam) and 5 gCO2/kWh (very small reservoirs) for hydroelectric, 4.64 gCO2/kWh (onshore) and 5.25 gCO2/kWh (offshore) for wind, and 5 gCO2/kWh for nuclear (POST. Parlimentary Office of Science and Technology. Carbon Footprint of Electricity Generation Citation2006). However, in this research study, since electricity energies are not produced with fossil resources and no emissions are released to nature, they are considered as carbon footprint savings and are given in .
Table 10. Annual carbon footprint savings
According to , a total 4,884,829 MWh of energy was generated with renewable energy sources in 2019. However, if this energy was generated using fossil-based sources, 4,884,829 tons CO2, 3,175,139 tons CO2, and 2,442,414 tons CO2 emissions would have been observed for coal, oil, and gas, respectively. Additionally, on average, 3,500,794 tons CO2 emissions would occur (this is the average tCO2 of coal, oil, and gas). Similarly, a total 4,219,702 MWh of energy was generated with renewable energy sources in 2020. However, if this energy was generated using fossil-based sources, 4,219,702 tons CO2, 2,742,806 tons CO2, and 2,109,851 tons CO2 emissions would have been observed for coal, oil, and gas, respectively. On average, 3,024,120 tons CO2 emissions would occur (this is the average tCO2 of coal, oil, and gas). Finally, a total 1,497,264 MWh of energy was generated with renewable energy sources in 2021. However, if this energy was generated using fossil-based sources, 1,497,264 tons CO2, 973,222 tons CO2, and 748,632 tons CO2 emissions would have been observed for coal, oil, and gas, respectively. On average, 1,073,039 tons CO2 emissions would occur (this is the average tCO2 of coal, oil, and gas). However, these energies were generated using renewable energy sources and were considered as a carbon footprint saving.
Results and discussion
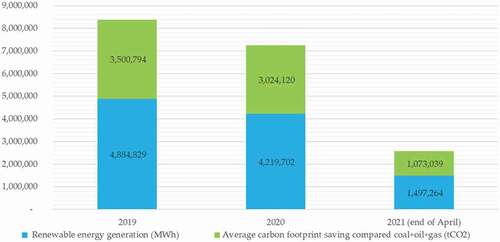
In 2019, electricity generation using renewable energy sources was 4,884,829 MWh and the average carbon footprint saving was calculated as 3,500,794 tons CO2. The following year (2020), electricity generation using renewable energy sources declined by around 14% to 4,219,702 MWh, while the average carbon footprint was reduced by approximately 14%to 3,024,120 tons of CO2. Energy generation is still continuing on by the end of April 2021, resulting in 1,497,264 MWh of energy produced with renewable energy sources and 1,073,039 tons of CO2 saved on average.
The average carbon footprint savings and renewable energy generation of Kahramanmaraş City’s licensed power plants are shown in .
Figure 13. The average carbon footprint savings and renewable energy generation of Kahramanmaraş City’s licensed power plants.
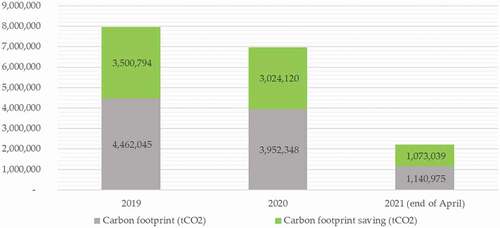
The total carbon footprint and carbon footprint saving of Kahramanmaraş City’s licensed power plants are given in . In 2019, while the amount of carbon footprint resulting from fossil-based sources was 4,462,045 tons CO2, the carbon footprint saving obtained by using renewable energies was 3,500,794 tons CO2. In 2020, the carbon footprint was decreased by approximately 11% to 3,952,348 tons CO2 compared to the previous year (2019), while the carbon footprint saving amount was decreased by approximately 14% to 3,024,120 tons CO2. In 2021 (end of April), energy generation is still continuing, thus the carbon footprint amount is 1,140,975 tons CO2 and carbon footprint saving is 1,073,039 tons CO2.
Figure 14. Total carbon footprint and carbon footprint saving of Kahramanmaraş City’s licensed power plants.
According to this study, it has been determined that a city with a high lignite potential releases a large amount of CO2 into the atmosphere while generating energy. It is undesirable and unacceptable in terms of environment and life quality. However, this city has plenty of renewable energy potential such as solar, wind, and biomass waiting to be exploited. On the other hand, for the first time in the literature, this study has demonstrated that carbon footprint savings were achieved while generating energy with the city’s current renewable energy power plants. It is clear that increasing the number of installed renewable power plants will result in a reduction in carbon emissions.This study also highlights Turkey’s regional progress on the road to 2030 targets in combating climate change, by drawing attention to renewable energy investments in accordance with the Kyoto Protocols and the Paris Agreement for local governments and investors.
Morever, the accuracy of energy estimation studies is of great importance due to some reasons such as performing the energy unit costs, efficient energy market, minimizing the risks of overloading the transformer centers, and so on. However, the accuracy rates vary depending on the type of energy and the estimation models. The predictability of electrical power generated from renewable energy sources such as solar, biomass and hydropower is more reliable than wind power. Because the wind has a random and discrete structure, which complicates the energy estimation and complicates its predictability in terms of energy production (Kerem and Saygin Citation2019; Kerem, Saygin, and Rahmani Citation2021; Saygin and Kerem Citation2017).
Furthermore, the construction of any power plant is a costly and time-consuming operation. All production technologies produce CO2 or GHG and release it into the atmosphere either directly (nonrenewable power plants) or indirectly (renewable power plants). In addition, whether it is a renewable or nonrenewable power plant, it is possible to discuss the intervention in the living spaces of living things in both cases. The protection of the environment and the habitats of all living things should be among the priorities. For these reasons, all aspects of the power plants that are planned to be constructed, such as production technologies, locations, habitat effects, and fuel types, should be evaluated at an optimal level before investments are made.
To my expertise, no other comprehensive study on the carbon footprint impact of renewable power plants has been conducted. It has been observed that most of the studies focus on carbon footprint analysis, the LC analysis of one or more power plants, and forecasting. Thus, it is hard to compare this study with any in the literature.
According to some carbon footprint studies, Bayazıt (Bayazıt Citation2021) investigated the effect of a hydroelectric power plant on carbon emissions. He determined that annual 408,534 tons CO2 carbon footprint savings of were achieved. Pimm et al. (Pimm et al. Citation2021) examined the impact of an electricity storage operation and its location on GHG emissions from the electricity system. They found a difference of 741 gCO2/kWh between storage techniques, which is roughly equivalent to the reduction in emissions per unit achieved by equipping it with carbon capture and storage. Vourdoubas (Vourdoubas Citation2021) calculated annual carbon emissions from electricity generation on the Island of Crete as 3.22 tons CO2.
According to some LC studies, Liu et al. (Liu et al. Citation2021) investigated the LC of carbon emissions of a 49.5 MW wind farm. They determined the carbon footprint of the wind farm in the grassland area was 18,701 tons CO2, with the highest rate occurring during the construction phase accounting for 56.74%. They concluded that the stages of production, disposal, transportation, and operation accounted for 28.18%, 12.08%, 2.76%, and 0.24%, respectively. They also determined the carbon footprint of material recycling was 18,727 tons CO2. Al-Behadili and El-Osta (Al-Behadili and El-Osta Citation2015) investigated the LC of carbon emissions of a 1.65 MW wind turbine. They determined the emissions savings to be 445,638 kg/year of NOx, 3,160,552 kg/year of SO2, and 250,473,762 kg/year of CO2.
Bakay and Ağbulut (Bakay and Ağbulut Citation2021) used deep learning (DL), support vector machines (SVM), and artificial neural networks (ANNs) to forecast GHG emissions based on energy generation. Levasseur et al. (Levasseur et al. Citation2021) compared different approaches to estimating hydroelectric reservoir emissions over the LC. They were quite successful in forecasting total GHG emissions using a DL. They obtained R2, RMSE, MBE, rRMSE, and MAPE values of 0.998, 2.046, 0.419, 0.406, and 0.021%, respectively.
Conclusion and recommendation
Countries have adopted carbon footprint reduction strategies to deal with climate change. The Kyoto Protocol and the Paris Agreement might be seen as two major milestones in this context.
In this study, the carbon footprint investigation of renewable power plants in Kahramanmaraş City, Turkey was investigated. There are two main reasons for choosing this city as a research location. The first is that there are 71 licensed power plants in the city with high potential energy sources such as hydroelectric, solar, wind, and lignite, and the second is that the carbon footprint savings of renewable power plants in the city have yet to be investigated in the literature. In addition, this study is significant as it sheds light on the distance Turkey has covered in progressing toward the 2030 targets for combating climate change, regionally.
According to the findings, in 2019, Kahramanmaraş City’s carbon footprint from fossil sources was 4,462,045 tons CO2, whereas the carbon footprint saving from renewable energy sources was 3,500,794 tons CO2. In 2020, the carbon footprint was 3,952,348 tons CO2, while the carbon footprint saving was 3,024,120 tons CO2. In 2021 (end of April), while the carbon footprint was 1,140,975 tons CO2, the carbon footprint saving was 1,073,039 tons CO2. It is pleasing that the gap between carbon footprint emissions and carbon footprint savings is decreasing year by year.
The city has great renewable energy potential, including wind, solar, and biomass, that has yet to be assessed. By increasing their installed power and producing more energy, it is possible to achieve more carbon footprint savings. Thus, it is foreseen that a beneficial contribution can be made to the fight against climate change, both on a national and global scale.
Turkey also has a voluntary carbon market, however, it only accounts for a minor fraction of the global carbon market. There are currently 308 projects aiming to reduce GHG emissions over 20 million tons CO2 (MEU Citation2021). Carbon trading, on the other hand, provides emission control and the development of clean technologies at less cost. However, efforts to establish an emissions trading system and transition to the compulsory market in Turkey are still ongoing (Eymirli Citation2021). Thus, it is anticipated that the establishment of an emissions trading system and mandatory market transition may increase carbon footprint savings.
In future works, the GHG emissions of LC of power plants should be investigated in Kahramanmaraş City.
Author contributions
A.K. is responsible for all stages of the article such as the idea, data gathering, writing—original draft preparation, methodology, and editing. All authors have read and agreed to the published version of the manuscript.
Disclosure statement
No potential conflict of interest was reported by the author(s).
Additional information
Notes on contributors
Alper Kerem
Alper Kerem is an Electrical Electronics Engineer. He received his BSc, MSc, and PhD degrees from Gazi University, Ankara, Turkey. Currently, he works as an Asst. Prof. Dr at Department of Electrical Electronics Engineering at Kahramanmaraş Sütçü İmam University. His research fields are electric power plants, energy systems, power electronics, and electric vehicles.
References
- AEBTP. 2021. Available online: https://tr.wikipedia.org/wiki/Af%C5%9Fin-Elbistan_B_Termik_Santrali (accessed on 27 August 2021).
- Al-Behadili, S. H., and W. B. El-Osta. 2015. Life cycle assessment of dernah (libya) wind farm. Renew. Energy 83:1227–33. doi:https://doi.org/10.1016/j.renene.2015.05.041.
- Babiker, M. H. 2005. Climate change policy, market structure, and carbon leakage. J. Int. Econ 65 (2):421–45. doi:https://doi.org/10.1016/j.jinteco.2004.01.003.
- Bakay, M. S., and Ü. Ağbulut. 2021. Electricity production based forecasting of greenhouse gas emissions in Turkey with deep learning, support vector machine and artificial neural network algorithms. J. Clean. Prod 285:125324. doi:https://doi.org/10.1016/j.jclepro.2020.125324.
- Bayazıt, Y. 2021. The effect of hydroelectric power plants on the carbon emission: An example of Gokcekaya dam, Turkey. Renew. Energy 170:181–87. doi:https://doi.org/10.1016/j.renene.2021.01.130.
- BEPA. Turkey Biomass Energy Potential Atlas. 2021. Available online: https://bepa.enerji.gov.tr/ (accessed on 13 July 2021).
- Ciocan, R. E., and C. Valter The carbon footprint- tool for monitorisation of the environmental impact. In Proceedings of the Internatıonal Conference Ecological Performance in a Competitive Economy, Bucharest, Romania, 12–13 November 2009.
- EMRA. Republic of Turkey energy market regulatory authority, report of March 2021. Available online: https://www.epdk.gov.tr/Detay/Icerik/3-0-23-3/elektrikaylik-sektor-raporlar ( accessed on 12 July 2021).
- EU. European Union. 2021. Available online: https://ec.europa.eu/clima/policies/eu-climate-action_en (accessed on 16 July 2021).
- Eymirli, E. B. İklim değişikliği ile mücadelede karbon ticareti. 2021. Available online: https://kalkinmaguncesi.izka.org.tr/index.php/2020/06/01/iklim-degisikligi-ile-mucadelede-karbon-ticareti/ ( accessed on 18 July 2021).
- Florides, G. A., and P. Christodoulides. 2009. Global warming and carbon dioxide through sciences. Environ. Int 35 (2):390–401. doi:https://doi.org/10.1016/j.envint.2008.07.007.
- Gorgulu, S. 2019. Investigation of renewable energy potential and usage in TR 61 region. J. Clean. Prod 236:117698. doi:https://doi.org/10.1016/j.jclepro.2019.117698.
- IEA. International Energy Agency. 2021. Available online: https://www.iea.org/countries/turkey (accessed on 12 July 2021).
- Kahramanmaraş metropolitan municipality, K. M. M. 2021. Available online: https://kahramanmaras.bel.tr/kesfedin/kahramanmarasin-cografyasi (accessed on13 July 2021).
- Kerem, A., and I. Kirbas. 2021. Multi-step forward forecasting of electrical power generation in lignite-fired thermal power plant. J. Eng. Sci. Des 9:1–13.
- Kerem, A., and S. Saygin. 2019. Scenario-based wind speed estimation using a new hybrid metaheuristic model: Particle swarm optimization and radial movement optimization. Measurement and Control 52 (5–6):493–508. doi:https://doi.org/10.1177/0020294019842597.
- Kerem, A., S. Saygin, and R. Rahmani. 2021. A green energy research: Forecasting of wind power for a cleaner environment using robust hybrid metaheuristic model. Environmental Science and Pollution Research. doi:https://doi.org/10.1007/s11356-021-16494-7.
- Latif, S. N. A., M. S. Chiong, S. Rajoo, A. Takada, -Y.-Y. Chun, K. Tahara, and Y. Ikegami. 2021. The trend and status of energy resources and greenhouse gas emissions in the Malaysia power generation mix. Energies 2200:1–26.
- Lausselet, C., K. M. Lund, and H. Brattebø. 2021. LCA and scenario analysis of a Norwegian net-zero GHG emission neighbourhood: The importance of mobility and surplus energy from PV technologies. Build. Environ 189:107528. doi:https://doi.org/10.1016/j.buildenv.2020.107528.
- Levasseur, A., S. Mercier-Blais, Y. T. Prairie, A. Tremblay, and C. Turpin. 2021. Improving the accuracy of electricity carbon footprint: Estimation of hydroelectric reservoir greenhouse gas emissions. Renew. Sustain. Energy Rev 136:110433. doi:https://doi.org/10.1016/j.rser.2020.110433.
- Li, J., Y. Tian, Y. Deng, Y. Zhang, and K. Xie. 2021. Improving the estimation of greenhouse gas emissions from the Chinese coal-to-electricity chain by a bottom-up approach. Resour. Conserv. Recycl 167:105237. doi:https://doi.org/10.1016/j.resconrec.2020.105237.
- Lima, M. A., L. F. R. Mendes, G. A. Mothé, F. G. Linhares, M. P. P. Castro, M. G. Silva, and M. S. Sthel. 2020. Renewable energy in reducing greenhouse gas emissions: Reaching the goals of the Paris agreement in Brazil. Environ. Dev 33:100504. doi:https://doi.org/10.1016/j.envdev.2020.100504.
- Liu, P., L. Liu, X. Xu, Y. Zhao, J. Niu, and Q. Zhang. 2021. Carbon footprint and carbon emission intensity of grassland wind farms in Inner Mongolia. J. Clean. Prod 313:127878. doi:https://doi.org/10.1016/j.jclepro.2021.127878.
- MacGill, I., H. Outhred, and K. S. Nolles. 2006. ome design lessons from market-based greenhouse gas regulation in the restructured Australian electricity industry. Energy Policy 34 (1):11–25. doi:https://doi.org/10.1016/j.enpol.2004.05.009.
- Magaril, E., R. Magaril, D. Panepinto, G. Genon, M. Ravina, L. Trushkova, and M. Zanetti. 2017. Production and utilization of energy and climate adaptation: Global tasks and local routes. Int. J. Sustain. Dev. Plan 12 (8):1326–37. doi:https://doi.org/10.2495/sdp-v12-n8-1326-1337.
- McCallum, C. S., N. Kumar, R. Curry, K. McBride, and J. Doran. 2021. Renewable electricity generation for off grid remote communities; life cycle assessment study in Alaska, USA. Appl. Energy 299:117325. doi:https://doi.org/10.1016/j.apenergy.2021.117325.
- MENR (2021g). Republic of Turkey ministry of energy and natural resources. Available online: https://gepa.enerji.gov.tr/MyCalculator/pages/46.aspx (accessed on 16 July 2021).
- MEU. Republic of Turkey ministry of environment and urbanisation. 2021. Available online: https://iklim.csb.gov.tr/gonullu-karbon-piyasalari-i-4391 (accessed on 17 July 2021).
- MFA. Republic of Turkey ministry of foreign affairs 2021. Available online: https://www.mfa.gov.tr/turkiye_nin-enerji-stratejisi.tr.mfa ( accessed on 14 July 2021).
- MRE. Mineral Research and Exploration General Directorate. 2021. Available online: https://www.mta.gov.tr/v3.0/arastirmalar/komur-arama-arastirmalari (accessed on 13 July 2021).
- Nindhia, T. G. T., M. McDonald, and D. Styles. 2021. Greenhouse gas mitigation and rural electricity generation by a novel two-stroke biogas engine. J. Clean. Prod 280:124473. doi:https://doi.org/10.1016/j.jclepro.2020.124473.
- Parascanu, M. M., M. Kaltschmitt, A. Rödl, G. Soreanu, and L. Sánchez-Silva. 2021. Life cycle assessment of electricity generation from combustion and gasification of biomass in Mexico. Sustain. Prod. Consum 27:72–85. doi:https://doi.org/10.1016/j.spc.2020.10.021.
- Pereira, L., and I. D. Posen. 2020. Lifecycle greenhouse gas emissions from electricity in the province of Ontario at different temporal resolutions. J. Clean. Prod 270:122514. doi:https://doi.org/10.1016/j.jclepro.2020.122514.
- Pimm, A. J., J. Palczewski, E. R. Barbour, and T. T. Cockerill. 2021. Using electricity storage to reduce greenhouse gas emissions. Appl. Energy 282:116199. doi:https://doi.org/10.1016/j.apenergy.2020.116199.
- Pomponi, F., and J. Hart. 2021. The greenhouse gas emissions of nuclear energy—life cycle assessment of a European pressurised reactor. Appl. Energy 290:116743. doi:https://doi.org/10.1016/j.apenergy.2021.116743.
- POST. Parlimentary Office of Science and Technology. Carbon Footprint of Electricity Generation. 2006. Available online: https://www.parliament.uk/globalassets/documents/post/postpn268.pdf ( accessed on 10 July 2021).
- Rasheed, R., H. Javed, A. Rizwan, F. Sharif, A. Yasar, A. B. Tabinda, S. R. Ahmad, Y. Wang, and Y. Su. 2021. Life cycle assessment of a cleaner supercritical coal-fired power plant. J. Clean. Prod 279:123869. doi:https://doi.org/10.1016/j.jclepro.2020.123869.
- Rogelj, J., O. Fricko, M. Meinshausen, V. Krey, J. J. J. Zilliacus, and K. Riahi. 2017. Understanding the origin of Paris agreement emission uncertainties. Nat. Commun 15748:1–12.
- Saygin, S., and A. Kerem. 2017. Wind power forecasting: A case study in terrain using artificial intelligence. International Research Journal of Engineering and Technology 4 (6):301–07.
- SHW. General Directorate of State Hydraulic Works. 2021. Available online: https://bolge20.dsi.gov.tr/Sayfa/Detay/1131 (accessed on 12 July 2021).
- Teffera, B., B. Assefa, A. Björklund, and G. Assefa. 2021. Life cycle assessment of wind farms in Ethiopia. Int. J. Life Cycle Assess 26 (1):76–96. doi:https://doi.org/10.1007/s11367-020-01834-5.
- TSI. Turkish Statistical Institute. 2021. Available online: https://data.tuik.gov.tr/Bulten/Index?p=Greenhouse-Gas-Emissions-Statistics-1990-2019-37196 ( accessed on 10 July 2021).
- Vourdoubas, J. 2021. Islands with zero net carbon footprint due to electricity use. The case of crete, Greece. Eur. J. Environ. Earth Sci 2:37–43.
- Wiedmann, T., and J. Minx. 2007. A definition of carbon footprint, ecological economics research trends, chapter 1. New York, NY, USA: Nova Science Publishers.