
 ?Mathematical formulae have been encoded as MathML and are displayed in this HTML version using MathJax in order to improve their display. Uncheck the box to turn MathJax off. This feature requires Javascript. Click on a formula to zoom.
ABSTRACT
Assessing the aircraft engine nonvolatile particulate matter (nvPM) emissions during landing and take-off (LTO) cycles is significant for airport air quality management. However, presently few prior studies have examined aircraft engine nvPM emissions on a daily basis for optimizing flight operations at airports. Therefore, based on the latest first-order approximation method of engine nvPM emissions, we introduce the engine emission data and aircraft flight data to establish an integrated method for estimating daily aircraft engine nvPM emissions at airports. This method can be applied to obtain different engine nvPM mass and number emissions in each phase of the LTO cycle, and therefore the total nvPM mass and number emissions in different time periods can be estimated for the analysis of the sources and trends of daily aircraft engine nvPM emissions during LTO cycles at Hangzhou Xiaoshan International Airport. Results show that the highest aircraft engine nvPM mass and number emissions are generally predicted to occur in the climb and taxi/ground idle phase, respectively. The proportion of total engine nvPM mass and number emissions in each phase of the LTO cycle could also be estimated, specifically the take-off phase (21% & 6%), climb phase (52% &15%), approach phase (8% & 27%), and taxi/ground idle phase (19% & 52%). In addition, the trends of hourly engine nvPM mass and number emissions during LTO cycles within a day are similar, but the predicted highest total hourly engine nvPM mass and number emissions occur in different time periods (7:00–8:00 a.m. & 11:00–12:00 a.m.) at the airport, and the total hourly engine nvPM mass and number emissions at 6:00 a.m. to 17:00 p.m. are generally higher than those of the rest periods. These results are valuable for optimizing flight operations for mitigating the environmental impact of aircraft engine nvPM emissions.
Implications: The integrated method for estimating engine nvPM mass and number emissions in the LTO cycle based on FOA4.0 method reported in this study is effective to assess the sources and trends of daily aircraft engine nvPM emissions during LTO cycles at airports, which is valuable for optimizing flight operations considering the environmental impact of aircraft engine nvPM emissions. When the relevant aircraft flights, engine parameters, and engine nvPM emission databases embedded in the integrated method for any airport are established, the method is feasible to assess the sources and trends of aircraft engine nvPM emissions during LTO cycles at any time period in the airport.
Introduction
With the sustainable development of global air transportation, the number of commercial flights at civil airports has been continuously increasing by 2019 (ICAO Citation2019). Despite the negative impact of the global pandemic of COVID-19 on the civil aviation industry, the long-term upward trend of global air transportation and the consequent increase in aircraft exhaust emissions are still foreseeable. The rising exhaust emissions from aircraft engines in commercial flights are causing airport air quality deterioration (Bo et al. Citation2019; Hudda et al. Citation2020; Masiol and Harrison Citation2014; Yang et al. Citation2018) and health issues to passengers, airport workers and the residents of the communities near airfields (Targino, Machado, and Krecl Citation2017; Yim et al. Citation2015; Yim, Stettler, and Barrett Citation2013). Particulate matter (PM) is an important part of pollutants emitted by aircraft engines. It not only has a significant impact on the outdoor environment at airports but can also easily move from the outdoor environment into the indoor environment (Hudda et al. Citation2018; Ren, Cao, and Liu Citation2018). Overall, the mentioned previous studies have shown that the impact of PM emissions on airport air quality and human health could not be ignored. Actually, PM emissions were not regulated by aircraft engine emissions standards of the International Civil Aviation Organization (ICAO) until 2020. In the past 10 years, only four pollutants were specifically regulated in the ICAO engine emissions standards, namely smoke number (SN), mass of unburned hydrocarbons, carbon monoxide, and nitrogen oxides (ICAO Citation2008), in which the SN standard was developed to limit the visibility of black smoke in the exhaust plume of aircraft engines. Although SN helps to estimate the visibility of plumes, it is not a suitable index to quantify the impact of air quality on human health. Thus, it is significant to measure the engine PM emissions for assessing its impact on air quality related to human health. Recent studies show that it is effective to reduce the PM emissions from aircraft engines for improving the airport air quality (Lopes et al. Citation2019; Saffaripour et al. Citation2020), and strategies targeted at reducing the negative influence of aviation emissions on airport air quality are proposed, including taxi-out times reduction, ground support equipment electrification and aviation biofuel implementation (Benosa et al. Citation2018). Until February 2019, the nvPM emission mass and number standards were approved by the eleventh meeting of ICAO Committee on Aviation Environmental Protection (CAEP), the relevant certification standard of aircraft engine nvPM emissions was considered by the ICAO council for adoption in 2020. According to the standard, the nvPM is defined as emitted particles that exist at a gas turbine engine exhaust nozzle exit plane, which does not volatilize when heated to a temperature of 350°C (ICAO Citation2020a). In light of growing interest in airport environmental sustainability (Greer, Rakas, and Horvath Citation2020; Liu et al. Citation2021; Migdadi Citation2020), systematical assessment of the airport sustainability that accounts for characteristics of different emissions is necessary to develop relevant green operation strategies. In order to provide an effective tool for airport operators to reduce the impact of nvPM emissions during LTO cycles, it is essential to develop a method for quantifying the characteristics of aircraft engine nvPM emissions during LTO cycles at airports.
However, the prediction method of aircraft engine nvPM emissions at a specific airport has not received enough attention from aviation environmental researchers. Currently, the existing related studies are mainly about measuring the engine nvPM emissions accurately with standardized systems (Lobo et al. Citation2020; Lobo, Hagen, and Whitefield Citation2012; Lobo et al. Citation2015; Petzold et al. Citation2011; Stacey Citation2019), developing novel estimation methods of engine nvPM emissions with higher accuracy (Agarwal et al. Citation2019; Abrahamson et al. Citation2016; Stettler et al. Citation2013), and assessing trends of aviation gaseous emissions over long periods of time (Yu et al. Citation2021; Zhang, Chen, and Wang Citation2019). As to the nvPM emissions emitted by aircraft engines in the LTO cycle, its standard measurement procedure is given in the latest aircraft engine emissions standards (ICAO Citation2020a), in which the PM mass measurement instruments make a measure of black carbon (BC) mass, and it calls for optical methods (photoacoustic spectroscopy and laser-induced incandescence) to be used to measure nvPM mass emissions. In addition, the nvPM emissions from jetliners or business jets were studied (Durdina et al. Citation2019, Citation2017). Meanwhile, the estimation method of PM emissions produced by aircraft engines in the LTO cycle is continuously improved, the latest first-order approximation (FOA4.0) method (ICAO Citation2020b) for estimating PM mass and number emissions from aircraft engines is based on its previous version and the SCOPE11 method for estimating aircraft engine black carbon emissions (Agarwal et al. Citation2019; Wayson, Fleming, and Iovinelli Citation2009). Admittedly, the results of PM emissions calculated by the FOA4.0 method are unable to be used for engine emission performance certification, but ICAO recognizes that the FOA4.0 method can be effectively used to estimate PM emissions from certified commercial aircraft engines in the airport.
Therefore, we use the engine performance data from ICAO EEDB and the flight data of relevant airports to establish an integrated method for estimating aircraft engine nvPM emissions during LTO cycles based on FOA4.0 method in the paper. The data of flight time, number of flights, aircraft type and engine type operated at airports are needed to estimate the total engine nvPM emissions at different time periods, which consists the aircraft flights database in the integrated method. The engine performance data of most civilian aircraft could be obtained from the ICAO Engine Emission Databank (EEDB) open to the public, in which the engine smoke number, fuel flow and bypass ratio consist the engine parameter database in the method. After that, we could calculate the total engine nvPM mass and number emissions for different aircraft during LTO cycles in any time period, which could be used for predicting the whole sources and trends of aircraft engine nvPM emissions during LTO cycles at airports. Normally, the daily frequent commercial flights of any international airport are almost constant, so we focus on predicting the sources and trends of daily aircraft engine nvPM emissions during LTO cycles at a certain busy international airport. Here we further use the integrated method to assess the sources and trends of daily aircraft engine nvPM emissions during the LTO cycle at Hangzhou Xiaoshan International Airport in 2019, which is of referential significance to the optimization of flight operations in airports in terms of the environmental impact of aircraft engine nvPM emissions.
Methodology
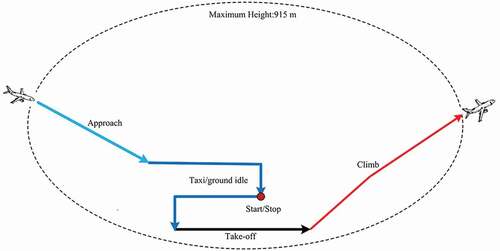
The reference LTO cycle simulates the actual aircraft landing and take-off process at airports, which is an important model effectively used in implementing aircraft engine emission certification. The reference LTO cycle is divided into four (excluding the cruise phase) phases: take-off, climb, approach, taxi or ground idle, and the upper flight limit of the LTO cycle is defined within the height of 915 m from the ground to the atmospheric boundary plane (see ). According to the aircraft engine emissions standard, the engine exhaust emissions during the reference LTO cycle will affect the type certification of engine emission performance. To establish an approximate method for estimating aircraft engine nvPM emissions during LTO cycles at the airport, we use the reference LTO cycle to simulate the actual landing and take-off process of an aircraft, without considering possible differences in actual working time at different phases of the LTO cycle.
Figure 1. Schematic view of LTO cycle.
Currently, most civil aircraft engines are designed by several main manufacturers, including the Rolls-Royce, General Electric, Pratt & Whitney, CFM international et al. The engine exhaust emission performance is certified according to relevant procedures approved in aircraft engine emission standards, and the exhaust emission data of certificated engines is available to the public in the ICAO EEDB. When the engine exhaust emissions produced in the reference LTO cycle are lower than relevant regulatory limit values, the corresponding engine exhaust emission performance will be certified to meet airworthiness requirements. According to the up-to-date aircraft engine emission standards (ICAO Citation2017), the specified engine conditions in different operating mode k of LTO cycle is shown in , where F* represents the engine rated thrust, and the unit of operating time is second.
Table 1. Specified engine conditions in the LTO cycle (ICAO Citation2017)
According to the FOA4.0 method, the engine nvPM mass and number emissions in each operation mode are given in the form of emission index (EInvPMm and EInvPMn), which is the nvPM mass and number emissions produced by per kilogram fuel burn. As to turbofan engines widely used by civil aircraft, the estimation of nvPM mass emissions is based on the engine’s SN in each operation mode k (SNk), the air-to-fuel ratio in each operation mode k (AFRk) and its bypass ratio (BPR) for mixed turbofan (MTF) engine. Presently, there is no real measure data of engine AFR in the ICAO EEDB because it may involve protected know-how in the engine design. Instead, the average fleet AFRs in the LTO cycle are used in the ICAO EEDB, which is the common practice of the main civil aircraft engine manufacturers around the world (see ). The essence of the technique is to convert the SN via an experimental correlation into a nonvolatile mass concentration (C), which is the mass of nvPM per unit volume of exhaust. We could calculate the volume of the exhaust (Q) per kilogram of fuel with engine AFR and BPR, and then the emission index (EI) is equal to the product C and Q. It should be noted that the correlation of converting SN into a nonvolatile mass concentration is based on certification-like measurements, which corresponds to an estimation of mass concentration at the instrument level. As the engine nvPM measurement is affected by the physical loss mechanism during the sampling process (Durand, Crayford, and Johnson Citation2020; Kinsey et al. Citation2021; Kittelson et al. Citation2021), the predicted nvPM emissions at the instrument level are lower than that at the engine exit plane, and the loss correction is further needed for emission inventories. The FOA4.0 method provides an empirical correction for sampling loss, and the estimation accuracy of EInvPMm at engine exit plane for a single mode k (EInvPMm,e,k) is obviously related to the measurement accuracy of engine SN and AFR. Generally, the estimation of engine nvPM emissions is divided into four steps (ICAO Citation2020b):
Table 2. Engine average AFR data in the LTO cycle (ICAO Citation2020b)
Step 1: The nvPM mass concentration at the instrument (Ck) of the ICAO standardized measurement system is estimated with its relevant engine SNk in different operation mode, it can be calculated by EquationEquation (1)(1)
(1) .
Step 2: The engine nvPM mass emissions in each operation mode k at the instrument (EInvPMm,k) is calculated by multiplying Ck with the specific exhaust volume (Qk) by EquationEquation (2)(2)
(2) , and Qk is calculated with the value of β depending on the engine exhaust configuration by EquationEquation (3)
(3)
(3) . For the MTF engines, the value of β is the same as that of BPR, and the value of β is 0 for all other engines.
Step 3: The Ck determined by EquationEquation (1)(1)
(1) is always lower than that at the engine exit plane due to particle losses in the sampling system. For emission inventories, the EInvPMm,e,k requires an engine mode-dependent correction for particle losses, and the mode-dependent system loss correction factor (kslm,k) of the ICAO standardized particle sampling system is calculated by EquationEquation (4)
(4)
(4) . Finally, the engine EInvPMm,e,k is calculated by multiplying EInvPMm,k with kslm,k by EquationEquation (5)
(5)
(5) .
Step 4: With the engine EInvPMm,e,k calculated by EquationEquation (5)(5)
(5) , the nvPM number emissions at engine exit plane in each operation mode k (EInvPMn,e,k) could be determined by EquationEquation (6)
(6)
(6) , in which the engine mode-dependent geometric mean diameters (GMDk) of nvPM particles is given in .
Table 3. Standard values of GMDk in the LTO cycle (ICAO Citation2020b)
where the assumed average nvPM particle effective density (ρ) is 1000 kg/m3, the assumed geometric standard deviation of the nvPM particle size distribution (σ) is 1.8, and the unit-scale factor (Nr) is 1024kg·nm3/g·m3.
It is clear that the FOA4.0 method could only estimate nvPM mass and number emissions from single engine in the LTO cycle, but we actually need the data of aircraft engine nvPM mass and number emissions in different flight for assessing the overall trend of daily aircraft engine nvPM emissions for airport air quality management. In order to optimize the aviation environmental management strategy implemented by airport operators, the trends of aircraft engine nvPM emissions in the LTO cycle must be considered. Based on the FOA4.0 method for estimating different engine nvPM emissions, the total engine nvPM mass and number emissions during each phase of the LTO cycle could also be obtained with relevant engine fuel flow (FF) data in ICAO EEDB, which could be used as part of the basic data to analyze the sources and trends of aircraft engine nvPM emissions in different time periods at the airport. Therefore, we introduce the relevant data of flight operations to establish an integrated method for predicting sources and trends of aircraft engine nvPM emissions at airports based on the FOA4.0 method (see ), which could provide more comprehensive data to assess the impact of engine nvPM emissions on airport air quality.
Figure 2. Integrated method for estimating engine nvPM emissions at airports.
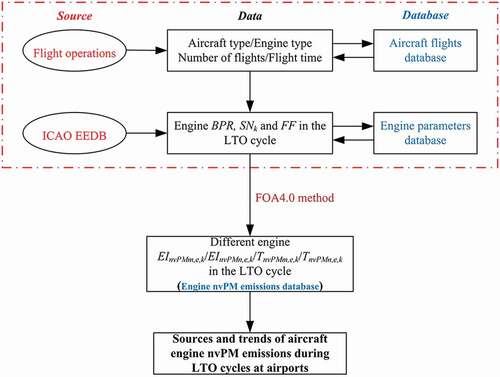
Among the integrated method, it is the first time that parameters such as aircraft type, engine type, number of flights and related flight time obtained from actual flight operations at airports are used together to construct the aircraft flights database, and different engine parameters BPR, SN and FF obtained from ICAO EEDB are used to construct the engine parameters database (see the red dashed box of ). Based on the FOA4.0 method, different engine EInvPMm,e,k and EInvPMn,e,k in the LTO cycle could be calculated with EquationEquations (1(1)
(1) –Equation6
(6)
(6) ), and the total nvPM mass and number emissions for each operating mode at the engine exit plane (TnvPMm,e,k and TnvPMn,e,k) could be calculated with its operating time and FF data in each phase of LTO cycle, which are used to construct the engine nvPM emission database at airports. By further introducing the flight data of airports, we could estimate the total engine nvPM mass and number emissions in the LTO cycle from different aircraft operating in any specific time, so as to predict the sources and trends of aircraft engine nvPM emissions in the LTO cycle. Unlike directly measuring nvPM mass and number emissions from aircraft engines, the integrated method is a novel data-driven approach to analyzing the sources and trends of aircraft engine nvPM emissions at airports, which avoids the great difficulties and costs of implementing a large number of measurements. When we establish relevant aircraft flights and engine parameters databases embedded in the method, the aircraft engine nvPM emission database of the airport could surely be obtained. After that, the sources of aircraft engine nvPM emissions at the airport could be assessed based on the percentage of nvPM mass and number emissions in each phase of the LTO cycle. Similarly, the trends of aircraft engine nvPM emissions in specific time periods at airports could also be assessed in terms of different flight time. Overall, the relevant data of ICAO EEDB and flight operations are fully employed to analyze the sources and trends of total aircraft engine nvPM emissions during LTO cycles at airports.
Results and discussion
Example calculation of engine nvPM mass and number emissions
In order to analyze the sources and trends of nvPM emissions produced by aircraft engines working in the LTO cycle at airports, it is necessary to calculate engine nvPM mass and number emissions in the LTO cycle from different aircraft. Because new data introduced into the integrated method could be obtained from flight operations at airports, we only need to prove that the sources of certain aircraft engine nvPM mass and number emissions in the LTO cycle could be assessed by the integrated estimation method for validating its effectiveness. Here we chose the unmixed turbofan engine CFM56-7B26E as an example, a typical dual-channel turbofan engine used in B737NG airplanes. Normally, the relevant aircraft engine emissions certification information could be obtained from ICAO EEDB, including its corrected nvPM mass and number emission index at the engine exit plane (EInvPMm_SL and EInvPMn_SL). According to the definition of relevant parameters, the values of EInvPMm_SL and EInvPMn_SL provided by engine manufacturers in ICAO EEDB are corresponding actual values of parameters EInvPMm,e,k and EInvPMn,e,k estimated by the integrated method respectively. Firstly, the relevant data of CFM56-7B26E engine SN, FF, EInvPMm_SL and EInvPMn_SL in the LTO cycle (see ) are obtained from ICAO EEDB on the website of the European Aviation Safety Agency (EASA) (EASA Citation2021).
Table 4. CFM56-7B26E engine relevant given data in the LTO cycle (EASA Citation2021)
According to the integrated method, the engine EInvPMm,e,k in each phase of the LTO cycle could be calculated separately with its SN based on the FOA4.0 method. In the take-off phase, the estimated nvPM mass concentration at the instrument (Ck) could be calculated to be 1768.614 μg/m3 with EquationEquation (1)(1)
(1) . The engine AFR in the take-off phase is 45 (see ), and its EInvPMm,k is calculated to be 63.4 mg/kg with EquationEquation (2)
(2)
(2) . After that, the CFM56-7B26E engine EInvPMm,e,k in the take-off phase could be calculated to be 76.0 mg/kg with EquationEquation (5)
(5)
(5) , and the engine EInvPMn,e,k in the take-off phase is calculated to be 4.8E+14 with EquationEquation (6)
(6)
(6) . With the estimated value of CFM56-7B26E engine EInvPMm,e,k and EInvPMn,e,k in the take-off phase of LTO cycle, the engine TnvPMm,e,k and TnvPMn,e,k in the take-off phase is calculated to be 3871.2 mg and 2.4E+16 with its engine fuel flow and operating time in the phase. Repeatedly, we could obtain the CFM56-7B26E engine EInvPMm,e,k and EInvPMn,e,k in other phases of LTO cycle, as well as its TnvPMm,e,k and TnvPMn,e,k in each phase of the LTO cycle (see ).
Table 5. CFM56-7B26E engine nvPM mass and number emissions in the LTO cycle
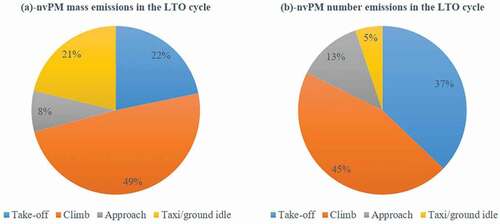
On this basis, the engine nvPM mass and number emissions produced in other phases of the LTO cycle could also be obtained. After that, we calculate and compare the percentage of total CFM56-7B26E engine nvPM mass and number emissions in each phase of the LTO cycle. It is found that both the nvPM mass and number emissions in the climb phase (about 49% and 45%) are remarkably larger than that in other phases of the LTO cycle, for which the main reason is that the CFM56-7B26E engine operates in the climb phase with a relatively larger fuel flow and operating time (see ). In addition, we find differences in the percentage of nvPM mass and number emissions in the same phase of the LTO cycle, which further shows that it is reasonable and necessary to use two indexes to describe the engine nvPM emissions at the same time. These results suggest that it is critical to reduce the engine nvPM mass and number emissions in the climb phase for reducing total nvPM emissions from B737NG airplanes in the LTO cycle.
Figure 3. CFM56-7B26E engine nvPM mass and number emissions in the LTO cycle.
Meanwhile, the relative errors of CFM56-7B26E estimated EInvPMm,e,k and EInvPMn,e,k are also analyzed with the relevant given values of EInvPMm_SL and EInvPMn_SL in ICAO EEDB (see ), we could find that the accuracy of estimated results in different phase of the LTO cycle varies greatly. Both of the relative errors for EInvPMm,e,k and EInvPMn,e,k in the take-off phase are 5.1% and 56.5%, and both of the relative errors for EInvPMm,e,k and EInvPMn,e,k in the take-off and climb phase are notably lower than that in the approach and taxi/ground idle phase. Besides, both of the relative errors in the approach and taxi/ground idle phase are more than 100%, which shows that the predicted results are more inaccurate when the engine SN is lower in relevant phase of the LTO cycle. Thus, the average values of AFRk or assumptions of nvPM particle GMDk probably lead to greater estimation errors for lower engine SN, and it also may be related with inaccuracy for measuring lower engine SN in the LTO cycle. More importantly, when the method is employed to estimate nvPM mass and number emissions in the LTO cycle for other unmixed turbofan engines, we could find the relative errors of predicted results also exist like the CFM56-7B26E engine. Obviously, the accuracy analysis of the estimated EInvPMm,e,k and EInvPMn,e,k could provide valuable information for further optimizing the FOA4.0 method.
Table 6. Relative errors of estimated EInvPMm,e,k and EInvPMn,e,k.
Consequently, the integrated method is feasible to estimate the CFM56-7B26E engine nvPM mass and number emissions in the LTO cycle, but it is still not accurate enough for estimating engine nvPM emissions in all phases of the LTO cycle. Considering the lack of some engine SN data and intrinsic deficiencies of the measurement system, as well as the reliance on average values of AFR and assumptive GMD in the LTO cycle for all engines in the FOA4.0 method, the accuracy of the integrated method should be further improved in future. Generally, as the number of flights and flight time for different aircraft in the airport are introduced into the model, the relevant three databases in the integrated method could be established for certain airports. Theoretically, once the different engine nvPM mass and number emissions in the LTO cycle are obtained, we could calculate the total aircraft engine nvPM mass and number emissions during the LTO cycle in different time periods at the airport with the integrated method. Thus, the integrated method is effective in the analysis of the sources and trends of total aircraft engine nvPM emissions in the LTO cycle at airports.
Assessment of aircraft engine nvPM emissions at Hangzhou Xiaoshan International Airport
The commercial flights operating in a certain period is almost pre-determined at any airport, and the engine types of different aircraft are specified in the civil aviation sector. When we use the integrated method, it is critical to establish the aircraft flights database of certain airports. The exhaust emissions data of most existing certified engines used by civil aircraft could be obtained from ICAO EEDB, so the engine parameters database is easier to be established based on relevant aircraft-type information at airports. To simplify the calculation, it is theoretically feasible for us to assume that the same engine type is used by the same series of aircraft types at an airport, which does not affect the effectiveness of the integrated method. In practical application, because the required databases involved in the integrated method can be completely established, there is no need to do the corresponding simplification.
Here we use the integrated method to analyze the sources and trends of daily aircraft engine nvPM emissions during LTO cycles at Hangzhou Xiaoshan International Airport in east China. The daily flights data (403 scheduled commercial flights) at Hangzhou Xiaoshan International Airport in 2019 was provided by Zhejiang Air Traffic Management Bureau of Civil Aviation Administration of China (CAAC), and several additional non-routine general aviation flights are ignored. According to the classification criteria of aircraft types in civil aviation (Boeing Citation2021), B737-300, B737-400, B737-500 belong to the same series of B737CL aircraft, and B737-600, B737-700, B737-800 belong to the same series of B737NG aircraft. Some aircraft probably has several engine types, and here we choose the typical engine type widely used by relevant aircraft. This simplification may increase errors of predicted engine nvPM emissions in the LTO cycle for some aircraft, but it does not affect the validity of the integrated method used in assessing the whole sources and trends of engine nvPM emissions in the LTO cycle. Accordingly, the daily flights of Hangzhou Xiaoshan International Airport could be reclassified (see ).
Table 7. Daily flights of Hangzhou Xiaoshan International Airport
For the propose of analyzing the sources of aircraft engine nvPM emissions during LTO cycles in one whole day at Hangzhou Xiaoshan International Airport, we use the integrated method to estimate relevant engine nvPM mass emissions in the LTO cycle at the airport. It is evident that all engine types used by different aircraft are TF engine except the CF6-80C2B1 engine used by A330 at the airport. Thus, here we only need the BPR data of CF6-80C2B1 engine for using the integrated method to analyze the sources and trends of aircraft engine nvPM emissions during LTO cycles at the airport, and the CF6-80C2B1 engine BPR is 5.1 according to its engine emissions certification data in ICAO EEDB (EASA Citation2021). Besides, the relevant data of engine SN and FF in each phase of the LTO cycle are obtained from ICAO EEDB (see ). Each flight means the aircraft operates a LTO cycle at the airport, so the number of aircraft LTO cycles is the same as its number of flights. The actual LTO time may slightly differ from the scheduled time of reference LTO cycle for the same aircraft type operated at different airports or at different times in the same airport because the actual aircraft LTO cycle is probably affected by unexpected factors such as flight delays. To simplify the calculations of theoretical research, we ignore the probable time differences between the actual aircraft LTO cycle and the reference LTO cycle. Of course, if we record the actual time of each phase of LTO cycles for different aircraft operated at the airport, the integrated method will be more accurate to be used in analyzing the sources of aircraft engine nvPM emissions during LTO cycles.
Table 8. SN and FF data of engines operated at Hangzhou Xiaoshan International Airport (EASA Citation2021)
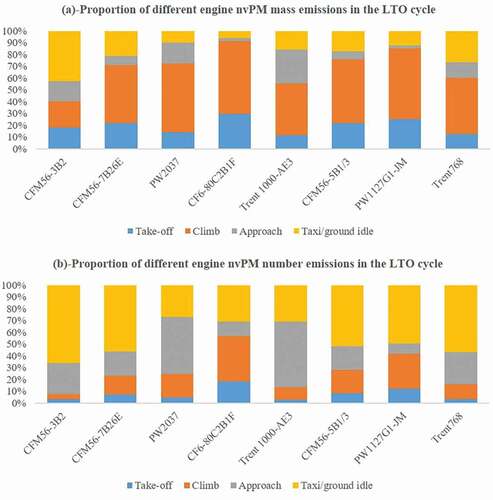
For aircraft types operated at Hangzhou Xiaoshan International Airport, we could calculate relevant engine nvPM mass and number emissions in each phase of the LTO cycle with the integrated method (see ). The sources of different aircraft engine nvPM emissions could be analyzed with its relevant percentage of TnvPMm,e,k and TnvPMn,e,k in each phase of the LTO cycle (see ). Results show that the highest engine nvPM mass emissions are predicted to generally occur in the climb phase except the CFM56-3B2, but the highest engine nvPM number emissions are predicted to be generally produced in the taxi/ground idle phase. Thus, in order to reduce the total engine nvPM emissions from different aircraft at airports, the characteristics of both nvPM mass and number emissions in the LTO cycle should be considered simultaneously for relevant engines.
Table 9. Engine nvPM mass emissions in the LTO cycle at Hangzhou Xiaoshan International Airport
Table 10. Engine nvPM number emissions in the LTO cycle at Hangzhou Xiaoshan International Airport
Figure 4. Proportion of different engine nvPM mass and number emissions in the LTO cycle.
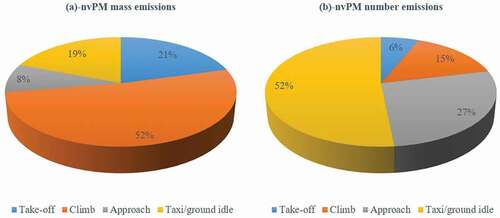
After that, the total engine nvPM mass and number emissions from different aircraft in each phase of the LTO cycle could be calculated with number of flights for different aircraft, and then the whole sources of total engine nvPM emissions during LTO cycles at the airport could be analyzed with its percentage of nvPM mass and number emissions from all aircraft in each phase of the LTO cycle (see ). Results show that the largest engine nvPM mass emissions (about 52%) is produced by aircraft working in the climb phase, but the largest engine nvPM number emissions (about 52%) is produced by aircraft working in the taxi/ground idle phase. For the propose of reducing the total engine nvPM emissions at the airport, it is better to decrease engine nvPM mass emissions during the climb phase. Similarly, it is critical to reduce the nvPM number emissions during the taxi/ground idle phase for most engines. From the prospect of optimizing flight operations, we could optimize the flight procedure in the climb and taxi/ground idle phase considering reducing nvPM mass and number emissions from aircraft engines.
Figure 5. Proportion of total engine nvPM mass and number emissions in the LTO cycle.
In addition, the integrated method could also be used to quantitatively assess the trends of hourly aircraft engine nvPM emissions during LTO cycles at the airport. Compared with the great difficulty of directly measuring different engine nvPM emissions from various aircraft in certain time at the airport, it is easier to predict the trends of total aircraft engine nvPM emissions based on hourly flights with the integrated method. For daily flights at Hangzhou Xiaoshan International Airport in 2019, the trends of daily aircraft engine nvPM mass and number emissions during LTO cycles are assessed in terms of hourly flight change. Firstly, the daily flights at the airport are distributed in 24 time periods, and its aircraft types and number of flights are recounted (see ).
Table 11. Daily flights distribution at Hangzhou Xiaoshan International Airport
Based on the predicted nvPM mass and number emissions in each phase of the LTO cycle for a specific engine, the total engine nvPM mass and number emissions produced by different aircraft in each hour of 1 day could be obtained with its number of flights, and they are used to analyze the trends of daily aircraft engine nvPM emissions at Hangzhou Xiaoshan International Airport (see ). Results show that the hourly engine nvPM mass emissions produced in the LTO cycle is the highest from 7:00 to 8:00 a.m., and it is generally higher from 6:00 a.m. to 17:00 p.m. than that in most other periods. Meanwhile, the hourly nvPM number emissions produced by aircraft engines from 6:00 a.m. to 17:00 p.m. are also higher than that in most other periods, but the highest hourly engine nvPM number emissions occur in the time period of 11:00–12:00 a.m. Overall, the trends of hourly engine nvPM mass and number emissions in one day are similar. To reduce the impact of nvPM emissions on air quality and human health, it is significant to manage the trends of daily engine nvPM emissions during LTO cycles at the airport, and the flight plan could be further optimized by air-traffic controllers considering the trends of daily engine nvPM emissions.
Figure 6. Aircraft engine daily nvPM emissions during LTO cycles at the airport.
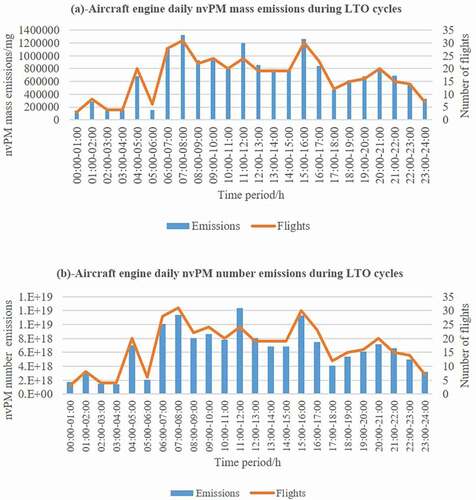
Moreover, shows that the number of flights operated in 9:00 to 10:00 a.m. is the same as that in 11:00–12:00 a.m., but its total aircraft engine nvPM mass and number emissions are different. It shows that the total daily nvPM mass and number emissions from aircraft engines in different time periods is also related with various engine emission performance. To effectively manage the trends of daily engine nvPM emissions, the flight plan at airports should also be optimized considering the different nvPM emission performance of relevant aircraft engines. For example, if the engine nvPM emissions of relevant aircraft are notably larger in the LTO cycle, the corresponding flight time could be adjusted to a time period with lower total nvPM emissions. Besides, for sake of preventing significant increases of total nvPM emissions from aircraft engines at certain times, new flights of the airport are better to be added in the time period when the total nvPM emissions is lower.
Conclusion
We propose an integrated method for estimating aircraft engine nvPM emissions during LTO cycles at airports, which avoids the substantial difficulty and expense of directly measuring actual aircraft engine nvPM emissions during each flight. The method is viable to be used in analyzing the sources and trends of daily aircraft engine nvPM emissions during LTO cycles at airports, which could provide more information to optimize flight operations considering the environmental impact of aircraft engine nvPM emissions. Through the effective application of the integrated method in analyzing the sources and trends of daily aircraft engine nvPM emissions during LTO cycles at Hangzhou Xiaoshan International Airport, it is indicated that the highest nvPM mass and number emissions generally occurs in the climb and taxi/ground idle phase respectively, and the total aircraft engine nvPM mass and number emissions produced in the climb and taxi/ground idle phase of LTO cycle also accounted for the highest proportion at Hangzhou Xiaoshan International Airport. Besides, the trends of daily aircraft engine nvPM mass and number emissions during LTO cycles at the airport are similar, and both of them are generally higher from 6:00 a.m. to 17:00 p.m. than those of most other time periods. Considering the sustainable development of airports in the world, the data-driven integrated method would be employed to assess the sources and trends of aircraft engine nvPM emissions at any time period with the enrichment of relevant engine emissions and flights data of the airport, which is valuable for air-traffic controllers to develop specific aviation environmental management strategies to optimize flight operations by factoring the impact of engine nvPM emissions on air quality.
Nomenclature
Acknowledgment
The authors acknowledge Mr. Canlong Chen from the Zhejiang Air Traffic Management Bureau of CAAC for providing the daily flights data of Hangzhou Xiaoshan International Airport.
Data Available on request.
Disclosure statement
No potential conflict of interest was reported by the author(s).
Additional information
Notes on contributors
Limin Zhou
Limin Zhou is a Ph.D. candidate at the Department of Aeronautics and Astronautics of Fudan University, Shanghai, China.
Yushan Ni
Yushan Ni is a professor at the Department of Aeronautics and Astronautics of Fudan University, Shanghai, China.
Huolei Feng
Huolei Feng is a Ph.D. candidate at the Department of Aeronautics and Astronautics of Fudan University, Shanghai, China.
Xiaowen Hu
Xiaowen Hu is a Ph.D. candidate at the Department of Aeronautics and Astronautics of Fudan University, Shanghai, China.
References
- Abrahamson, J. P., J. Zelina, M. G. Andac, and R. L. Vander Wal. 2016. Predictive model development for aviation black carbon mass emissions from alternative and conventional fuels at ground and cruise. Environ. Sci. Technol. 50 (21):12048–55. doi:https://doi.org/10.1021/acs.est.6b03749.
- Agarwal, A., R. L. Speth, T. M. Fritz, S. D. Jacob, T. Rindlisbacher, R. Iovinelli, B. Owen, R. C. Miake-Lye, J. S. Sabnis, and S. R. H. Barrett. 2019. SCOPE11 method for estimating aircraft black carbon mass and particle number emissions. research-article. Environ. Sci. Technol. 53 (3):1364–73. American Chemical Society. doi:https://doi.org/10.1021/acs.est.8b04060.
- Benosa, G., S. Zhu, M. Mac Kinnon, and D. Dabdub. 2018. Air quality impacts of implementing emission reduction strategies at Southern California airports. Atmos. Environ. 185 (April):121–27. Elsevier. doi:https://doi.org/10.1016/j.atmosenv.2018.04.048.
- Bo, X., X. Xue, J. Xu, X. Du, B. Zhou, and L. Tang. 2019. Aviation’s emissions and contribution to the air quality in China. Atmos. Environ. 201 (January):121–31. Elsevier. doi:https://doi.org/10.1016/j.atmosenv.2019.01.005.
- Boeing. 2021. Boeing next-generation 737. Accessed September, 2021. http://www.boeing.com/commercial/737ng/
- Durand, E. F., A. P. Crayford, and M. Johnson. 2020. Experimental validation of thermophoretic and bend nanoparticle loss for a regulatory prescribed aircraft NvPM sampling system. Aerosol Sci. Technol. 54 (9):1019–33. Taylor & Francis. doi:https://doi.org/10.1080/02786826.2020.1756212.
- Durdina, L., B. T. Brem, D. Schönenberger, F. Siegerist, J. G. Anet, and T. Rindlisbacher. 2019. Nonvolatile particulate matter emissions of a business jet measured at ground level and estimated for cruising altitudes. Environ. Sci. Technol. 53 (21):12865–72. doi:https://doi.org/10.1021/acs.est.9b02513.
- Durdina, L., B. T. Brem, A. Setyan, F. Siegerist, T. Rindlisbacher, and J. Wang. 2017. Assessment of particle pollution from jetliners: from smoke visibility to nanoparticle counting. Environ. Sci. Technol. 51 (6):3534–41. doi:https://doi.org/10.1021/acs.est.6b05801.
- EASA. 2021. ICAO aircraft engine emissions databank. Accessed September, 2021. https://www.easa.europa.eu/easa-and-you/environment/icao-aircraft-engine-emissions-databank
- Greer, F., J. Rakas, and A. Horvath. 2020. Airports and environmental sustainability: A comprehensive review. Environ. Res. Lett. 15 (10):103007. IOP Publishing. doi:https://doi.org/10.1088/1748-9326/abb42a.
- Hudda, N., L. W. Durant, S. A. Fruin, and J. L. Durant. 2020. Impacts of aviation emissions on near-airport residential air quality. Environ. Sci. Technol. 54 (14):8580–88. doi:https://doi.org/10.1021/acs.est.0c01859.
- Hudda, N., M. C. Simon, W. Zamore, and J. L. Durant. 2018. Aviation-related impacts on ultrafine particle number concentrations outside and inside residences near an airport. Environ. Sci. Technol. 52 (4):1765–72. doi:https://doi.org/10.1021/acs.est.7b05593.
- ICAO.2008. Environmental protection - Volume II - Aircraft engine emissions (Third edition). Accessed September, 2021. http://www.cockpitdata.com/Software/ICAO%20Annex%2016%20Volume%202
- ICAO. 2017. Environmental protection - Volume II - Aircraft engine emissions (Fouth edition). Accessed September, 2021. https://global.ihs.com/search_res.cfm?&input_search_filter=ICAO&input_doc_number=ANNEX%2016%20VOL%20II&input_doc_title=&org_code=ICAO
- ICAO. 2019. Environmental report: aviation and environment. Accessed September, 2021. https://www.icao.int/environmental-protection/Pages/envrep2019.aspx
- ICAO. 2020a. Local air quality technology standards. Accessed September, 2021. https://www.icao.int/environmental-protection/Pages/LAQ_TechnologyStandards.aspx
- ICAO. 2020b. Airport air quality manual (Second edition). Accessed September, 2021. https://www.icao.int/publications/pages/publication.aspx?docnum=9889
- Kinsey, J. S., R. Giannelli, R. Howard, B. Hoffman, R. Frazee, M. Aldridge, C. Leggett, K. Stevens, D. Kittelson, W. Silvis, et al. 2021. Assessment of a regulatory measurement system for the determination of the non-volatile particulate matter emissions from commercial aircraft engines. J. Aerosol Sci. 154 (September 2020):105734. Elsevier Ltd. doi:https://doi.org/10.1016/j.jaerosci.2020.105734.
- Kittelson, D. B., J. Swanson, M. Aldridge, R. A. Giannelli, J. S. Kinsey, J. A. Stevens, D. S. Liscinsky, et al. 2021. Experimental verification of principal losses in a regulatory particulate matter emissions sampling system for aircraft turbine engines. Aerosol Sci. Technol. 1–12. Taylor & Francis. doi:https://doi.org/10.1080/02786826.2021.1971152.
- Liu, F., M. Hu, W. Lv, and H. Zhang. 2021. Research on optimization of aircraft climb trajectory considering environmental impact. J. Adv. Transp. 2021:1–15. doi:https://doi.org/10.1155/2021/6677329.
- Lobo, P., L. Durdina, B. T. Brem, A. P. Crayford, M. P. Johnson, G. J. Smallwood, F. Siegerist, P. I. Williams, E. A. Black, A. Llamedo, et al. 2020. Comparison of standardized sampling and measurement reference systems for aircraft engine non-volatile particulate matter emissions. J. Aerosol Sci. 145:105557. doi:https://doi.org/10.1016/j.jaerosci.2020.105557.
- Lobo, P., D. E. Hagen, and P. D. Whitefield. 2012. Measurement and analysis of aircraft engine PM emissions downwind of an active runway at the Oakland international airport. Atmos. Environ. 61:114–23. doi:https://doi.org/10.1016/j.atmosenv.2012.07.028.
- Lobo, P., D. E. Hagen, P. D. Whitefield, and D. Raper. 2015. PM emissions measurements of in-service commercial aircraft engines during the delta-atlanta hartsfield study. Atmos. Environ. 104:237–45. doi:https://doi.org/10.1016/j.atmosenv.2015.01.020.
- Lopes, M., A. Russo, J. Monjardino, C. Gouveia, and F. Ferreira. 2019. Monitoring of ultrafine particles in the surrounding urban area of a civilian airport. Atmos. Pollut. Res. 10 (5):1454–63. Elsevier B.V. doi:https://doi.org/10.1016/j.apr.2019.04.002.
- Masiol, M., and R. M. Harrison. 2014. Aircraft engine exhaust emissions and other airport-related contributions to ambient air pollution: A review. Atmos. Environ. 95:409–55. Elsevier Ltd. doi:https://doi.org/10.1016/j.atmosenv.2014.05.070.
- Migdadi, Y. K. A. A. 2020. Identifying the effective taxonomies of airline green operations strategy. Manage. Environ. Qual. An Int. J. 31 (1):146–66. doi:https://doi.org/10.1108/MEQ-03-2019-0067.
- Petzold, A., R. Marsh, M. Johnson, M. Miller, Y. Sevcenco, D. Delhaye, A. Ibrahim, P. Williams, H. Bauer, A. Crayford, et al. 2011. Evaluation of methods for measuring particulate matter emissions from gas turbines. Environ. Sci. Technol. 45 (8):3562–68. doi:https://doi.org/10.1021/es103969v.
- Ren, J., X. Cao, and J. Liu. 2018. Impact of atmospheric particulate matter pollutants to IAQ of airport terminal buildings: A first field study at Tianjin Airport, China. Atmos. Environ. 179:222–26. doi:https://doi.org/10.1016/j.atmosenv.2018.02.019.
- Saffaripour, M., K. A. Thomson, G. J. Smallwood, and P. Lobo. 2020. A review on the morphological properties of non-volatile particulate matter emissions from aircraft turbine engines. J. Aerosol Sci. 139 (October 2019):105467. Elsevier Ltd. doi:https://doi.org/10.1016/j.jaerosci.2019.105467.
- Stacey, B. 2019. Measurement of ultrafine particles at airports: A review. Atmos. Environ. 198 (July 2018):463–77. doi:https://doi.org/10.1016/j.atmosenv.2018.10.041.
- Stettler, M. E. J., A. M. Boies, A. Petzold, and S. R. H. Barrett. 2013. Global civil aviation black carbon emissions. Environ. Sci. Technol. 47 (18):10397–404. doi:https://doi.org/10.1021/es401356v.
- Targino, A. C., B. L. F. Machado, and P. Krecl. 2017. Concentrations and personal exposure to black carbon particles at airports and on commercial flights. Transp. Res. Part D Transp. Environ. 52:128–38. doi:https://doi.org/10.1016/j.trd.2017.03.003.
- Wayson, R. L., G. G. Fleming, and R. Iovinelli. 2009. Methodology to estimate particulate matter emissions from certified commercial aircraft engines. J. Air Waste Manage. Assoc. 59 (1):91–100. doi:https://doi.org/10.3155/1047-3289.59.1.91.
- Yang, X., S. Cheng, J. Lang, R. Xu, and Z. Lv. 2018. Characterization of aircraft emissions and air quality impacts of an international airport. J. Environ. Sci. (China) 72:198–207. Elsevier B.V. doi:https://doi.org/10.1016/j.jes.2018.01.007.
- Yim, S. H. L., G. L. Lee, I. H. Lee, F. Allroggen, A. Ashok, F. Caiazzo, S. D. Eastham, R. Malina, and S. R. H. Barrett. 2015. Global, regional and local health impacts of civil aviation emissions. Environ. Res. Lett. 10 (3):034001. IOP Publishing. doi:https://doi.org/10.1088/1748-9326/10/3/034001.
- Yim, S. H. L., M. E. J. Stettler, and S. R. H. Barrett. 2013. Air quality and public health impacts of UK airports. Part II: Impacts and policy assessment. Atmos. Environ. 67:184–92. Elsevier Ltd. doi:https://doi.org/10.1016/j.atmosenv.2012.10.017.
- Yu, J. L., Q. Jia, C. Gao, and H. Q. Hu. 2021. Air pollutant emissions from aircraft landing and take-off cycles at Chinese airports. Aeronaut. J. 125 (1285):578–92. doi:https://doi.org/10.1017/aer.2020.126.
- Zhang, X., X. Chen, and J. Wang. 2019. A number-based inventory of size-resolved black carbon particle emissions by global civil aviation. Nat. Commun. 10 (1):1–11. Springer US. doi:https://doi.org/10.1038/s41467-019-08491-9.