
ABSTRACT
Emission inspection of motor vehicles (emission inspection) is a crucial player in solving the problem of motor vehicle exhaust pollution, and research on the features affecting emission inspection results and their importance is a basis for optimizing the environmental management of motor vehicles. However, there is no study on the multi-feature impact analysis of the emission inspection results. This hinders the emission inspection from playing a better guiding role in the policy formulation of motor vehicle management. In this paper, the ensemble learning algorithm and interpretable machine learning theory are used. Nineteen feature indicators and over 400,000 vehicle mass analysis system (VMAS) detection data in Chengdu were selected from the emission inspection database to construct prediction models for emission inspection results. Moreover, the factors affecting emission inspection results and their ranks by importance were also obtained. The results revealed that the environment has a strong influence on the outcomes from emission inspections (accounting for about one-third of the total effect). Besides, the following eight feature indicators displayed great effects on emission inspection results in sequence: emission inspection agency (18.38%), world manufacturer code (15.01%), vehicle usage days (9.60%), transmission type (9.41%), accumulated mileage (9.21%), emission standard (5.82%), temperature (5.54%), and driving mode (5.50%). In this study, prediction models for emission inspection results are established, and the results are interpreted based on the interpretable machine learning theory. It is considered that more attention should be paid to the effect of inspection differences among emission inspection agencies on fairness, as well as the effects of differences in world manufacturer and transmission type on vehicle deterioration in future research. The supervision of emission inspection agencies, training of inspectors, elimination of obsolete vehicles, and government-guided purchase should be strengthened. This study provides empirical support for optimizing the formulation of motor vehicle environmental management policies.
Implications: Emission inspection of motor vehicles (emission inspection) is a crucial player in solving the problem of motor vehicle exhaust pollution. In this work, prediction models for emission of motor vehicles inspection results are established. The results revealed that following eight feature indicators displayed great effects on emission inspection results in sequence: emission inspection agency (18.38%), world manufacturer code (15.01%), vehicle usage days (9.60%), transmission type (9.41%), accumulated mileage (9.21%), emission standard (5.82%), temperature (5.54%), and driving mode (5.50%). It is considered that more attention should be paid to the effect of inspection differences among emission inspection agencies on fairness, as well as the effects of differences in world manufacturer and transmission type on vehicle deterioration in future research. The supervision of emission inspection agencies, training of inspectors, elimination of obsolete vehicles, and government-guided purchase should be strengthened. This study provides empirical support for optimizing the formulation of motor vehicle environmental management policies.
Introduction
Mobile sources are one of the major contributors of air pollution (Hong Huo et al. Citation2015). With 5.195 million vehicles in Chengdu (MEEPRC (Ministry of Ecology and Environment of the People’s Republic of China) Citation2020), second only to Beijing, air pollution can be a major problem. An existing study showed that the emissions from motor vehicles exhaust are the largest contributors to volatile organic compounds (VOCs, a vital precursor of ozone production) in Chengdu (Chao et al. Citation2020, Qinwen Tan et al. Citation2020), and the main contributor to greenhouse gas emissions from transportation in China (road transport accounted for 84.1%, 2014 National Greenhouse Gas Inventory) (MEEPRC (Ministry of Ecology and Environment of the People’s Republic of China) Citation2020). So, it is imperative to collect data on emissions from vehicles, using the emission inspection records, for peak carbon dioxide emissions and ozone governance in the city of Chengdu.
A series of relevant standards for the in-use vehicle inspection and maintenance (I/M) system is provided in the existing environmental management of motor vehicles (Xin Yue et al. Citation2015). Under emission inspection of motor vehicles (emission inspection), in-use vehicles shall be regularly tested for exhaust emissions at a legal emission inspection agency (emission inspection agency), and those not meeting relevant standards shall be tested again after compulsory repair (DTSP; Department of Transportation of Sichuan Province, Citation2020). The emission inspection information database (emission inspection database), established on this basis, has the advantages of high update frequency, large data size, and wide information coverage, as well as quality control following national standards for testing procedures and database construction, with the addition of over one million samples in large cities every year. It is of great value for probing into the exhaust emission of in-use vehicles, status quo of emission inspection, and management of emission inspection agencies.
Existing studies have largely focused on the factors influencing the deterioration of motor vehicles, as well as the relationships between specific vehicle emission levels and emission factors such as vehicle age, accumulated mileage and emission standard have been largely developed (Qin Zhimei et al. Citation2021). The vehicle emission inspection is an avenue through which the government monitor proportion of emissions from vehicles (the inspection environment is stipulated in the law). This monitoring is necessary as it helps to analyze other issues associated with the operation of vehicles apart from aging. Feature importance can be used to adjust the key management vehicle categories, optimize the supervision of testing institutions and study the adjustment of testing methods. However, the research in this area is relatively lacking.
The ensemble algorithm-based method for feature importance evaluation has been applied to rank the importance of each feature in the prediction of intensive care unit readmission for critically ill patients (Lin et al. Citation2021), analyze and predict the importance of features of stroke in some studies (Lohit et al. Citation2021), and explore the drives of patient satisfaction in medicine (Simsekler Mecit Can Emre et al. Citation2021). Besides, it is used to score the importance of input variable features and compare the results with the classic hot rolling theory for conformity in the machining field (Guangtao et al. Citation2021), and screen the optimized feature model based on the assessment of feature importance in remote sensing interpretation (Mingxing et al. Citation2021). This method, which has been widely applied in recent years, plays an important role in interpreting how features influence models, feature selection and model optimization.
For machine learning model interpretation, the Shapley Additive Explanations (SHAP) technique is a vital method that interprets the model output as a sum of real values attributed to each input feature, thus avoiding the problem of inter-feature dependency. A recent research study has confirmed the rationalization potential of SHAP as a good prediction tool for complex machine learning models (Raquel and Jürgen Citation2020). SHAP has also been used to interpret the influencing factors of the prediction model of nitrogen oxide concentration (García and Aznarte Citation2020) and explain the prediction model of grassland degradation (Batunacun et al., Citation2021).
In this study, using the Gradient Boosting Decision Tree (GBDT) machine learning model and the SHAP method for interpreting the prediction, emission inspection results are predicted innovatively and comprehensively using inspection environment, vehicle factory configuration, and vehicle service factors as features. Additionally, the impact of the inspection environment on the expected results was explored, and the relative importance of multiple features and their effects are quantitatively discussed. Through this study, data cleaning procedure was used for emission inspection database, feature selection support for prediction model of emission inspection results, empirical support for emission inspection agency management and motor vehicle control policy formulation, and ideas for vehicle deterioration research and team division of vehicle remote sensing inspection data.
Materials and methods
Study data and data cleaning
Study data
The first inspection samples of gasoline vehicles tested by the vehicle mass analysis system (VMAS) in Chengdu were included as the objects of study, since VMAS is closer to the actual road driving conditions (Dong et al. Citation2016), and first inspection samples are more representative in the vehicle driving condition before maintenance than overall samples.
The testing procedures, data recording, saved and recorded content, and the time limit of saving and recording are specified in China (Ministry of Ecology and Environment of the People’s Republic of China Citation2018). In this study, the unqualified part of exhaust pollutant detection was analyzed. Based on the actual missing data and information overlap, nineteen (19) features were first screened for modeling, and then divided into three categories (): vehicle configuration parameters (A1-A12), vehicle service parameters (B1-B3), and inspection environment parameters (C1-C4). Prediction models of the inspection results were constructed, and the effects of each feature on the models were explored. After processing, over 460,000 samples were finally used, and the inspection time was from January to December 2020.
Table 1. Data composition.
Data cleaning
Data processing and modeling are conducted using the sklearn and shap python libraries. Based on existing research (Qin Zhimei et al. Citation2021), some newly selected features were added in the data cleaning method. In terms of “vehicle weight,” samples larger than 4500 kg were removed because the number of samples was too small (not representative). As to “displacement,” its range was divided according to the classification of cars. For “transmission type,” samples without such data were deleted. In terms of “vehicle identification number (VIN),” three-digit (VIN3, representing the world manufacturer) and eight-digit (VIN8, representing the vehicle brand) numbers were taken and compared according to National standard (China State Administration of Market Regulation Citation2019). For the “emission standard,” the standardized manual filling was applied. The “accumulated mileage” was classified and cleaned based on the type and compulsory scrapped mileage of different vehicles in accordance with the regulations in China’s compulsory scrapping standards for motor vehicles. As to “temperature” and “relative humidity,” samples with a temperature of greater than 45°C and those with a relative humidity of over 85% were deleted according to the inspection standard. However, in this study, the rare category was not representative, so this category was deleted.
As shown in , all features were categorized into numerical, sequencing, and category features. The numerical features were not changed after cleaning according to the corresponding rules. The sequencing features were subjected to meaningful integer coding with internal logic. As to category features, the existing research method (Qin Zhimei et al. Citation2021) was used for random integer coding since GBDT does not apply to one-hot encoding because of algorithmic principles and frequency coding has no support platform.
To ensure the balance of “qualified” and “unqualified” data between the training and test sets and because of model reuse, random sampling was not adopted. The data from the calendar (January to October) was used as the training set. Taking into account the imbalance of “qualified” and “unqualified” samples, the “oversampling” method was used to balance the samples. The sample from calendar November to December was reserved as the test set. To evaluate the predictive power of the model with the test set, the set was not reshuffled through sample class balance.
Model realization
GBDT
GBDT is an ensemble learning method. Integrated learning uses a certain strategy to combine multiple learners to complete the learning task, and can achieve better generalization performance than a single learner under normal conditions (Zhou Zhihua Citation2016). With the decision tree as the base learner (if the integrated algorithm is a homogeneous algorithm, the individual learner is called the base learner), GBDT is analogous to an additive model of multiple decision trees. First train a base learner, adjust the distribution of training samples according to performance, strengthen the weight of misclassified samples, until the specified number of times T is reached, and then combine T base learners. Hence, the optimization objective function is gradually approximated (Zhou Zhihua Citation2016). The decision tree is composed of if-then-else rules, with the basic principle of selecting the feature point with the largest information gain (or Gini coefficient) as the feature division point (Zheng and Casari Citation2019). In terms of the calculation of its feature importance, all nodes are traversed, and the reduced variance relative to the parent node or Gini coefficient is measured. The significance of each feature is a part of the overall model importance (Christoph Molnar Citation2021). In this way, the feature importance of GBDT is determined.
In the emission detection database, some variables are highly correlated. Hence, the issues of category feature processing and multicollinearity shall be considered when selecting an algorithm. Some advantages of GBDT include low machine complexity and fast modeling speed, without considering attribute dependency. Besides, the method easily applies to category features. In addition, it can be validated by the numerical statistical test and explained by Boolean logic. Therefore, it was used as the research algorithm for this work. The feature importance calculated in GBDT was referred to as the “model calculation importance.”
Model building
To explore the different effects of the fineness of inspection location on the prediction of classification results, VIN8 and emission inspection agencies (65) were selected to construct Model 1, while Model 2 was constructed using the VIN8 and testing systems (385). Then, Model 1 and Model 2 were compared. In addition, Model 3 was constructed using the VIN3 and emission inspection agencies and compared with Model 1 to investigate the differences in the effects of world manufacturer and vehicle brand on the prediction of classification results. The best model was selected based on the comparison results among the models. According to the “model calculation importance,” the selected model is feature-simplified. Iterative parameter tuning adopted grid parameter tuning method to determine model hyperparameters, and over-fitting in the model was eliminated.
Model evaluation
In this study, the overall error control index of the models is accuracy, while the discrimination indexes of negative and positive samples are selected as precision and recall, respectively. The model classification ability metrics are F1 score, AUC and kappa (). Since the prediction of vehicle emission inspection results is for management and control purposes, more attention should be paid to unqualified samples. In this study, the unqualified samples are regarded as positive samples, and the recall has been focused in the algorithm evaluation.
Table 2. Model evaluation indexes (Bruce and Bruce Citation2018).
In terms of model diagnosis, to improve the generalization ability of the model, the performances of machine learning models are often measured using the K-fold cross-validation method (Daniel Y. Chen Citation2020). K-fold cross-validation requires a long computing time. Hence, parallel computing was employed, supported by National Supercomputing Center, to overcome the huge computing cost.
Model interpretation
SHAP, which is an attribution analysis method based on cooperative game theory, solves the marginal contribution of a feature to a single sample in all feature sequences and obtains the global importance after averaging absolute values. In interpretable machine learning studies, this method is relatively new. Specifically, SHAP constructs an additive explanatory model, and all features are regarded as “contributors” to the predicted value. Through SHAP, the feature SHAP values of each sample were obtained, i.e., the features functioned in the prediction of sample results. The SHAP value of the feature j of sample xi is the contribution value of the feature j in xi to the final predicted value yi. When the value >0, it means that the feature improves the predicted value, and it has a positive effect (Lundberg et al. Citation2020). On the contrary, it indicates that the feature reduces the predicted value, which has a negative effect (Lundberg and Lee Citation2017, Lundberg et al. Citation2018).
The Shapley value of each feature in the fine-tuned model was calculated using the SHAP method, which was referred to as “feature SHAP value.” In this study, the similarities and differences between model calculation importance and feature SHAP value were compared, and the potential inter-feature information overlap and relevancy were discussed. In its calculation, the marginal distribution sampling is used, so the dependency between current feature and other features can be ignored (Christoph Molnar Citation2021). To solve the multicollinearity, inter-feature synergistic effect, and feature group effect, the feature importance for the prediction of emission inspection results was ranked with feature SHAP values as the primary reference.
Interpreted verification
According to the results of feature importance evaluation, the emission inspection agency was selected to validate the significance of its effect on emission inspection results predicted under the condition that the team composition was relatively simple. Other features with notable feature importance evaluation were categorized and divided, followed by pre-analysis and value control. A simplex team was selected based on the principle of sufficient sample size. A contingency table analysis was conducted on the difference in pass rate among different emission inspection agencies, and a significant difference indicated that the emission inspection agency could affect vehicle inspection results.
Results and analyses
Results of modeling
From the perspective of the classification ability of models (), the evaluation index of Model 3 was the best in the 10-fold cross-validation, while the AUC of the test set was slightly inferior to that in Model 1 (the difference was small). From the view of the prediction of unqualified samples, Model 3 displayed the highest recall in the 10-fold cross-validation, but the performance of the test set was slightly inferior to that in Model 1. As to the overall accuracy of the models, Model 3 exhibited a better overall accuracy. The comparison of Models 1 and 2 showed that only the recall and AUC of the testing set in Model 1 were slightly inferior to those in Model 2 (the differences were small). Following comprehensive consideration, the emission inspection agency and VIN3 were finally selected as the retained data precision in the present study.
Table 3. Results of model evaluation.
The results showed that the fineness of inspection location data had a very limited effect on GBDT prediction. It was inferred that the choice of emission inspection agencies was the major factor affecting the inspection location precision, while the choice of the testing system in emission inspection agencies had a limited effect. In terms of vehicle brand precision, the difference of the world manufacturers was the major influencing factor, and different brands of the same manufacturer also led to some differences.
Based on the calculation importance of Model 3 obtained, the contribution of engine type, fuel supply system, and three-way catalytic converter to the model was zero. These three features were then deleted to simplify the model. Besides, the values of “n_estimators” and “min_samples_leaf” in the GBDT model were set to 410 and 483, respectively. Compared with those of the original model (), the model accuracy increased by 4.71%. In the same vein, the accuracy of AUC and kappa models also increased, while the recall declined to a certain extent. Model simplification and parameter adjustment strengthened the accuracy, classification, and evaluation abilities of the model. After the simplification of the model and parameter tuning, the ability to predict unqualified samples was reduced.
Table 4. Comparisons of evaluation indexes before and after parameter adjustment (testing set validation, Model 3).
Results of the feature importance evaluation
Evaluation of the model calculation importance
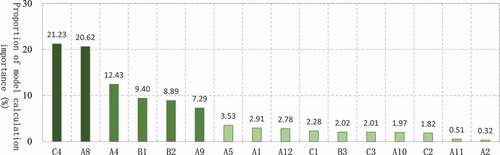
The importance of vehicle configuration parameters (A1-A12) and vehicle service parameters (B1-B3) accounted for 72.66%, and the importance of inspection environment (C1-C4) accounted for 27.34% (). The models were mainly affected by the emission inspection agency (C4, 21.23%), followed by the world manufacturer of the vehicle brand (A8, 20.62%). The two items have a higher combined influence than the rest of the items, accounting for 40.85%, followed by transmission type (A4, 12.43%), accumulated mileage (B1, 9.40%), vehicle usage days (B2, 8.89%), and emission standard (A9, 7.29%). Among them, the accumulated mileage and vehicle usage days were the key objects in vehicle deterioration research. The proportion of the first six features was 79.86%.
Figure 1. Model calculation importance.
Mutual influence and certain transfer are found in the importance of features with large information overlap. For instance, vehicle emission standards are affected by implementing national standards, thus influencing the vehicle usage days (or vehicle age, etc.) and accumulated mileage to some extent. If one of them is deleted, the model calculation importance of the other two will increase over the average level. To discuss inter-feature information overlap and verify whether there is over-fitting of the models caused by each feature, the accuracy, AUC change, and corresponding change in the model calculation importance were calculated after each feature was removed.
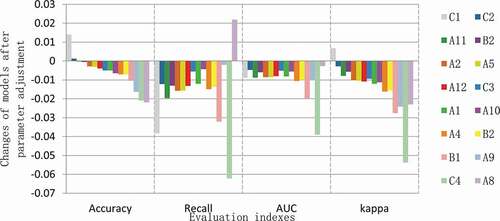
After removing a single feature (), the accuracy, recall, and classification ability of the model mostly decreased, whereas the changes in the model evaluation indexes were limited, implying that the inter-feature information overlap is large, and the single feature is highly replaceable. After removing “VIN3” (A8), the recall of the model rose, while its accuracy and classification ability declined, suggesting that “VIN3” contributes certainly to the model classification ability but makes the model predispose to predict qualified samples at the same time. The removal of the “emission inspection agency” (C4) led to the biggest drop in the recall, a small increase in the accuracy, and reduced model classification ability, confirming the importance of the emission inspection agency information to model classification. Following the removal of the “temperature” (C1), the accuracy rose, and the recall declined, with the decrease in ranking second, showing that temperature information can distinguish unqualified samples to some extent and results in a certain interference to the classification ability of the model. The removal of the “accumulated mileage” (B1) gives rise to a decrease in recall and AUC, ranking third and second, respectively, while corroborating its important effect on the model.
Figure 2. Changes in the evaluation results after removing single feature.
In conclusion, as to the pass rate of vehicles in the emission inspection, the effect of inspection environment accounts for about 27.34% in the model calculation importance. Besides, the emission inspection agency, VIN, transmission type, accumulated mileage, vehicle usage days, and emission standard have significant effects on the model. In addition, there is a large information overlap between features, and the lack of single feature information has less effect on the model.
Evaluation of the feature SHAP value
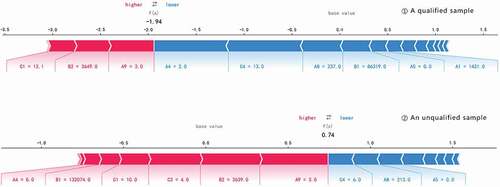
For a single sample, a SHAP value (SHAP Citation2019) greater than zero suggests that the feature value pushes prediction results to be unqualified, and less than zero indicates that the feature value pushes prediction results to be qualified. Final prediction results were determined by the class mean and all feature values of samples. Based on the comparison of qualified and unqualified samples shown in , the basic values of both qualified and unqualified samples were close to zero. Both qualified and unqualified samples met the National III emission standard (A9, 3) and had similar temperatures (C1, 12.1°C and 10.0°C) and vehicle usage days (B2, 3,649 d and 3,639 d). These three features showed positive contributions to prediction results, making the results to be “unqualified.” However, in 1), the transmission type (A4, 2), the emission inspection agency (C4, 13), VIN3 (A8, 237), and accumulated mileage (B1, 86,319 km) negatively contributed to prediction results, and the final prediction results were closer to zero; hence, it was predicted to be qualified. In 2), the transmission type was manual (A4, 0) and accumulated mileage (B1, 132,074 km) made a large positive contribution to prediction results, and the final prediction results were closer to 1. Therefore, it was predicted to be unqualified.
Figure 3. Feature SHAP value for a single sample.
The feature contribution to all samples was visualized to obtain the SHAP summary plot (left) in , “feature SHAP value” (). The feature ranking plot (right) in was obtained by taking the average absolute value of the SHAP values of features in different samples. In the SHAP summary plot, a higher code value of a feature showed redder coloring, a lower code value of a feature indicated blue coloring, and purple represented a middle value. Besides, the features located on the left side of the y-axis indicated that the SHAP value was less than zero, and those located on the right side implied that the SHAP value was greater than zero. In addition, a SHAP value greater than zero pushed prediction results to be unqualified, and vice versa.
Table 5. Proportion of the feature SHAP values.
Figure 4. SHAP summary plot [(1)] and feature ranking plot [(2)].
![Figure 4. SHAP summary plot [(1)] and feature ranking plot [(2)].](/cms/asset/763c2f1a-af4a-4594-8ac4-de82b6c84d91/uawm_a_2035851_f0004_oc.jpg)
As shown in the left plot, there were obvious trends in the numerical features, vehicle usage days (B2), and accumulated mileage (B1). A higher feature value signified a higher SHAP value (rightwards, the same below), which signifies a positive contribution, pushing prediction results to be unqualified. A lower temperature indicated a lower SHAP value (a negative contribution), pushing the prediction results to be unqualified. As to category features, the transmission type (A4) displayed obvious rules. The “manual” (0) had a small impact and made the prediction results of samples to be “unqualified,” the “automated-manual” (1) had a great effect and made the prediction results of samples be “unqualified,” and “automatic” (2) had a great influence and made the prediction results of samples to be “qualified.” In the right plot showing the mean feature SHAP value obtained by taking the average absolute value of features and their ranks. The first six features, which were emission inspection agency (C4), VIN3 (A8), vehicle usage days (B2), transmission type (A4), accumulated mileage (B1), and emission standard (A9), and the SHAP value for inspection environment, accounted for 30.39%.
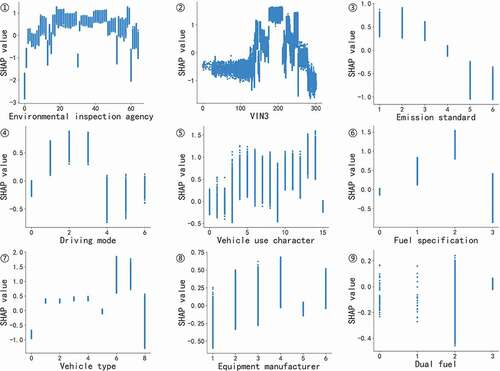
In the SHAP summary plot, each row was decomposed into an independent SHAP dependency graph (), reflecting the characteristics of SHAP value distribution changing with a certain feature. In terms of the category features emission inspection agency and VIN3 (the integer code of the feature was randomly assigned and had no relative size relationship), there were different effects of agencies and world manufacturers on the results. For example, the emission inspection agencies numbered 0, 1, 13, 31, 53, and 61 displayed low SHAP values, making the results to be qualified, while those numbered 19–30, 32–47, 59, and 60 had high SHAP values, making the results to be unqualified. The world manufacturers with VIN3 (numbered 190–210) showed high SHAP values, making the results to be unqualified. As to emission standards, the national I–III emission standards made results to be unqualified. The national IV emission standard had less effect. The national V and VI emission standards made the results to be qualified. For driving mode, rear-wheel drive (1), multi-axis drive (2), and timely four-wheel drive (3) made the results to be qualified. On the other hand, front-wheel drive (0), time-sharing four-wheel drive (4), full-time four-wheel drive (5), and others (6) made the results to be unqualified. The SHAP value of vehicle use character showed a relatively scattered distribution, but lease to non-operating (4), dangerous chemical transport (5), engineering emergency (6), school buses for infants (7), ambulances (8), lease (10), net lease (11), operating to non-operating (12), police (13), and freight transport (14) made the results to be unqualified, whereas non-operating made the results to be qualified. As to fuel specification, 98# gasoline made the results to be unqualified, followed by 95# gasoline, and 92# gasoline had less effect. In terms of vehicle type, minibuses (6) and light special motor vehicles (7) made the results to be unqualified, while medium-sized buses made the results to be qualified. As for the equipment manufacturers to test equipment, the distribution of SHAP values in different samples was scattered, and the distribution range was also different. It is speculated that the testing difference caused by different inspection agencies may cover the difference in manufacturer equipment, but it is lower-ranking and not the major factor. In terms of dual-fuel, the distribution of SHAP values in different samples was also scattered, and the law was not obvious.
[(1) Emission inspection agency, (2) VIN3, (3) emission standard, (4) driving mode, (5) vehicle use character, (6) fuel specification, (7) vehicle type, (8) equipment manufacturer, and (9) dual fuel)]
Figure 5. SHAP dependency graph (category features).
For numerical features (), besides the information in the SHAP summary plot, the cutoff point of about 2,200 d (about 6 years of vehicle age) for the SHAP value of zero (0) of vehicle usage days, accumulated mileage of about 100,000–120,000 km, temperature of 25–30°C, relative humidity of 70–75%, and vehicle weight of less than 1000 kg easily made results to be qualified. The plot also reflected the interaction between features. The larger the vehicle usage days, the closer the emission standard to national VI (meeting policy requirements in China), but no specific rule was found between vehicle usage days and accumulated mileage. Besides, some vehicles had a small accumulated mileage although they were bought for a long time, while some displayed a large accumulated mileage (affected by usage) but were purchased for a short time. In addition, as the temperature rose, the high value of humidity decreased, and the mean declined (in line with common sense).
[(1) Vehicle usage days, (2) accumulated mileage, (3) temperature, (4) relative humidity, (5) vehicle weight, and (6) displacement]
Figure 6. SHAP dependency graph (numerical features).
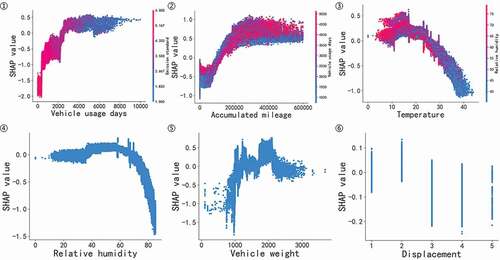
The following conclusions were made. First, the effect of the inspection environment (C1-C4) accounts for about 30.39%. According to SHAP dependency graphs, some emission inspection agencies have a biased influence on the test results. Anti-cheating supervision should be strengthened on their process data, the number of on-site inspections should be increased, and personnel training should be strengthened. Meanwhile, the temperature and relative humidity exceeding a certain value make results to be qualified. If these values are lower than the required value in national standards, further rational research can be performed. Second, world manufacturers display sizable differences, and some are biased compared to the mean. Third, the larger accumulated mileage and vehicle usage days and closer national I emission standard make the results to be unqualified. The cutoff point of zero value is similar to that in the general research. Fourth, the transmission type has a great impact on vehicles. “Automated-manual” and “manual” transmission vehicles are more likely to be judged as unqualified vehicles. “Automated-manual” exhibits a greater effect, and “automatic” transmission vehicles are more likely to be judged as qualified vehicles. Lastly, other category features have less effect, but certain categories have obvious biases. Some measures can be taken for the supervision, control, or elimination of some categories.
Validation of the pass rate of teams with similar composition at different emission inspection agencies
This validation aims to explore the difference of a single factor in emission inspection results under the condition that the values of other features were controlled in a certain range. According to the results of the model and SHAP value analysis, the most influential feature (emission inspection agency) was selected as the object of validation. In addition, value control is performed on the features (the accumulated mileage, vehicle usage days, emission standard, and vehicle weight) that have a greater impact. Considering the changes in the sample size, the samples met the national IV emission standard and with the accumulated mileage of 60,000–100,000 km, vehicle age of 6–7 years, and weight of 1,300–1,400 kg were included in this validation. Single emission inspection agencies with a sample size of less than 10 were excluded. The final validation sample size was 27,259 records, the pass rate was 91.72%, and 58 emission inspection agencies were involved.
The emission inspection agencies were ranked (1–58) by a pass rate in descending order (), and the maximum and smallest pass rates were 100% and 63.33% (the sample size of emission inspection agencies with a pass rate of 100% was 13, while that of other emission inspection agencies was greater than 19), respectively. The total pass rate of samples validated was 91.72%, with a range of 0.3666, a mean of 0.8509, a standard deviation of 0.0952, and a coefficient of variation of 11.19%.
Figure 7. Differences in test pass rates among emission inspection agencies.
The contingency table analysis was performed on both qualified and unqualified samples for each emission inspection agency. There were 27,259 valid samples, with a degree of freedom of 57. The coefficient of contingency was 0.294, and the progressive significance was 0.000, implying that there is a significant correlation between the selection of emission inspection agencies and qualified samples. The differences among emission inspection agencies in each quarter were calculated, and it was found that the problems existed for a long time. It was discovered in combination with the establishment time of emission inspection agencies that emission inspection agencies newly established were more prone to abnormalities. Thus, it is highly recommended that the follow-up integer coding can be done with the establishment time of emission inspection agencies as the sequence.
Discussion
The large inter-feature information overlap jointly affected emission inspection results, so the lack of some information has a limited effect on the results. Besides, data precision has a limited effect on models. Upon comprehensive consideration, the model covering the emission inspection agency and VIN3 was chosen to represent the owner’s choice of inspection sites and differences in the world manufacturer. Based on the model calculation importance, the engine type, fuel supply system, and three-way catalytic converter were deleted to simplify the model. The parameter values 50–600 of “n_estimators” and 10–1000 of “min_samples_leaf” in GBDT were iteratively adjusted to 410 and 483, respectively. In addition, a large degree of information overlap indicates the dependency among features, which affects the authenticity of model calculation importance.
The effect of inspection environment accounted for about 27.34% (proportion of model calculation importance) – 31.68% (proportion of feature SHAP value), jointly determined by the emission inspection agency, testing equipment manufacturer, temperature, and relative humidity. As to the importance of a single feature, the emission inspection agency ranked first. The results of validation through statistical methods showed that there was indeed a correlation between the emission inspection agency and inspection results, suggesting that the testing differences among agencies can affect the fairness of vehicle inspection. Some existing studies have pointed out that the large measurement errors of testing equipment and rapid increase in testing requirements can lead to a high pressure on supervision (Kun Citation2019), and the testing values corrected with inspection results are enlarged to 3.11 times in the case of elevated environmental temperature and humidity (Qiang and Zhiyong Citation2019). In addition, the environmental temperature affects the emission factor of particulate matter (Hu, Zhao, and Li Citation2021), which is consistent with the conclusions of this study.
In the SHAP value analysis, the inter-feature dependency can be ignored (Christoph Molnar Citation2021). Based on existing research, the differences were quantitatively described, and the single effect was discussed in the results of the common effect of multi-features in this study. On the whole, the following eight features ranking by the SHAP value had great effects on emission inspection results: emission inspection agency, VIN3, vehicle usage days, transmission type, accumulated mileage, emission standard, temperature, and the driving mode, accounting for 78.48% of the total effect. Extensive studies in vehicle degradation have shown the effects of accumulated mileage, vehicle usage days, and emission standards. However, in this study, it was found that emission inspection agencies, world manufacturers, and transmission types also have significant effects. Existing studies on vehicle configuration have also shown that transmission type and turbocharging (Lu Yunheet al. Citation2013) affect the differences in vehicle emission factors. The vehicle weight and engine displacement have a non-linear positive correlation with emissions (Yan et al. Citation2020). The vehicle weight, displacement, and fuel type have a great effect on motor vehicle emission factors (Sun Haoyang Citation2019). There is an obvious difference in the pass rate in the inspection between joint venture brands and self-owned brands (Dong, Hang, and Yan et al. Citation2016), which is in line with the conclusions of this study.
Based on the above discussion, the following suggestions have been put forward. In terms of supervision, the training and supervision of emission inspection agencies should be strengthened, and on-site inspection and personnel training should be added for newly established agencies. Besides, the fairness of the inspection should be ensured, and various environmental protection and emission inspection agencies should regularly conduct big data analysis and information mining. For abnormal emission inspection agencies screened out in the machine learning model, technical guidance should be enhanced, and the number of on-site inspections should be increased. As to motor vehicle increment and inventory control, the renewal and elimination of vehicles with high intensity and large accumulated mileage and old vehicles should be further promoted. Other measures such as market regulation, tax subsidies, and license plate quantity restrictions should be used to urge vehicle brands with a low pass rate to improve the craftsmanship or guide car owners to purchase selectively. More specific studies on manual and automated manual vehicles should be carried out at the same time. In addition, some specific types of vehicles are more likely to fail, which can be used as a direction to strengthen supervision, and some ideas are provided for team division in subsequent remote sensing inspection.
Conclusion
First, the rank of the effect of the 19 features used in modeling reveals that the inspection environment accounts for nearly one-third of the effect on the pass rate of vehicles in the emission inspection. In particular, the effect of the emission inspection agency is significant. As to driving features of vehicles, the importance of accumulated mileage and vehicle usage days is consistent with existing knowledge. For the configuration features of vehicles, fuel supply system, engine type, and three-way catalytic converter have little effect, whereas the transmission type has a great effect, and the difference between manual transmission vehicles and automatic transmission vehicles in vehicle degradation is worth paying attention.
Second, besides prediction, a machine learning model was adopted for quantifying the influencing factors of analysis and prediction results, which is conducive to management support and model analysis. The quantification of the important effect of emission inspection agencies on results in this study offers technical support for the management of emission inspection agencies, which will be further improved to act as a basis for on-site sampling inspection of emission inspection agencies, testing systems, and inspectors.
Disclosure statement
No potential conflict of interest was reported by the authors.
Additional information
Funding
Notes on contributors
Qin Zhimei
Qin Zhimei is a Master at Sichuan University, a engineer at Chengdu Big Data Incorporated Company, a engineer at Sichuan Academy of Environmental Policy and Planning, Chengdu, Sichuan, People’s Republic of China.
Yangxin Xiong
Yangxin Xiong is a Master at the Department of Environmental Science and Engineering, College of Architecture and Environment, Sichuan University, Chengdu, Sichuan, People’s Republic of China.
Hong Tian
Hong Tian is a professional senior engineer at Chengdu Technical Support Center of Vehicle Exhaust Pollution Control, Chengdu, People’s Republic of China.
Xiaoyun Deng
Xiaoyun Deng is a senior engineer at Chengdu Technical Support Center of Vehicle Exhaust Pollution Control, Chengdu, People’s Republic of China.
Pengcheng Qin
Pengcheng Qin is a engineer at Chengdu Technical Support Center of Vehicle Exhaust Pollution Control, Chengdu, People’s Republic of China.
Yu Zhan
Yu Zhan is an associate professor at the Department of Environmental Science and Engineering, Sichuan University, People’s Republic of China.
Bin Wang
Bin Wang is an associate professor at the Department of Environmental Science and Engineering, College of Architecture and Environment, Sichuan University, Chengdu, Sichuan, People’s Republic of China.
Xianfeng Zeng
Xianfeng Zeng is a engineer at Chengdu Supercomputing Center Operation Management Co., Ltd, Chengdu, People’s Republic of China.
References
- Batunacun, W. R., Lakes T., and Nendel C. 2021. Using Shapley additive explanations to interpret extreme gradient boosting predictions of grassland degradation in Xilingol, China. Geoscientific Model Development 14 (3).
- Bruce, P., and Bruce, A. 2018. Practical statistics for data scientists. Translated by G. Lei, Beijing: Posts & Telecom Press.
- Chao, X., L. I. Jianjun, Y. Fumo, Li, H., Junhui, C., and Jiqing, W. 2020. Pollution characteristics and source apportionment of VOCs during a heavy pollution process in winter in Chengdu. Environmental Pollution & Control 42 (330 (5)):71–77+84.
- Chen, D. Y. 2020. Pandas for everyone: Python data analysis. Translated by W. Chuanhai, Beijing: Posts & Telecom Press.
- China State Administration of Market Regulation. 2019. Road Vehicle — Vehicle Identification Number (VIN) (GB 16735-2019).
- Christoph Molnar. 2021. Interpretable machine learning: A guide for making black box models explainable. Translated by Z. Mingchao, Publishing House of Electronics Industry, Beijing.
- Dong, M. A., Y. I. N. Hang, D. Yan, Hongli, W., Junfang, W., Yanjun, W., and Zhihui, H. 2016. Research on the emission status of in-use vehicle in China based on big date analysis. Environmental Pollution & Control 38 (7):42–48+55.
- DTSP (Department of Transportation of Sichuan Province). 2020. Interpretation of the Notice on the Formulation and Implementation of Vehicle Emission Inspection and Maintenance (I/M) System jointly issued by Department of Transportation of Sichuan Province and Department of Ecology and Environment of Sichuan Province. http://jtt.sc.gov.cn/jtt/c101471/2020/12/9/b5c07293c7c84064b4ac062adc6110e2.shtml
- García, M. V., and J. L. Aznarte. 2020. Shapley additive explanations for NO2 forecasting. Ecological Informatics 56:101039.
- Guangtao, L., D. Gong, L. Xing, and D. Zhang. 2021. Ensemble learning based methods for crown prediction of hot-rolled strip: Forming processing and thermomechanical treatment. ISIJ International 61 (5):1603–13.
- Haoyang, S., 2019. Research on prediction of typical vehicle emission factors based on date ming. MA.Sc Thesis. Beijing Jiaotong University.
- Hu, S. X., Y. W. Zhao, and X. H. Li. 2021. Impact of ambient temperature on GDIV emission. Journal of Beijing University of Aeronautics and Astronautics 47 (4):828–34.
- Huo, H., B. Zheng, M. Wang, Q. Zhang, K.-B. He. 2015. Vehicular air pollutant emissions in China: Evaluation of past control policies and future perspectives. Mitigation and Adaptation Strategies for Global Change. 20 (5):719–33. doi:https://doi.org/10.1007/s11027-014-9613-0.
- Kun, L. 2019. Research on Supervision of Motor Vehicle Inspection Institutions in Wuxi. MA.Sc Thesis, East China University of Political Science and Law.
- Lin, Y., J. Y. Wu, K. Lin, Hu, Y., and Kong, G. 2021. Prediction of intensive care unit readmission for critically ill patients based on ensemble learning. Journal of Peking University(Health Sciences) 53 (3):566–72.
- Lohit, V., M. Nikolaos, F. Schmidt Richard, David, V., Omaditya, K., Ahmad, S., Bryan, S., Al Saiegh, F., Reid, G. M., Pascal, J., et al. 2021. A machine learning approach to first pass reperfusion in mechanical thrombectomy: Prediction and feature analysis. Journal of Stroke and Cerebrovascular Diseases 30 (7):105796.
- Lundberg, S. M., G. Erion, H. Chen, A. DeGrave, J. M. Prutkin, B. Nair, R. Katz, J. Himmelfarb, N. Bansal, S.-I. Lee, et al. 2020. From local explanations to global understanding with explainable AI for trees. Nat Mach Intell 2 (1):56–67. doi:https://doi.org/10.1038/s42256-019-0138-9.
- Lundberg, S., and S.-I. Lee. 2017. A unified approach to interpreting model predictions. NIPS'17: Proceedings of the 31st International Conference on Neural Information Processing Systems. NY, United States: Curran Associates Inc. pp. 4768–77.
- Lundberg, S. M., B. Nair, M. S. Vavilala, M. Horibe, M. J. Eisses, T. Adams, D. E. Liston, D. K.-W. Low, S.-F. Newman, J. Kim, et al. 2018. Explainable machine-learning predictions for the prevention of hypoxaemia during surgery. Nat. Biomed, Eng 2 (10):749–60. doi:https://doi.org/10.1038/s41551-018-0304-0.
- MEEPRC (Ministry of Ecology and Environment of the People’s Republic of China), 2020. China mobile source environmental management annual report.
- Mingxing, L., L. Jianhong, A. Clement, Ya, J., Minfei, M., and Xunmei, W. 2021. Zanthoxylum bungeanum Maxim mapping with multi-temporal Sentinel-2 images: The importance of different features and consistency of results. ISPRS Journal of Photogrammetry and Remote Sensing 174:68–86.
- Ministry of Ecology and Environment of the People’s Republic of China. 2018. Limits and measurement methods for emissions from gasoline vehicles under two-speed idle conditions and short driving mode conditions(GB 18285-2018).
- Qiang, D., and W. Zhiyong. 2019. The influence of atmospheric environment on the test results of vehicle emission pollutants. Resource Conservation and Environmental Protection 9:13.
- Raquel, R. P., and B. Jürgen. 2020. Interpretation of compound activity predictions from complex machine learning models using local approximations and shapley values. J. Med. Chem. 63 (16):8761–77.
- SHAP. 2019. Lundberg. https://github.com/slundberg/shap.
- Simsekler Mecit Can EmreN. H. Alhashmi, E. Azar, N. King, R. A. M. A. Luqman, A. Al Mulla. 2021. Exploring drivers of patient satisfaction using a random forest algorithm. BMC Med Inform Decis Mak, 21 (1):157. doi:https://doi.org/10.1186/s12911-021-01519-5
- Tan, Q., H. Liu, S. Xie, L. Zhou, T. Song, G. Shi, W. Jiang, F. Yang, F. Wei. 2020. Temporal and spatial distribution characteristics and source origins of volatile organic compounds in a megacity of Sichuan Basin, China. China Environmental Research, 185(Issue C): 109478. doi:https://doi.org/10.1016/j.envres.2020.109478.
- Yan, X., L. Songdi, Z. Manni, Yi-Ran, W., Ri-Chao, W., Li-Hang, Z., Fei, Y., Zhuang-Min, Z., Li, B., Jiang-Rong, H., et al. 2020. Emission characteristics of light-duty gasoline vehicle exhaust based on acceleration simulation mode. Environmental Science 41 (7):3112–20.
- Yue, X., Y. Wu, J. Hao, Y. Pang, Y. Ma, Y. Li, B. Li, and X. Bao. 2015. Fuel quality management versus vehicle emission control in China, status quo and future perspectives. Energy Policy 79:87–98. doi:https://doi.org/10.1016/j.enpol.2015.01.009.
- Yunhe, L., S. Longlin, H. Wenwei, and Mourong, G. 2013. Study on the influence factors of on-road emission characteristics of automotives. Environmental Pollution & Control 35 (10):42–45.
- Zheng, A., and Casari, A. 2019. Feature engineering for machine learning. Translated by C. Guangxin. Beijing: Posts & Telecom Press.
- Zhihua, Z. 2016. Machine learning. Beijing: Tsinghua University Press.
- Zhimei, Q., X. Yangxiong, Y. Fei, Tian, H., Deng, X., Feng, Z., Han, Y., and Bin, W. 2021. Modelling the initial emissions inspection of urban in-use vehicles with decision trees. Acta Scientiae Circumstantiae 41 (4):1574–83.