
 ?Mathematical formulae have been encoded as MathML and are displayed in this HTML version using MathJax in order to improve their display. Uncheck the box to turn MathJax off. This feature requires Javascript. Click on a formula to zoom.
ABSTRACT
Air pollution and its limits are regulated by the environmental protection agency of an individual country according to their National Ambient Air Quality Standards (NAAQS). Particulate matter (e.g., TSP, PM10, and PM2.5) is one of the important criteria pollutants of NAAQS. Their measurement methods are specified in NAAQS, and detailed technical descriptions are given in standards. This review focuses on the sampling and analysis techniques and methods in the context of PM samplers’ design mentioned in countries specific PM measuring standards (e.g., EPA Part 50, CEN 12341, IS 5182(23), etc.) and their comparison wherever is necessary. It discusses, different designs of PM samplers mentioned in standards and its important components, e.g., size fractionators cutoff efficiency, PM sampler head design, flow measurement, and calibration, and also addresses the important issues that are the limitation of present standards. Our review reveals that most of the country-specific standards show common practice in measuring PM2.5 using WINS impactor and VSCC cyclone as mentioned in EPA Part 50, except European Union (EU) standards, which has different design and parameters. For PM10 measurement, sampler design is different in EU and Indian standards than that of U.S. EPA and other countries’ standards, which is discussed in length here. All standards lack in pointing some inherent problems like change in D50 cutoff of size fractionator of sampler under a high particle mass loading condition, which is common in countries like China and India. Other important issues where most of the standards lack include PM head design and specification, a key component of PM sampler on which the mass measurement results are largely dependent.
Implications: The review paper discusses the air quality standards compliances of different countries and their comparisons. It focuses on the sampling and analysis techniques in context of PM samplers’ design mentioned in countries specific PM measuring standards, and also addresses the important issues that are not mentioned in standards. Therefore, the discussions and findings of the review may be very useful while revising the existing air quality standards of different countries and to fill the research gap in this domain. Further, we have discussed several technical issues described in standards related to PM sampling which may be very helpful for PM sampler designing or modification in current designs as per the prevailing ambient conditions of a country.
Introduction
Globally, the severity of particulate matter (PM) pollution is well known, and its control is a complicated task. Its sources are many (e.g., household, vehicular, industrial, biomass burning, etc.) and not limited to local but regional or intercontinental. Many countries such as the United States of America (USA), European Union (EU), Japan, China, India categorized it as criteria pollutants under their National Ambient Air Quality Standards (NAAQS) (Aggarwal et al. Citation2013; Chow et al. Citation2007; Gilliam and Hall Citation2016; Green et al. Citation2002). The categorization of PM mostly depends on the aerodynamic diameter size of particles (dp). It is divided into three or four subclasses, such as total suspended particulate matter (TSPM/TSP or SPM), respirable suspended particulate matter (RSPM), PM10 (dp ≤ 10 µm) and PM2.5 (dp ≤ 2.5 µm) in most of the NAAQS (Hinds Citation1999). This classification is mainly based on one or more reasons: (i) Direct impact on health, i.e., according to the sizes, particles penetrate in the human respiratory system and in a more general way, the smaller the size of PM, the deeper its penetration in the lungs. Thus, a higher fraction of PM2.5 penetrates deep into the lungs than that of the PM10 fraction (Heydar et al. Citation1986; Soderholm Citation1989). (ii) Ambient particle size distribution, such as PM2.5, lies between accumulation and coarse mode (Seinfeld and Pandis Citation2016). (iii) Differences in the origination of PM, such as PM2.5 emits mainly from burning of biomass, tailpipe, volcanic eruption, firecrackers, chemical industries (Huang et al. Citation2014; Liu et al. Citation2019; Wang et al. Citation2015; Zheng et al. Citation2005), while PM10 emits from mechanical practices including resuspension of existing settled roadside dust (Amato et al. Citation2009; Jancsek-Turoczi et al. Citation2013; Sanchez-Soberon et al. Citation2015). Therefore, size segregated measurement of PM is an important task to understand their fundamentals (Poschl Citation2005), impacts (Ebi and McGregor Citation2008), sources (Bi et al. Citation2007; Chow et al. Citation1992), and also to control the PM pollution by implementing various action plans (Amann et al. Citation2020; Li, Jin, and Kan Citation2019). It is also helpful for weather forecasting (Fernando et al. Citation2012; Stadlober, Hörmann, and Pfeiler Citation2008) and in mapping and validating satellite data to the reference ground-based measurement of PM data (Hong et al. Citation2020; Lin et al. Citation2015).
The ground-level measurements of PM were carried out in one or two ways, i.e., nearly real-time (continuous) and offline (manual) methods. Several manufacturers exploit the principle of optical/laser scattering (Liu, Slaughter, and Larson Citation2002; Zhang, Marto, and Schwab Citation2018) in commercializing instruments for real-time measurements, such as optical particle counter and sizer (OPCS) (Bächler et al. Citation2020; Braniš et al. Citation2005; Peters, Ott, and O’shaughnessy Citation2006), condensation particle counter (Hermann et al. Citation2007), low-cost PM sensor (Kelly et al. Citation2017). The other types of PM monitors which require a physical size segregator (impactor or cyclone) at the inlet to classify PM class are Beta attenuation monitor (BAM) (Gobeli, Schloesser, and Pottberg Citation2008; Macias and Husar Citation1976) and frequency-based devices like tapered element oscillating monitors (TEOM) (Patashnick and Rupprecht Citation1991). Offline or manual measurement primarily consists of mechanical impactors and cyclones that first segregate the particle on the basis of aerodynamic diameter and later the mass of PM determined by weighing the filter before and after the sampling. For size segregation sampling, commonly used devices are Andersen cascade impactor sampler (Andersen Citation1958), PM2.5 Very Sharp Cut Cyclone (VSCC) (Kenny et al. Citation2004), PM2.5 Well Impactor Ninety-Six (WINS) (Peters et al. Citation2001a), etc. In contrast to real-time, the offline methods are more reliable in measurement as they are directly traceable to SI units of related observation, such as particle cutoff, mass, and airflow (Aggarwal et al. Citation2013). The measurement methods based on Optical/laser scattering, radiation absorption, change in frequency can be affected by particle physical property (Rosenberg et al. Citation2012) and meteorological parameters (Shukla and Aggarwal Citation2021). Therefore, most of the nation adopted the manual method as a primary or reference method to measure the particulate matter concentration and perform audit checks of real-time methods (also called secondary or equivalent methods). Further, this filter-based measurement also helps in carrying out chemical analysis for source apportionment study and many other fundamental studies.
Impactors and cyclones play a significant role in carrying out the size-segregated measurements of PM. These devices work on the principles of inertia and centrifugal force (Hinds Citation1999). For ambient PM monitoring, countries like the US and European Nations (EN)/Union (EU) successfully adopt cyclones- and impactors-based samplers (Cao et al. Citation2013). Many countries have adopted these methods as a reference at their NAAQS. In fact, the US and EU have even notified the reference designs of PM samplers in their country-specific standards such as 40 CFR part 50 of US Environment Protection Agency (EPA Citation1998) and EN 12341 (Citation2014) of the EU, and in that they have mentioned the PM10 and PM2.5 designs and measurement procedures. It is common in fast-growing nations like China and India that their NAAQS and standards follow the same principle techniques for measuring PM. However, the problems are still with notified methods, which may be inherent in PM measuring techniques or vary from country to country as per prevailing ambient conditions. Since weather conditions vary from region to region, its effect can reduce measurement quality. Moreover, most countries have accepted either U.S. EPA or EN standards, which may or may not be applicable or suitable to their regions, where weather conditions are different. Therefore, this review discusses the major points affecting PM measurement, especially in terms of
Different setups to measure PMs, focused on size segregator (impactor and cyclone) designs and parameters to evaluate these designs (),
Figure 1. Particulate matter sampling, criteria parameter and measurement techniques.
Flow measurement and calibrations techniques,
Chemical parameters (dependent on PM measurement) notified in NAAQS.
The review starts with standards followed in the US, EU, Japan, and highly populated countries in the world, i.e. China and India. After that, a detailed review of abovesaid factors affecting PMs measurement is done and discussed here.
NAAQS adoption in the world
The US was the first who introduce the standards for TSP in 1971 in its NAAQS regulations (36 FR 8186). The measurement instruments mainly were high-volume samplers (HVS) in these regulations. The sampler consisted of a large filter of 8-inch x 10-inch size, a flow meter, and a vacuum pump that sucks particle-laden air through the filter at the flow rate between 40 and 60 cfm. The mass measurement of collected TSP is being carried out by the gravimetric method. The TSP sampler is defined as the ability to draw particles inside the sampler of size up to 100 µm and requires no particle segregation device (EPA Citation1971). After that, in place of TSP, the PM10 was introduced in 1987 in US NAAQS (52 FR 24634). The basic setup is the same as earlier in TSP HVS, except it has a particle segregation device at the top, followed by the filter and pump unit. This particle segregation device allows only PM10 to be collected on the filter (McFarland and Ortiz Citation1982). The U.S. EPA has defined the PM10 sampler as a respirable particulate matter sampler, which should have a D50 cutoff of 10 µm and particle sampling effectiveness curve according to U.S. EPA PM10 ideal samplers (). They followed the design based on the criteria of the US PM10 convention (EPA Citation1999a) that correlates the health implication of size-selective PM to ambient aerosol sampling devices. summarizes the vital parameter required to assess the size segregating instrument and final sampler.
Table 1. Important parameters and terminology associated with PM Samplers.
Later on, in 1997, the US also included the PM2.5 in its NAAQS (62 FR 38652). In this standard, they have given reference design only for PM 2.5 sampling and don’t lay any basic criteria like their earlier standard for TSP and PM10 sampler. This design is also commonly known as PM2.5 Federal Reference Method (FRM) (EPA, Citation1999a). In this, the setup is based on low-volume sampling (LVS), i.e. 1 m3 h−1 as compared to that of HVS (>1 m3 min−1). The critical designs of the PM10 inlet, PM2.5 WINS impactor, and filter holder are specified. The setup requires a mandatory PM10 segregation inlet followed by a PM2.5 WINS impactor. The low-volume PM10 inlet follows the sampler effectiveness curve of the ideal sampler (), while PM2.5 WINS impactor D50 cutoff is set to be 2.5 ± 0.2 µm (Kenny et al. Citation2004). Along with this, the U.S. EPA has defined the calibration of the cutoff size of particle separators and a scheme for the designation of PM10 and PM2.5 samplers by conducting collocation field sampling at designated sites (EPA Citation2020; Noble et al. Citation2001).
On the other hand, the European Union issued its first directive in 1980 as “Air quality limit values and guide values for sulphur dioxide and suspended particulates” (Directive Citation1980). Subsequently, PM10 and PM2.5 as pollutants and their limits were released in the form of directives in 1996 (Directive Citation1996) and 2008 (Union Citation2008), respectively. Current standards for PM10 and PM2.5 have the flexibility to use both low- to high-volume samplers. The procedure for measurement, uncertainty calculation, and intercomparison of field samplers is defined well in (EN 12341 Citation2014). Moreover, EU standards also provide a reference design for air inlet and particle separators for PM10 and PM2.5 at a flow rate of 2.3 m3 min−1 (EN 12341 Citation2014). The design of reference samplers is different from that of U.S. EPA. However, the D50 cutoff size definition is the same. In comparison to U.S. EPA, the EU PM10 does not follow the effectiveness curve of PM10 ideal samplers of U.S. EPA.
In Japan, the Ministry of Environment (MoE) issues the environment quality standards. Their regulations came into effect in 1973 for SPM (Kawamoto et al. Citation2011) and for PM2.5 in 2009 (Akimoto Citation2017). In contrast to other nations’ NAAQS, Japan is the only nation where PM10 is not included. Japanese standards give the flexibility to use both high- to low-volume samplers for SPM sampling. It has defined basic criteria that SPM samplers must follow, i.e., the penetration efficiency curve for SPM should have a D100 cutoff point at 10 µm (in terms of D50 cutoff equivalent to 7 µm). For PM2.5 sampling, Japan has released its standards (JIS, Citation2008), which have the same reference design and setup as provided by U.S. EPA. However, it has also defined the Geometric Standards Deviation (GSD) or slope calculation for the penetration efficiency curve of size fractionator in PM2.5 sampler as the square root of the ratio of D80 to D20 particle diameters. The GSD here is used to evaluate the particle size distribution of aerosol. In general, for the sampler size fractionator evaluation, the ratio of D84.1 to D15.9 (± 1σ size deviation from median D50 cutoff size) particle diameters is in practice. The field co-comparison (i.e., field comparison including reference sampler and other samplers) of sampler for equivalency test is conducted periodically (JIS Z Citation2008).
In China, the first NAAQS norms (GB 3095–82) was issued in 1982, which included the TSP and PM10 as particulate pollutants (Siddiq et al. Citation1984; Zhao et al. Citation2016). In 2012, PM2.5 was included for the first time in the revised NAAQS (GB Citation3095-2012), which came into effect from 2016 onwards (Jin, Andersson, and Zhang Citation2016). The current standards that measure the ambient PM consist of two measuring methods, i.e., BAM and TEOM, which follow HJ 618 Citation2011 as a reference, which further describes a gravimetric method for the determination of PM10 and PM2.5 mass concentration in ambient air. The standards are comprehensive but different from other nation PM measurement standards. For example, D50 cutoff and GSD are defined for both PM10 and PM2.5 separators in HJ 618 Citation2011. The limit for GSD is ~1.5 and <1.2 for PM10 and PM2.5 separators, respectively, whereas in U.S. EPA and EU standards for these PM classes, the GSD term is not given. It may be because the GSD parameters are dependent on the type of aerosol used. The monodisperse aerosol used for calibration could give lower GSD than polydisperse aerosol for the same PM separator (Du et al. Citation2020; Patel et al. Citation2021). Moreover, in ambient air, the aerosols are polydisperse, and normally, ambient air PM particle size distribution suggests GSD typically lies in between 1.3 and 1.5. With this type of polydispersity, it is challenging to achieve a GSD of <1.2 for the D50 cutoff size of 2.5 µm. The PM10 criteria, like in the U.S. EPA PM10 ideal sampler, is not defined in NAAQS of China and neither mentioned to follow ISO 7708 (Citation1995), which defines sampling based on penetration of particles and different particles size fractions inside the respiratory tract of humans ().
In India, The NAAQS first came into effect in 1982, and the SPM was introduced (CPCB Citation2016). Then, it was revised in 1994, in which PM10 was included, and a regulatory limit was defined for all criteria pollutants (CPCB Citation2012a). In 2009, PM2.5 was incorporated as a criteria pollutant, whereas TSP was withdrawn from the NAAQS (CPCB Citation2009). PM measurement in India also follows some standards and technical documents developed by the Bureau of Indian Standards (BIS) and the Central Pollution Control Board (CPCB). CPCB (Citation2009) gives the flexibility to use all three commonly used methods for PM monitoring purposes. CPCB also published the technical documents and practices for measuring the PM (CPCB Citation2012b). The measurement standards for PM10 in the form of Indian standards (IS) came in 2006 (IS Citation2006), while for PM2.5 in 2019 (IS Citation2019). In PM10 standards, the reference design which is commonly followed in India is given. The design is discussed in the latter part of this review. The standard suggests using high-volume for PM10 gravimetric monitoring. At the same time, for PM2.5, it is mentioned to use the same reference design as given in U.S. EPA standard with PM10 inlet and WINS impactor at a flow rate of 1 m3 min−1. The basic setup is also the same compared to other nations’ measurement standards. However, these standards are not thorough and lack some basic information. For example, according to U.S. EPA in the US, D50 cutoff and sampler designing parameters with minimum criteria are needed with QA/QC requirements, and thus given in standards, whereas in Indian standards, i.e. IS 5182 Part 24 (2019) (IS Citation2019) and CPCB guidelines lack this information. Regarding calibration of PM samplers, the size separators cutoff point calibration is missed and only flow calibration is mentioned. Other parameters such as aspiration efficiency/transport efficiency of PM inlet is also missing.
It is essential to understand the basic structure/setup laid by different nations’ standards and their technical aspects and limitations under certain conditions. describes the basic format of PM measurement and sampling techniques as per NAAQS that is commonly followed in different nations. First, the basic setup is selected based on sampling flow rate, then tagged as LVS or HVS. Most of the PM2.5 sampling is carried out at a low flow rate, while for TSP, SPM, and PM10 sampling flow, much flexibility is given, where LVS, HVS, or MVS (mid-volume sampler) can be used. The basic arrangement is as follows, first the aerosol inlet (PM head) is positioned from where the aerosol is drawn inside the sampler. After that, the inline particle separator segregates the PM into class, i.e. SPM, PM10, and PM2.5. These particle separators are generally called impactors or cyclone separators. These separators allow only the lower fraction of the PM class to move to the filter where it gets deposited or collected. These filters are commonly made up of glass fiber, polytetrafluoroethylene (PTFE), quartz fiber, cellulose ester, etc. The type of filters used varies based on the purpose of sampling.
Figure 2. ISO 7708 and U.S. EPA PM10 ideal effectiveness curve.
PM sampler components
PM head
Sampled particle-laden air enters the sampler through the PM head. Hence, the design of the PM head should be fabricated in such a way as to fulfill the objective that the drawn air inside the sampler is representative of particle concentration (number and size) present in ambient air. Usually, it is a circular annulus in shape to sample particles from all directions uniformly. In most countries, louvered PM inlet design given by U.S. EPA is in practice for low-volume samplers, (Kenny et al. Citation2005). Another notable PM head is the EU reference design, (EN 12341 Citation2014), which is simple in design and smaller than the U.S. EPA reference at low flow (1 m3 h−1). The circumferential inlet diameter of the common high-volume sampler is large such as EPA designated PM10 sampler (EPA Citation2017) (diameter = 700 mm), . Contrary to this design, the Indian reference design as mentioned in BIS (IS Citation2006) and CPCB technical manual is comparatively very small (CPCB Citation2012b) (diameter = 185 mm). And, even smaller than the low-volume U.S. EPA reference louvered inlet (diameter = 246.4 mm), .
Figure 3. U.S. EPA Louvered TSPM inlet.
Figure 4. PM10 or PM2.5 low-volume sampler (European Union).
Figure 5. PM10 high-volume sampler (U.S. EPA and European Union).
Another notable PM inlet, different from all above, is TSPM/SPM (HVS) inlet. Its role as a sampler is currently limited because PM air quality standards shift from TSPM to PM10. However, it is still in use for sampling airborne particles for chemical constituent determination (in particle phase), such as Pb (lead) in air, as mentioned in EPA (Citation2008). shows a typical louvered PM inlet used in TSPM/TSP/SPM or high-volume sampler. The gabled roof or triangular prism-shaped design of the inlet serves two purposes, (i) act as shelter, to protect the filter from direct exposure to external environmental factors such as wind, sunlight, rain, etc., and (ii) to collect the particle uniformly on the filter. However, some issue always exists with designs. In this case, there is a lack of exact design dimension for the gabled roof in air quality standards, which is an issue and vague definition of TSPM (HVS) inlet as pointed out in EPA (Citation1998) and Krug et al. (Citation2017). It says as “(i) The sampler flow rate and the geometry of the shelter favor the collection of particles up to 25–50 µm (aerodynamic diameter), depending on wind speed and direction. (ii) The sampler cover or roof shall overhang the sampler housing somewhat and shall be mounted so as to form an air inlet gap between the cover and the sampler housing walls. This sample air inlet gap should be approximately uniform on all sides of the sampler. The area of the sample air inlet gap must be sized to provide an effective particle capture air velocity of between 20 and 35 cm s−1 at the recommended operational flow rate. The capture velocity is the sample air flow rate divided by the inlet area measured in a horizontal plane at the lower edge of the cover. Ideally, the inlet area and operational flow rate should be selected to obtain a capture air velocity of 25 ± 2 cm s−1.”
PM head design is quantified basically by two important characteristics. The first is the maximum particle size diameter drawn inside the sampler, and the second is its aspiration efficiency. Louvered PM inlet and PM10 size-selective inlet design can intake particles of a maximum of 100 µm at intake velocity of 25 cm s−1 in calm air (Kenny et al. Citation2005). The aspiration efficiency is defined as the mass (or number count) of the particle of a given size in ambient air to the mass of the particle (or number count) of that size inside the sampler’s head. In short, the ratio of these should be close to 1 for a particle size of interest (Liu and Pui Citation1981). It should be noted that after PM head, a size fractionator in the form of impactor or cyclone is present, which can be affected by irregularity in aspiration efficiency of sampler head and consequently the final mass determination of given air samples.
Several studies conducted on louvered PM inlet in show that in the calm wind where the ambient air velocity is lower than PM inlet intake velocity, the aspiration efficiency for bigger size fraction (>10 µm) drops to 80–90% (Lai and Chen Citation2000). While, when the ambient air velocity in the windy condition is higher than sample intake velocity, the aspiration efficiency for 10 µm increases to 120% and decreases gradually with bigger particle size in louvered TSP inlet (Vanderpool et al. Citation2018). The US standard mentioned the requirement of aspiration efficiency of 97% for PM head (40 CFR part E:53.59). Other countries’ standards or guidelines for PM heads lack any such criteria. Many studies on TSP (HVS) gabled roof inlets also show irregularity in particle intake. Studies conducted by Wedding, McFarland, and Cermak (Citation1977) and Krug et al. (Citation2017) explored various factors (wind speed, sampler orientation with respect to wind direction, active or passive sampling state) that can affect TSP (HVS) size-selective performance. Their findings indicate that overall effectiveness decreases as particle size increases and depends on wind direction.
Size fractionators
The core device part of any PM sampler is impactor or cyclone, or both, which primarily governs PM sampler type and its measurement accuracy. Impactors or cyclones are mechanical devices that fractionate the incoming particulate matter in different sizes based on particle aerodynamic diameter. The cutoff size of the impactor or cyclone decides the PM sampler types, and it is generally classified as PM10 or PM2.5 sampler, where the D50 cutoff () is 10 µm or 2.5 µm aerodynamic diameter of particles, respectively (Hinds Citation1999; Marple and Willeke Citation1976). The D50 cutoff is relative to the flow rate and can be changed by varying the flow rate of the PM sampler (Wedding et al. Citation1987). Therefore, the sampler used for size-segregated PM sampling has a fixed and constant sample flow rate. Besides the D50 cutoff, the collection/penetration efficiency curve is defined in terms of GSD () (Peters et al. Citation2001b) and is also an important parameter on which particle mass measurement is dependent. The lower is the GSD, the sharper is the cutoff of impactor and cyclone and thus, the accuracy is better in the mass measurement of that size segregated sampling.
In ambient air monitoring, especially for SPM, PM10, and PM2.5, the collection efficiency curve is defined in ISO (ISO 7708 (Citation1995)) standards. The standard is linked with inhalable particle deposition in the respiratory tract. The deposition of particles depends on particle physical properties, especially their size. ISO 7708 (Citation1995) acts as a bridge between particle size and its collection efficiency in the human respiratory tract to particle measurement sampler/device. Therefore, PM fraction is classified into 3 (sometimes 4) types based on particle penetration into human respiratory system studies. It is classified into highly respirable (PM2.5), respirable (PM4), thoracic (PM10), and inhalable, as shown in . In standard, besides D50 cutoff, the shape, bigger and smaller particle diameter, and corresponding collection efficiency are also important, which sampler designer needs to consider. However, it should be noted that only a few countries have defined the curve according to ISO standards in their NAAQS standards. The U.S. EPA has different conventions for PM10, which differ from ISO 7708 (Citation1995). The U.S. EPA theoretical penetration efficiency curves for ideal PM10 samplers are shown in . Their collection efficiency curve is narrow and reaches up to 15–16 µm at lower effectiveness as compared to ISO 7708 (Citation1995) (thoracic convention). The louvered PM10 (LVS) inlet certified by the U.S. EPA follows the ideal sampler collection efficiency curve (). The European Union EN 12341 followed the ISO curves for the PM10 sampler and explained the design for the PM10 sampler, which is different from the reference design given in U.S. EPA. For PM2.5, the sampler collection efficiency defined in other countries’ standards is the same as the ISO 7708 (Citation1995) highly risk respirable sampling convention. The major designs of different PM size fractionators are reviewed below.
PM10 size fractionator
Louvered PM10 inlet (LVS)
This type of design is commonly used in most countries for PM10 sampling. The design primarily comes in class 1 equivalent and a U.S. EPA reference design for PM10 sampling, . The outlet of PM10 can be coupled with U.S. EPA reference PM2.5 WINS type impactor () or VSCC cyclone (). The PM10 impactor is connected down to a louvered PM head outlet, . The design of the PM10 impactor consists of one accelerating tube which carries particle-laden air. The bigger size particle fraction because of impaction is deposited on the surface below the accelerating tube, while the smaller size particle remains in air trajectory. The smaller size particle lifts and moves out of the three long tubes, extending upward from the impaction surface to the accelerating tube.
The reference design of the PM10 impactor is mentioned in EPA (Citation1998), . It meets two essential criteria set in 40 CFR part 53.40, i.e. D50 cutoff of 10 ± 0.5 µm, and the sampler effectiveness curve should be closed to the ideal sampler or follow PM10 U.S. EPA convention (EPA Citation1998). The GSD is not given as it follows the ideal sampler effectiveness curve. The limit of correct mass measurement on PTFE filters is 200 µg m−3. The field intercomparison of PM10 with other collocating real-time and manual measuring instruments such as optical scattering-based instruments, high-volume PM10 sampler, etc. shows a good linear relationship (CEN Citation2006; Guo et al. Citation2009; Rodes et al. Citation1985; Walden et al. Citation2017). Many field comparisons under different weather conditions and particle concentration in ambient air have been conducted in the past. Some of the unique studies are listed in . McFarland and Ortiz (Citation1984) and Tolocka et al. (Citation2001) conducted detailed studies of this inlet as per the testing protocol of U.S. EPA at different wind speeds with different monodisperse liquid aerosols as test aerosols. Other researchers (Chen and Shaw Citation2007; Faulkner, Smith, and Haglund Citation2014; Lai and Chen Citation2000) have conducted similar studies and found that the D50 cutoff point lies in the range of 9.5–10.5 µm (). The sampler effectiveness curve is close to the U.S. EPA PM10 ideal sampler.
Table 2. Field co-comparisons of various PM samplers.
Very little research has been conducted on bouncing problems of bigger size particle fraction on impaction, which is a common problem in any impaction type particle size classifier (John, Winklmayr, and Wang Citation1991). The bouncing problem is real in an ambient field condition, where the aerosol is polydisperse and consists of both solid and liquid type aerosol. Le et al. (Citation2019) conducted research on coating and new mesh-type material, to resolve the bouncing issue and reduce the need for regular cleaning or maintenance of the impactor. The finding suggests that the bouncing problem can be minimized using the grease/oil coating of the impaction surface up to a certain limit. The reference design of this inlet is also mentioned in other countries’ NAAQS for PM10 sampling and monitoring purposes (HJ 618 Citation2011; IS Citation2019; JIS Z Citation2008).
PM10 size selective inlet (HVS)
As per U.S. EPA, a high-volume sampler (HVS) should have PM sampling flow rate greater than 0.5 m3 min−1 (EPA Citation1999a). This PM10 HVS designed at a flow rate of 1.13 m3 min−1 (40 cfm). The size of the filter on which PM10 gets collected is 8-inch × 10-inch. The design consists of a tube-like nozzle impactor as given in EN 12341 (Citation2014) and reproduced in . The particles laden air entered the PM head and distributed to nine-tube inlet facing downwards to the impaction plate, and then the PM10 fraction is carried by 16 tubes facing upward opposite to the impaction plate. The D50 cutoff and sampler effectiveness curve match the ideal sampler criteria defined by U.S. EPA. An experimental D50 cutoff (Ranade et al. Citation1990) comparison relative to other PM10 samplers is shown in . Several manufacturers and researchers have recommended the oiling of the impaction surface to minimize the bouncing problems. This kind of PM10 HVS was thoroughly studied in the early 70s to date. The linearity with other PM10 samplers is good during field comparisons (Chung et al. Citation2001; Guo et al. Citation2009; Purdue et al. Citation1986; Rajoy et al. Citation2015; Rodes et al. Citation1985) as summarized in .
PM10 cyclone (HVS)
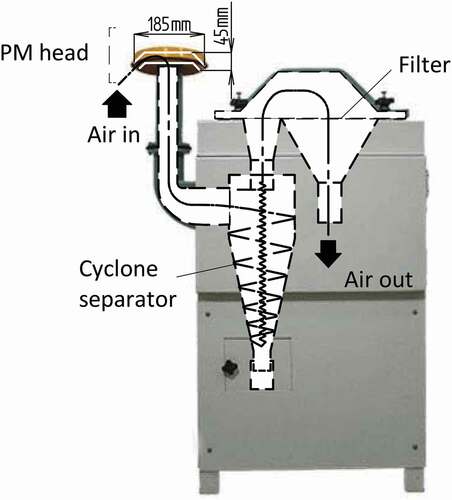
In the early 1990s, PM10 high-volume cyclonic sampler designed in India was introduced (NEERI Citation1992), as shown in . The technical specification of the HVS is similar to US PM10 HVS. The sample flow rate of 1 −1.13 m3 min−1 and the accommodated filter size is 8-inch × 10-inch size to collect PM10. The sampler design consists of a single inlet and outlet cyclone. The particle-laden air enters through PM head to cyclones by an L type bend tube which takes the shape of rectangular cyclone inlet from circular PM head inlet tube, . After segregation by the cyclone, the smaller particle lifts and moves out of the cyclone’s circular outlet to the filter. The cyclone outlet and filter are designed in a way that the top cover of the PM sampler needs to be closed to draw sampled PM from the cyclone outlet to the filter. The arrangement of such a PM10 sampler is prescribed in the CPCB technical manual to monitor PM10 under NAAQS and also in Indian standards published by BIS (CPCB Citation2012b; IS Citation2006).
It is widely used in India and, used by many industries and research organizations for different purposes, such as source apportionment studies (Bhuyan et al. Citation2018; Gupta et al. Citation2018; Jain et al. Citation2020; Karar and Gupta Citation2007). The QA and QC, D50 cutoff check, sampler effectiveness curve, field measurement, and comparison with other equivalent samplers are not available in the public domain or peer-reviewed journals so far, and hence open to further evaluating the efficacy of this PM10 cyclone HVS design. Moreover, even if the cyclonic separation is defined, the PM head is very small (diameter = 185 mm) compared to that of U.S. EPA designated PM10 HVS (diameter = 700 mm), while the flow rate is the same. It results in a higher suction velocity (sample velocity) for drawing particle-laden air inside the PM head in PM10 cyclone (India) than PM10 U.S. EPA. Hence, the sampler draws more particles that follow air trajectory (sample flow) inside the sampler, and it results in oversampling of smaller-sized particles and subsequently undersampling of comparatively bigger-sized particles that do not follow air trajectory (because of inertia) (Kulkarni, Baron, and Willeke Citation2011). In other words, the ratio of fine and coarse particles in sample air does not remain representative of ambient air. Therefore, the PM10 head of the cyclone lacks factors that need to be taken care of while designing the PM inlet. These designing parameters affect the aspiration efficiency of a sampler, such as the size and geometry of the inlet, the velocity of sample flow, etc.
PM10 reference impactor (EN 12341)
EN 12341 acts as the base standard for NAAQS in European Union. The standard mentioned a wide range of PM10 measurement reference design of size-selective fractionators at different flow rates (1 m3 h−1, 2.3 m3 h−1, 30 m3 h−1, and 68 m3 h−1), which cover all three classes of sampler (LVS, MVS, and HVS) (EN 12341 Citation2014). The design of PM10 HVS is similar to the U.S. EPA PM10 sampler, as discussed earlier. The LVS (1 m3 h−1 and 2.3 m3 h−1) is widely used all over Europe. The design of PM10 LVS is different from the U.S. EPA reference design. The fractionator is an impactor that consists of an ambient particle inlet, eight long accelerating tubes, and an impaction plate at the bottom of accelerating tubes, . It together forms the PM10 fractionator. The sampler effectiveness curve is aligned to ISO 7708. These curves were broader (EN 12341 Citation2014) () and different from U.S. EPA PM10 sampler effectiveness curves (Tolocka et al. Citation2001).
Figure 6. TSP high-volume louvered inlet and its dimension in commercially available models.
Figure 7. U.S. EPA low-volume PM10 impactor (reference design).
Very few studies were conducted simultaneously on both EU and U.S. EPA PM10 field sampling (Walden et al., Citation2017). (Tasić et al. Citation2012) performed a field comparison with an optical scattering-based dust monitor. The trend line of co-comparison sampling in ambient PM10, which ranged from 8.8 to 75 µg m−3, is linear between samplers. However, some reports suggest differences in mass measurement as each sampler has a different design and follows a different sampler effectiveness curve (EPA., Citation2012; Helmink et al. Citation2011). Moreover, studies related to its size segregation capabilities (D50 cutoff size) under a high mass loading environment and in different wind speed conditions are limited. Also, as discussed above, none of the standards includes the information and criteria of sampler applicability in a given range of wind velocity, which is an essential factor to maintain aspiration efficiency > 97% and consistency of a PM head performance.
PM2.5 size fractionators
WINS impactor
This is the most commonly used PM2.5 size-selective fractionator. U.S. EPA introduced the reference design in 1996 and called it, Well Impactor Ninety-Six (WINS). The design is simple, rigorously tested, and straightforward (reproduced as shown in ). The inlet is configured to accommodate a PM10 pre-separator to allow only particles smaller than PM10 to be drawn inside the accelerating nozzle of the WINS impactor. The impaction plate is circular well-shaped, and contains an oil-soaked 37 mm filter to trap bigger fraction particles (Vanderpool et al. Citation2007) and prevent particle bouncing and re-entrainment to some extent (EPA Citation1998). Vanderpool et al. (Citation2001a), Vanderpool et al. (Citation2001b), Peters, Vanderpool, and Wiener (Citation2001a) and Peters et al. (Citation2001b) have extensively studied the design and calibration of WINS impactor ().
Figure 8. U.S. EPA low-volume PM2.5 WINS impactor (reference design).
Figure 9. U.S. EPA low-volume PM2.5 VSCC cyclone.
The D50 cutoff size as notified in the U.S. EPA is 2.5 ± 0.2 µm (Kenny et al. Citation2004). This uncertainty in measuring D50 is dependent mainly on WINS impactor development and flow rate fluctuation during measurement. The monodisperse aerosol and reference PSL test aerosol were used to estimate the GSD from the cutoff curves. The GSD estimates were less than 1.2, which is considered the sharp cut impactor category (Vanderpool et al. Citation2001b). The design is widely accepted in the NAAQS standard of China (HJ 618 Citation2011), India (CPCB Citation2012b) and Japan (JIS Z Citation2008). It is interesting to note that the U.S. EPA, which has developed this design, has not mentioned the GSD in its federal regulation. At the same time, countries that adopted the same design have mentioned the GSD (HJ 618 Citation2011) except the Indian standard, where both the term D50 cutoff and GSD are missing. The intercomparison with other equivalent samplers () shows good linearity (Chung et al. Citation2001; Hauck et a. Citation2004; Su et al. Citation2018; Vanderpool et al. Citation2007; Williams et al. Citation2000; Yanosky, Williams, and MacIntosh Citation2002; Young et al. Citation2016). However, the linearity starts decreasing when particle loading is high for a longer period of time. The possible causes determined are the D50 cutoff shift to lower size () because of a change in nozzle end to plate distance ratio (Le and Tsai Citation2017). This D50 cutoff shift can be easily enhanced when fine size particle concentration in ambient air is more than a coarser particle fraction (Chen and Huang Citation1999).
The U.S. EPA has recommended the upper limit to measure PM2.5 concentration in one PTFE filter sample should not exceed 200 µg m−3 (EPA Citation1998). It could be an issue in a region like India where the PM loading is high for most days in a year, primarily in cities that lie in Indo-Gangetic plains (Kaskaoutis et al. Citation2014; Murari et al. Citation2017; Sen et al. Citation2017; Shukla and Aggarwal Citation2021), which adopted the same guidelines and WINS impactor-based PM2.5 sampler to meet the compliance set in NAAQS. Particle loading problems in WINS are investigated in several studies (Kenny Citation1998; Kenny et al. Citation2004; Le and Tsai Citation2017). Few researchers tried to reduce the particle loading effect (accumulation as a tip at the point where nozzle directed the particles on impactor plate) by introducing an injection system that allows continuous cleaning and wetting impaction surface with silicone oil (Le et al. Citation2020a). In contrast, others introduced a cyclonic size separator (e.g. VSCC) that has the same performance (Kenny and Thorpe Citation2001) and requires low maintenance with minimum particle loading effect compared to that of WINS impactor during sampling.
VSCC Cyclone
The Very Sharp Cut Cyclone (VSCC) is another widely used PM2.5 size fractionator. It operates mainly with continuous monitors (Beta Attenuation Method (BAM)) and gravimetric measurement systems. The cyclone is designed at 1 m3 h−1 of flow rate, . The inlet and outlet are configured so that it can replace the WINS impactor and accommodate the PM10 reference inlet at the top. The configuration of the cyclone is horizontal, which means the core cyclone body is perpendicular to the downward airflow direction (Kenny, Thorpe, and Stacey Citation2017). The VSCC cyclone is thoroughly studied by Kenny et al. (Citation2004) for its D50 cutoff and GSD, almost equivalent to the WINS impactor. It resolves the problems in a WINS impactor due to the particle loading effect. Study conducted by Le and Tsai (Citation2017) compared to the WINS impactor shows that it can maintain the D50 cutoff for a longer time. However, the D50 maintenance in some environmental conditions requires further evaluation, where the dew point is significantly lower than the ambient temperature. Under this condition, the particle tends to stick on the inner surface of cyclones (Lin et al. Citation2018), resulting in the impacted particle does not fall/slip in the dust well of the cyclone. This problem can be enhanced when particle loading in the atmosphere is high. Other issues which are reported in VSCC cyclones are purely designing/fabrication related, which causes particle accumulation inside the cyclone during a longer period of sampling (Le et at. Citation2020b; Lin et al. Citation2018). Also, fabrication is complex compared to WINS and needs special machining tools.
Figure 10. Sampler effectiveness curve of various reference PM sampler.
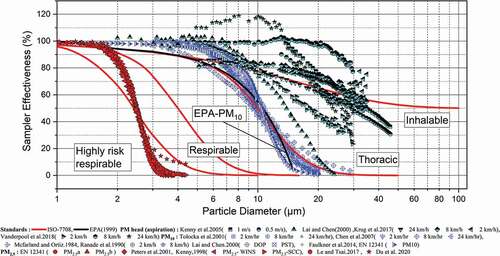
Figure 11. PM10 cyclonic high-volume sampler (India).
Reference PM2.5 sampler (EN 12341)
The reference PM2.5 size fractionator commonly used in Europe has a flow rate of 1 m3 h−1 and 2.3 m3 h−1. Design-wise, it is very similar to the PM10 reference design mentioned in EN 12341 (Citation2014) and discussed earlier in . It differs only in acceleration nozzle diameter, which is considerably smaller, and hence, it gives a D50 cutoff of 2.5 µm. The sampler effectiveness curve and D50 cutoff are shown in . The design lacks pre-separators like PM10 inlet or head and directly separates PM2.5 from ambient aerosol concentration. Therefore, the impactor is not efficient enough to sample the air for a longer period and under high particle loading conditions. Several field studies with other equivalent devices were also conducted to check the linearity. The linearity (consistency) is good under low PM loading concentration (CEN Citation2006; Hauck et al. Citation2004; Tasic et al. Citation2012; Walden et al. Citation2017) () i.e., up to the concentration of 120 µg m−3 as mentioned in EN 12341 (Citation2014), a limit of measurement of this sampler. However, under high ambient PM mass loading conditions, its response requires further investigation (in both contexts, consistency and agreement level with a reference).
Sampling filters
Filters play an important role not only in the collection of ambient aerosols and mass measurement but also to perform chemical characterization of deposited materials. Besides TSP, PM10, and PM2.5, the NAAQS of many countries has notified chemical parameters too such as Pb, Ni, Cd, As, and polyaromatic hydrocarbon (PAH) that also require filters for collection and the final analysis (CPCB Citation2009; EPA Citation2021; Kuklinska, Wolska, and Namiesnik Citation2015). Therefore, it is crucial to choose the filter decisively. Filters also contribute to an error during gravimetric measurement of PM such as loss of volatile particles, artifacts caused by retention of gaseous species on filters such as SO2 and HNO3 in various degrees in filter types like glass fiber, cellulose ester, quartz filter, Teflon filter, etc. (Appel et al. Citation1984). Some filters quality can be directly correlated to its properties, such as its alkalinity (Holland et al. Citation1989). Other measurement errors were caused by ambient temperature and RH, filter handling, and conditioning described in various studies (Brown et al. Citation2006; Lipfert Citation1994; Witz Citation1985; Witz et al. Citation1990). The filter types used for measuring PM classes in multiple countries’ standards show the relative differences. The U.S. EPA for PM10 (HVS) and PM2.5 (LVS) notifies glass fiber filters and Teflon filters with a supportive ring, respectively (EPA Citation1998), which are commonly practiced in other countries’ standards as well. It should also be noted that membrane-type filters such as ringed PTFE consist of structured mesh compared to other filters (glass or quartz), where fiber orientation is random in a filter sheet (Watson et al. Citation2017). Therefore, membrane-type filters have limited loading capacity because of clogging of pores compared to fiber-type filters.
Filters are also prone to electrostatic charging. It can be caused by various actions during filter handling and processing, either by friction, contact, or stripping between materials. This affects the mass of the filter measured initially (clean filter) and finally (particle deposited filter). The filter mass can also be affected by weighing under an uncontrolled environment where humidity and temperature levels vary (Engelbrecht, Cahill, and Feeney Citation1980; Tsai et al. Citation2002). Cellulose ester filters may absorb moisture and increase its weight. The controlled environment and electrostatic charge neutralizer such as Polonium-210 (210Po) (Niemeyer, Case, and Cutshall Citation1978), bipolar or Corona discharge bipolar air ionizer (Tsai et al. Citation2002; Watson et al. Citation2017) is recommended for filter weighing.
Others NAAQS parameters associated to PM sampling
NAAQS of different countries has mentioned other parameters that need to be within the limit. These chemical parameters are basically determined by analyzing the PMs collected on filters, . Their sampling and analytical techniques are mentioned in country-specific standards. In most of the NAAQS, Pb is a common pollutant that is determined in filter samples. However, there is a difference in the method of sampling, filter types for collection, and subclasses of PM for Pb analysis. Earlier, U.S. EPA has mentioned Pb analysis using TSP samples sampled by HVS. Later, PM10 LVS samplers on PTFE filter are also recommended under specific scenarios, as mentioned in 73FR67052 (EPA Citation2008). China recommends mid-volume samplers of flow rate 3–9 m3 h−1 for Pb analysis in TSP glass fiber filter samples. In comparison, EU and Indian regulation for Pb recommends a PM10 filter for analysis. India recommended PM10 HVS to collect particles on a glass fiber filter (EPM-2000) only.
Table 3. Airborne chemical parameter sampled in various PM classes.
Other chemical pollutants in NAAQS are As, Cd, Ni, and BaP. For all these pollutants, different countries have different standards for sample collection. EU notifies As, Cd, Ni and BaP, while India has reported only As, Ni, and BaP determined on the PM10 filter. The only difference is the sampler type used, EU gives the option to use both PM10 HVS and LVS, while India’s regulation recommends PM10 HVS only. China has notified PM10 HVS at a flow rate of 63 m3 h−1 for BaP analysis on glass or quartz filters.
Flow measurement and calibration standards
An important parameter of different size segregated PM samplers is the airflow rate, which should be controlled at a recommended value for a particular sampler throughout the sampling period. This is to maintain a consistent D50 cutoff of the impactor and cyclone and thus measure both PM mass, and total air volume sampled accurately. However, most of the standards lack controlling techniques. Still, all have mentioned a limit of variation from set flow (e.g., U.S. EPA (EPA Citation2016) and EU (EN 12341 Citation2014) allowed 5% variation in the instantaneous flow of LVS, which implies flow control is requisite for any PM sampler.
The sampling flow rate can be measured in two forms using different devices, i.e. (i) volumetric flow and (ii) mass flow. The differences between them are well known. The volumetric flow varies with actual temperature and pressure, while the mass flow rate does not vary with temperature and pressure. The impactors and cyclones work on the volumetric flow of air to maintain their D50 cut off and for the final measurement of PM mass concentration. Hence, measuring and controlling the flow inside the sampler volumetrically is necessary and taking it as actual flow. Even though the mass flow meter and controller are employed to maintain the fixed flow, it should also be converted into the volumetric flow (actual flow). The standards and manuals of U.S. EPA (EPA Citation1999b), Japan (JIS Z Citation2008) and EU (EN 12341 Citation2014) give an insight of conversion of mass flow to actual volumetric flow and vice versa. It is also important to note that first, the flow reads by a flow meter should be converted to real value by considering the conditions at which it was calibrated (temperature and pressure). Then this value is further converted to flow at actual conditions (Hinds Citation1999). However, this two-step calculation is not clearly mentioned in any standards.
The flow calibration method of PM sampler varies with sampler types, i.e. HVS and LVS. The US and other countries’ standards mention the calibration of HVS with orifice or resistance plate (old method), which is directly based on pressure difference in flow caused by orifice deployed at the inlet of HVS. The volumetric flow meter of HVS is calibrated using this method. It is also known as transfer standards for field calibration of HVS. The primary method to calibrate the transfer standards is by using a direct volumetric flow meter, i.e., Roots meter or positive displacement flowmeters (EPA Citation1999b).
The LVS requires a different approach for the calibration of flow. The standards employ different types of flow meters. The preferable ones are the flow meters that do not obstruct the operations of LVS. It includes bubble, piston, mass, orifice, laminar, wet test and dry gas type flow meters described in the U.S. EPA quality assurance guidance document (EPA Citation2016) and Japanese PM2.5 sampling standards (JIS Z Citation2008). In both types of samplers, the temperature and pressure need to be monitored during sampling and perform calibration procedures for correction and conversion to standard and actual volumetric flow. Therefore, calibration of supporting devices is also necessary. Other essential parameters requiring calibration are the timer (sampler clock), power supply, etc. However, the procedure/guidelines on these calibrations are not given in the standards except U.S. EPA standards.
Summary and conclusion
National ambient air quality standards (NAAQS) differ in most parts of the world in terms of criteria pollutant’s types, their regulation limits, monitoring methods, techniques used, etc. This is because the criteria pollutants and their ambient concentration are region-specific. However, one of the most common criteria pollutants in all NAAQS is particulate matter (PM). Nevertheless, the instrument/device used for the measurement of PM varies significantly in terms of design and operating parameters in the NAAQS and related standards. Therefore, here we reviewed several NAAQS and also standards (U.S. EPA, JIS, CN, CEN, ISO, IS, etc.) of different countries in context to PM measurements.
We observed that in country-specific PM10 measurement practices, where samplers differ a lot in terms of design, operating flow rate and sampler effectiveness curve, etc. but in some cases, it uses the same techniques, e.g. in PM2.5 measurements, Japan, China and India follow U.S. EPA standards. The QA/QC in PM measurement is mostly validated by D50 cutoff calibration and field intercomparisons (collocating measurement using different instruments). In addition to this, the filter used for the chemical analysis of some criteria pollutants and requirement of sampling type differs widely in countries specific standards. Issues which are needed to be taken care of in measurement standards are summarized as follows;
Aspiration efficiency of PM samplers is one of the designing parameters that is ignored in all standards. It is one of the essential parameters required for the evaluation of PM heads that draw representative PM samples from the air for the accurate determination of SPM and PM10 mass. It is known that apart from inlet design, the aspiration efficiency of a sampler inlet could be affected by ambient wind speed and sampling flow rate, but no standards talk about the criteria of applicability of a sampler under the defined wind velocity conditions. Also, very limited research has been reported on this, especially co-comparison study of different countries’ sampler inlets.
D50 cutoff defines the class of PM sampler. However, only a few standards have mentioned the D50 cutoff calibration method, while others implicitly mentioned the D50. The test material used for calibration is still a matter of discussion. Standards suggest the use of monodisperse aerosol (mostly liquid aerosol) for cutoff calibration which is not only time consuming (generating specific size test aerosols) but also requires capital to set the testing facility. A polydisperse test aerosol (e.g. Arizona road dust or other ambient aerosol reference materials) could be the alternate option (as secondary standard) for calibration, which not only can give quick replicative tests but also requires comparatively less capital to set a testing facility. Lastly, the cutoff size and factors that contribute to its uncertainty along with calculations should also be incorporated in standards.
Consistently high ambient PM loading is also an issue that may not be an issue for countries like the US, EU, and Japan, where ambient PM levels are comparatively low in comparison to China and India. These countries adopted similar PM measurement standards as mentioned in U.S. EPA. The scope of the U.S. EPA standards is clearly defined, e.g. for PM2.5 measurements, it sets the limit of 200 µg m−3 in 24 hours sampling. But in India and China in some seasons, it crosses the set limit for a consistent period of days, which could change the D50 cutoff size to a lower size and results in large uncertainties in measuring the PM10 and PM2.5 unintentionally. Therefore, it is important to implement a method (inlet design) that can withstand a longer duration of sampling and have the minimum effect of particle loading under prevailing ambient conditions.
For PM2.5 sampling, the EU has given its own design at a low flow rate of 1 and 2.3 m3 h−1. The design does not consist of any PM10 pre-separators like U.S. EPA reference louvered PM10 inlet before PM2.5 WINS impactor. This may cause frequent shifts in D50 cutoff in EU reference design because the PM2.5 impactor has to segregate the PM2.5 from ambient TSP directly and hence more possibility of deposition of bigger size fraction (greater than PM2.5) on the impaction plate and results in a frequent shift in D50 cutoff, that is minimized in U.S. EPA PM2.5 reference samplers. However, the PM2.5 impactor of EU design has multiple nozzles which are preferable to reduce the particle bouncing and re-entrainment problem that can be an issue in a single nozzle design (like WINS), especially under high particle mass loading conditions.
Flow measurement and controlling of flow is another aspect of PM samplers. Indirect flow measuring devices, e.g. anemometer, mass flow meter, flow pressure sensing devices are widely in use to control the flow in a sampler. Sometimes, during the long and unattended run, the biases in flow sensing devices result in fluctuation in flow rate. Therefore, standards also need to clarify the mechanism for flow control and also the procedure to check the quality of flow measuring devices under laboratory (standard) and field conditions. Other issues are with the clarity in representing the flow (volumetric or mass) to the actual flow for the final calculation of PM concentration in samplers.
Acknowledgment
This is a part of internal project funding, OLP 183832. Director, CSIR-NPL is acknowledged for providing all support. PP thanks to DST, New Delhi for providing JRF/SRF fellowship under a project (IDP/IND/17/2013). All members of the Gas Metrology group are also acknowledged for their all support and help.
Disclosure statement
No potential conflict of interest was reported by the author(s).
Data availability statement
Data available on reasonable request from the corresponding author.
Additional information
Notes on contributors
Prashant Patel
Prashant Patel is a Senior Research Fellow (SRF) in Gas Metrology, Environmental Sciences & Biomedical Metrology Division at CSIR-National Physical Laboratory, New Delhi and pursuing Ph.D. degree from the Academy of Scientific and Innovative Research (AcSIR), Ghaziabad, India. His current focus of research is the designing of particulate matter samplers and their cutoff size measurement.
Shankar G. Aggarwal
Shankar G. Aggarwal is a Senior Principal Scientist at CSIR-National Physical Laboratory, New Delhi. His current research interests are particle and gas metrology, aerosol chemistry and physics, air quality measurement and instrumentation, control technology development and measurement.
References
- Aggarwal, S. G., S. Kumar, P. Mandal, B. Sarangi, K. Singh, J. Pokhariyal, S. K. Mishra, S. Aggarwal, D. Sinha, S. Singh, et al. 2013. Traceability issue in PM2.5 and PM10 measurements. Mapan 28 (3):153–66. doi:https://doi.org/10.1007/s12647-013-0073-x.
- Akimoto, H. 2017. Overview of policy actions and observational data for PM2.5 and O3 in Japan: A study of urban air quality improvement in Asia. JICA Res. Inst. Tokyo. 137:1–19.
- Amann, M., G. Kiesewetter, W. Schöpp, Z. Klimont, W. Winiwarter, J. Cofala, P. Rafaj, L. Höglund-Isaksson, A. Gomez-Sabriana, C. Heyes, et al. 2020. Reducing global air pollution: The scope for further policy interventions. Philos. Trans. R. Soc. A. 378 (2183):20190331. doi:https://doi.org/10.1098/rsta.2019.0331.
- Amato, F., M. Pandolfi, M. Viana, X. Querol, A. Alastuey, and T. Moreno. 2009. Spatial and chemical patterns of PM10 in road dust deposited in urban environment. Atmos. Environ. 43 (9):1650–59. doi:https://doi.org/10.1016/j.atmosenv.2008.12.009.
- Andersen, A. 1958. A new sampler for the collection, sizing and enumeration of viable airborne. J. Bacteriol. 76 (5):471–84. doi:https://doi.org/10.1128/jb.76.5.471-484.1958.
- Appel, B. R., Y. Tokiwa, M. Haik, and E. L. Kothny. 1984. Artifact particulate sulfate and nitrate formation on filter media. Atmos. Environ. 18 (2):409–16. doi:https://doi.org/10.1016/0004-6981(84)90116-1.
- Bächler, P., J. Szabadi, J. Meyer, and A. Dittler. 2020. Simultaneous measurement of spatially resolved particle emissions in a pilot plant scale baghouse filter applying distributed low-cost particulate matter sensors. J. Aerosol. Sci. 150:105644. doi:https://doi.org/10.1016/j.jaerosci.2020.105644.
- Bhuyan, P., P. Deka, S. B. Amit Prakash, and R. Rafiqul Hoque. 2018. Chemical characterization and source apportionment of aerosol over mid Brahmaputra Valley, India. Environ. Pollut. 234:997–1010. doi:https://doi.org/10.1016/j.envpol.2017.12.009.
- Bi, X., Y. Feng, J. Wu, Y. Wang, and T. Zhu. 2007. Source apportionment of PM10 in six cities of northern China. Atmos. Environ. 41 (5):903–12. doi:https://doi.org/10.1016/j.atmosenv.2006.09.033.
- Braniš, M., and J. Hovorka. 2005. Performance of a photometer DustTrak in various indoor and outdoor environments. In Proceedings of the Evaluations and Assessment Conference, Ghent, Belgium, 28:535.
- Brown, A. S., R. E. Yardley, P. G. Quincey, and D. M. Butterfield. 2006. Studies of the effect of humidity and other factors on some different filter materials used for gravimetric measurements of ambient particulate matter. Atmos. Environ. 40 (25):4670–78. doi:https://doi.org/10.1016/j.atmosenv.2006.04.028.
- Cao, J., J. C. Chow, F. S. C. Lee, and J. G. Watson. 2013. Evolution of PM2.5 measurements and standards in the US and future perspectives for China. Aerosol. Air Qual. Res. 13 (4):1197–211. doi:https://doi.org/10.4209/aaqr.2012.11.0302.
- CEN. 2006. Field test experiments to validate the CEN standard measurement method for PM2.5. VDI – The Association of German Engineers. Accessed June 25, 2021. https://www.vdi.de/fileadmin/pages/vdi_de/redakteure/ueber_uns/fachgesellschaften/KRdL/dateien/WG_15_EUR22341.pdf
- Chen, C.-C., and S.-H. Huang. 1999. Shift of aerosol penetration in respirable cyclone samplers. Am. Ind. Hyg. Assoc. J. 60 (6):720–29. doi:https://doi.org/10.1080/00028899908984494.
- Chen, J., and B. W. Shaw. 2007. Aspiration and Sampling Efficiencies of Louvered PM10 Dichotomous Inlet. In International Symposium on Air Quality and Waste Management for Agriculture, 16-19 September 2007, Broomfield, Colorado, American Society of Agricultural and Biological Engineers. 19.
- Chow, J. C., J. G. Watson, H. J. Feldman, J. E. Nolen, B. Wallerstein, G. M. Hidy, P. J. Lioy, H. Mckee, D. Mobley, K. Baugues, et al. 2007. Will the circle be unbroken: A history of the US National Ambient Air Quality Standards? J. Air Waste Manage. Assoc. 57 (10):1151–63. doi:https://doi.org/10.3155/1047-3289.57.10.1151.
- Chow, J. C., J. G. Watson, D. H. Lowenthal, P. A. Solomon, K. L. Magliano, S. D. Ziman, and L. W. Richards. 1992. PM10 source apportionment in California’s San Joaquin Valley. Atmos. Environ. Part A. 26 (18):3335–54. doi:https://doi.org/10.1016/0960-1686(92)90350-T.
- Chung, A., D. P. Y. Chang, M. J. Kleeman, K. D. Perry, T. A. Cahill, D. Dutcher, E. M. McDougall, and K. Stroud. 2001. Comparison of real-time instruments used to monitor airborne particulate matter. J. Air Waste Manage. Assoc. 51 (1):109–20.
- CPCB. 2009. National Ambient Air Quality Standards. Central Pollution Control Board, New Delhi. Accessed June 25, 2021. https://cpcb.nic.in/air-quality-standard/
- CPCB. 2012a. Air pollution in Delhi. Central Pollution Control Board, New Delhi. Accessed June 25, 2021. https://cpcb.nic.in/openpdffile.php?id=UmVwb3J0RmlsZXMvMzJfMTQ1ODEyNjU5MV9OZXdJdGVtXzE5Ml9OQUFRU1RJLnBkZg==
- CPCB. 2012b. Guidelines for the Measurement of Ambient Air Pollutants. Central Pollution Control Board, New Delhi. Accessed June 25, 2021. http://mahenvis.nic.in/Pdf/Report/report_epm_NAAQMS%20.pdf
- CPCB. 2016. Air pollution in Delhi. Central Pollution Control Board, New Delhi. Accessed June 25, 2021. http://cpcbenvis.nic.in/envis_newsletter/air%20pollution%20in%20delhi.pdf
- Directive, C. 1980. Air quality limit values and guide values for sulphur dioxide and suspended particulates. Eur-Lex. Accessed June 25, 2021. https://eur-lex.europa.eu/legal-content/EN/ALL/?uri=celex:31980L0779
- Directive, C. 1996. Ambient air quality assessment and management. Eur-Lex. Accessed June 25, 2021. https://eur-lex.europa.eu/legal-content/EN/TXT/?uri=CELEX%3A31996L0062
- Du, P., J. Liu, H. Gui, J. Zhang, Y. Tongzhu, J. Wang, Y. Cheng, Lu, Y., Yao, Y., Fu, Q., and Chen, C. C. 2020. Development of a static test apparatus for evaluating the performance of three PM2.5 separators commonly used in China. J. Environ. Sci. 87:238–49.
- Ebi, K. L., and G. McGregor. 2008. Climate change, tropospheric ozone and particulate matter, and health impacts. Environ. Health Perspect. 116 (11):1449–55. doi:https://doi.org/10.1289/ehp.11463.
- EN 12341. 2014. Ambient air. Standard gravimetric measurement method for the determination of the PM10 or PM2.5.
- EN 14902. 2005. Ambient air quality—Standard method for the measurement of Pb, Cd, As and Ni in the PM10 fraction of suspended particulate matter.
- EN 15549. 2008. Air quality. Standard method for the measurement of the concentration of benzo(a)pyrene in ambient air.
- Engelbrecht, D. R., T. A. Cahill, and P. J. Feeney. 1980. Electrostatic effects on gravimetric analysis of membrane filters. Journal of the J Air Pollut. Control Assoc. 30 (4):391–92. doi:https://doi.org/10.1080/00022470.1980.10466000.
- EPA, Sweden. 2012. An Equivalence Study of PM10 Instruments at a Road Traffic Site: A study in Stockholm Spring 2012. Accessed June 30, 2021. https://www.diva-portal.org/smash/get/diva2:847448/FULLTEXT01.pdf
- EPA. 1971. 42 FR part 410, National Primary and Secondary Ambient Air Quality Standards.
- EPA. 1998. 40 CFR part 50, National Primary and Secondary Ambient Air Quality Standards.
- EPA. 1999a. 40 CFR part 50, National Primary and Secondary Ambient Air Quality Standards.
- EPA. 1999b. Compendium of methods for the determination of toxic organic compounds in ambient air, 2nd edition, Compendium method TO-4A, EPA/625/R-96/010b,1999.
- EPA. 2008. National Ambient Air Quality Standards for Lead (Final rule). Fed. Regist. 66964 (73):219.
- EPA. 2016. Monitoring PM2.5 in Ambient Air Using Designated Reference or Class I Equivalent Methods. Quality Assurance Guidance Document 2.12. North Carolina: US Environmental Protection Agency.
- EPA. 2017. List of designated reference and equivalent methods. North Carolina: US Environment Protection Agency.
- EPA. 2020. 40 CFR part 50 appendix J, Reference Method for the Determination of Particulate Matter as PM10 in the Atmosphere.
- EPA. 2021. 40 CFR part 50.16, National primary and secondary ambient air quality standards for lead.
- Faulkner, W. B., R. Smith, and J. Haglund. 2014. Large particle penetration during PM10 sampling. Aerosol Sci Technol. 48 (6):676–87. doi:https://doi.org/10.1080/02786826.2014.915005.
- Fernando, H. J., M. C. Mammarella, G. Grandoni, P. Fedele, R. Di Marco, R. Dimitrova, and P. Hyde. 2012. Forecasting PM10 in metropolitan areas: Efficacy of neural networks. Environ. Pollut. 163:62–67. doi:https://doi.org/10.1016/j.envpol.2011.12.018.
- GB 3095. 2012. Ambient air quality standards. China: Ministry of Ecology and Environment.
- GB/T 15264. 1994. Ambient air. Determination of lead-Flame atomic absorption spectrophotometric method.
- Ghim, Y. S., Y. Choi, J. Park, P. Kim, and Y. Kyung Han. 2017. Comparison of PM2.5 Concentrations by Measurement Method. J Korean Soc Atmos. Environ. 33 (5):515–20. doi:https://doi.org/10.5572/KOSAE.2017.33.5.515.
- Gilliam, J., and E. Hall. 2016. Reference and Equivalent Methods Used to Measure National Ambient Air Quality Standards (NAAQS) Criteria Air Pollutants-Volume IUS Environmental Protection Agency. Washington, DC: Environmental Protection Agency.
- Gobeli, D., H. Schloesser, and T. Pottberg. 2008. Met one instruments BAM-1020 beta attenuation mass monitor U.S. EPA PM2.5 federal equivalent method field test results. In The Air & Waste Management Association (A&WMA) Conference, Kansas City, MO. Vol. 2, No. 3.
- Green, L. C., E. A. Crouch, M. R. Ames, and T. L. Lash. 2002. What’s wrong with the National Ambient Air Quality Standard (NAAQS) for fine particulate matter (PM2.5)? Regul. Toxicol. Pharmacol. 35 (3):327–37. doi:https://doi.org/10.1006/rtph.2002.1548.
- Guo, L., R. G. Maghirang, E. B. Razote, J. G. Tallada, J. P. Harner III, and W. L. Hargrove. 2009. Field comparison of PM10 samplers. Appl. Eng. Agric. 25 (5):737–44. doi:https://doi.org/10.13031/2013.28852.
- Gupta, S., R. Gadi, S. K. Sharma, and Mandal, T. K. 2018. Characterization and source apportionment of organic compounds in PM10 using PCA and PMF at a traffic hotspot of Delhi. Sustain. Cities Soc. 39:52–67. doi:https://doi.org/10.1016/j.scs.2018.01.051.
- Hauck, H., A. Berner, B. Gomiscek, S. Stopper, H. Puxbaum, M. Kundi, and O. Preining. 2004. On the equivalence of gravimetric PM data with TEOM and beta-attenuation measurements. J. Aerosol. Sci. 35 (9):1135–49. doi:https://doi.org/10.1016/j.jaerosci.2004.04.004.
- Helmink, H. J. P., P. C. Koopman, M. Hoonhout, and D. de Jonge. 2011. EU PM10 inlets compared to EPA inlets. GGD Amsterdam, Report No.: GGD/LO 11-1162.
- Hermann, M., B. Wehner, O. Bischof, H.-S. Han, T. Krinke, W. Liu, A. Zerrath, and A. Wiedensohler. 2007. Particle counting efficiencies of new TSI condensation particle counters. J. Aerosol. Sci. 38 (6):674–82. doi:https://doi.org/10.1016/j.jaerosci.2007.05.001.
- Heyder, J. J. G. C. F. W., J. Gebhart, G. Rudolf, C. F. Schiller, and W. Stahlhofen. 1986. Deposition of particles in the human respiratory tract in the size range 0.005–15 μm. J. Aerosol. Sci. 17 (5):811–25. doi:https://doi.org/10.1016/0021-8502(86)90035-2.
- Hinds, W. C. 1999. Aerosol technology: Properties, behavior, and measurement of airborne particles. New York: John Wiley & Sons.
- HJ 618. 2011. Determination of atmospheric articles PM10 and PM2.5 in ambient air by gravimetric method. China: Ministry of Ecology and Environment.
- HJ 956. 2018. Ambient air. Determination of benzo[a]pyrene-High performance liquid chromatography. China: Ministry of Ecology and Environment.
- Holland, J. C., R. M. Harrell, B. R. Appel, and E. L. Kothny. 1989. Measurement of the alkalinity of filter media. J Air Pollut. Control Assoc. 39 (1):58–62.
- Hong, J., F. Mao, Q. Min, Z. Pan, W. Wang, T. Zhang, and W. Gong. 2020. Improved PM2.5 predictions of WRF-Chem via the integration of Himawari-8 satellite data and ground observations. Environ. Pollut. 263:114451. doi:https://doi.org/10.1016/j.envpol.2020.114451.
- Huang, Y., H. Shen, H. Chen, R. Wang, Y. Zhang, S. Su, Y. Chen, N. Lin, S. Zhou, Q. Zhong, et al. 2014. Quantification of global primary emissions of PM2.5, PM10, and TSP from combustion and industrial process sources. Environ. Sci. Technol. 48 (23):13834–43. doi:https://doi.org/10.1021/es503696k.
- IS. 2004. IS 5182: Methods for measurement of air pollution: Part 12 Polynuclear aromatic hydrocarbons in particulate matter. Bureau of Indian Standards. Accessed July 6, 2021.
- IS. 2006. IS 5182:Methods for measurement of air pollution: Part 23 respirable suspended particulate matter (PM 10), cyclonic flow technique. Delhi, India: Bureau of Indian Standards. Accessed July 6, 2021. https://shorturl.at/clvIY
- IS. 2019. IS 5182:Methods for Measurement of Air Pollution Part 24 Fine Particulate Matter (PM2.5). Delhi, India: Bureau of Indian Standards. Accessed July 6, 2021. https://shorturl.at/cqsIL
- ISO 7708. 1995. International Organization for Standardization (ISO) 7708: Particle size definitions for health-related sampling.
- Jain, S., S. K. Sharma, N. Vijayan, and T. K. Mandal. 2020. Seasonal characteristics of aerosols (PM2.5 and PM10) and their source apportionment using PMF: A four year study over Delhi, India. Environ. Pollut. 262:114337. doi:https://doi.org/10.1016/j.envpol.2020.114337.
- Jancsek-Turóczi, B., A. Hoffer, I. Nyírő-Kósa, and A. Gelencsér. 2013. Sampling and characterization of resuspended and respirable road dust. J. Aerosol. Sci. 65:69–76. doi:https://doi.org/10.1016/j.jaerosci.2013.07.006.
- Jin, Y., H. Andersson, and S. Zhang. 2016. Air pollution control policies in China: A retrospective and prospects. Int. J. Environ. Res. Public Health. 13 (12):1219. doi:https://doi.org/10.3390/ijerph13121219.
- JIS Z 8851. 2008. Sampler of PM2.5 in Ambient Air. Tokyo, Japan: JISC-Japanese Industrial Standards Committee.
- John, W., W. Winklmayr, and H.-C. Wang. 1991. Particle deagglomeration and reentrainment in a PM10 sampler. Aerosol Sci. Technol. 14 (2):165–76. doi:https://doi.org/10.1080/02786829108959480.
- Karar, K., and A. K. Gupta. 2007. Source apportionment of PM10 at residential and industrial sites of an urban region of Kolkata, India. Atmos. Res. 84 (1):30–41. doi:https://doi.org/10.1016/j.atmosres.2006.05.001.
- Kaskaoutis, D. G., S. Kumar, D. Sharma, R. P. Singh, S. K. Kharol, M. Sharma, A. K. Singh, S. Singh, A. Singh, and D. Singh. 2014. Effects of crop residue burning on aerosol properties, plume characteristics, and long‐range transport over northern India. J Geophys Res. 119 (9):5424–44. doi:https://doi.org/10.1002/2013JD021357.
- Kawamoto, T., T. Matsuda, T. Oyama, M. Tanaka, Y. Hsu-Sheng, and I. Uchiyama. 2011. Historical review on development of environmental quality standards and guideline values for air pollutants in Japan. Int. J. Hyg. Environ. Health. 214 (4):296–304. doi:https://doi.org/10.1016/j.ijheh.2011.05.007.
- Kelly, K. E., J. Whitaker, A. Petty, C. Widmer, A. Dybwad, D. Sleeth, R. Martin, and A. Butterfield. 2017. Ambient and laboratory evaluation of a low-cost particulate matter sensor. Environ. Pollut. 221:491–500. doi:https://doi.org/10.1016/j.envpol.2016.12.039.
- Kenny, L. C. 1998. Investigation of the effects of loading on PM2.5 selectors. Sheffield, UK: Report of Health and Safety Laboratory.
- Kenny, L., G. Beaumont, A. Gudmundsson, A. Thorpe, and W. Koch. 2005. Aspiration and sampling efficiencies of the TSP and louvered particulate matter inlets. Environ. Monit. Assess. 7 (5):481–87. doi:https://doi.org/10.1039/b419001g.
- Kenny, L. C., T. Merrifield, D. Mark, R. Gussman, and A. Thorpe. 2004. The Development and Designation Testing of a New USEPA-Approved Fine Particle Inlet: A Study of the USEPA Designation Process. Aerosol Sci. Technol. 38 (S2):15–22. doi:https://doi.org/10.1080/027868290502290.
- Kenny, L. C., and A. Thorpe. 2001. Evaluation of VSCC cyclones. Health & Safety Laboratory Report# IR/L/EXM/01/01.
- Kenny, L. C., A. Thorpe, and P. Stacey. 2017. A collection of experimental data for aerosol monitoring cyclones. Aerosol Sci Technol. 51 (10):1190–200. doi:https://doi.org/10.1080/02786826.2017.1341620.
- Krug, J. D., A. Dart, C. L. Witherspoon, J. Gilberry, Q. Malloy, S. Kaushik, and R. W. Vanderpool. 2017. Revisiting the size selective performance of EPA’s high-volume total suspended particulate matter (Hi-Vol TSP) sampler. Aerosol Sci Technol. 51 (7):868–78. doi:https://doi.org/10.1080/02786826.2017.1316358.
- Kuklinska, K., L. Wolska, and J. Namiesnik. 2015. Air quality policy in the US and the EU–a review. Atmos. Pollut. Res. 6 (1):129–37. doi:https://doi.org/10.5094/APR.2015.015.
- Kulkarni, P., P. A. Baron, and K. Willeke, Eds. 2011. Aerosol measurement: Principles, techniques, and applications. New York: John Wiley & Sons.
- Lai, C.-Y., and C.-C. Chen. 2000. Performance characteristics of PM10 samplers under calm air conditions. J. Air Waste Manage. Assoc. 50 (4):578–87. doi:https://doi.org/10.1080/10473289.2000.10464029.
- Le, T.-C., F. Chang-Xing, J.-C. Sung, L. Zi-Yi, D. Y. H. Pui, and C.-J. Tsai. 2020a. The performance of the PM2.5 VSCC and oil-wetted M-WINS in long-term field sampling studies. Atmos. Environ. 239:117804. doi:https://doi.org/10.1016/j.atmosenv.2020.117804.
- Le, T.-C., K. Kumar Shukla, Y.-T. Chen, S.-C. Chang, T.-Y. Lin, L. Ziyi, D. Y. H. Pui, and C.-J. Tsai. 2020b. On the concentration differences between PM2.5 FEM monitors and FRM samplers. Atmos. Environ. 222:117138. doi:https://doi.org/10.1016/j.atmosenv.2019.117138.
- Le, T.-C., K. Kumar Shukla, J.-C. Sung, L. Ziyi, H. Yeh, W. Huang, and C.-J. Tsai. 2019. Sampling efficiency of low-volume PM10 inlets with different impaction substrates. Aerosol Sci. Technol. 53 (3):295–308. doi:https://doi.org/10.1080/02786826.2018.1559919.
- Le, T.-C., and C.-J. Tsai. 2017. Novel non-bouncing PM2.5 impactor modified from well impactor ninety-six. Aerosol Sci. Technol. 51 (11):1287–95. doi:https://doi.org/10.1080/02786826.2017.1341621.
- Li, X., L. Jin, and H. Kan. 2019. Air pollution: A global problem needs local fixes. Nature 570:437–39. doi:https://doi.org/10.1038/d41586-019-01960-7.
- Lin, C.-W., T.-J. Chen, S.-H. Huang, Y.-M. Kuo, H.-Q. Gui, and C.-C. Chen. 2018. Effect of aerosol loading on separation performance of PM2.5 cyclone separators. Aerosol. Air Qual. Res. 18 (6):1366–74. doi:https://doi.org/10.4209/aaqr.2017.11.0458.
- Lin, C., Y. Li, Z. Yuan, A. K. Lau, C. Li, and J. C. Fung. 2015. Using satellite remote sensing data to estimate the high-resolution distribution of ground-level PM2.5. Remote Sens. Environ. 156:117–28. doi:https://doi.org/10.1016/j.rse.2014.09.015.
- Lipfert, F. W. 1994. Filter artifacts associated with particulate measurements: Recent evidence and effects on statistical relationships. Atmos. Environ. 28 (20):3233–49. doi:https://doi.org/10.1016/1352-2310(94)00167-J.
- Liu, J., Y. Chen, S. Chao, H. Cao, and A. Zhang. 2019. Levels and health risks of PM2.5-bound toxic metals from firework/firecracker burning during festival periods in response to management strategies. Ecotoxicol. Environ. Safety. 171:406–13. doi:https://doi.org/10.1016/j.ecoenv.2018.12.104.
- Liu, B. Y. H., and D. Y. H. Pui. 1981. Aerosol sampling inlets and inhalable particles. Atmos. Environ. 15 (4):589–600. doi:https://doi.org/10.1016/0004-6981(81)90190-6.
- Liu, L. J. S., J. C. Slaughter, and T. V. Larson. 2002. Comparison of light scattering devices and impactors for particulate measurements in indoor, outdoor, and personal environments. Environ. Sci. Technol. 36 (13):2977–86. doi:https://doi.org/10.1021/es0112644.
- Macias, E. S., and R. B. Husar. 1976. Atmospheric particulate mass measurement with beta attenuation mass monitor. Environ. Sci. Technol. 10 (9):904–07. doi:https://doi.org/10.1021/es60120a015.
- Marple, V. A., and K. Willeke. 1976. Impactor design. Atmos. Environ. (1967). 10 (10):891–96. doi:https://doi.org/10.1016/0004-6981(76)90144-X.
- McFarland, A. R., and C. A. Ortiz. 1982. A 10 μm cutpoint ambient aerosol sampling inlet. Atmos. Environ. (1967). 16 (12):2959–65. doi:https://doi.org/10.1016/0004-6981(82)90047-6.
- McFarland, A. R., and C. A. Ortiz. 1984. Characterization of Sierra-Andersen model 246b. Report No. 4716/02/02/84/ARM.
- Murari, V., M. Kumar, S. C. B. Alaa Mhawish, and T. Banerjee. 2017. Airborne particulate in Varanasi over middle Indo-Gangetic Plain: Variation in particulate types and meteorological influences. Environ. Monit. Assess. 189 (4):157. doi:https://doi.org/10.1007/s10661-017-5859-9.
- NEERI 1992, Annual report CSIR-National Environmental Engineering Research Institute, Nagpur, India
- Niemeyer, R. G., F. N. Case, and N. H. Cutshall. 1978. Evaluation of polonium-210 static eliminators. No. NUREG/CP–0001.
- Noble, C. A., R. W. Vanderpool, T. M. Peters, F. F. McElroy, D. B. Gemmill, and R. W. Wiener. 2001. Federal reference and equivalent methods for measuring fine particulate matter. Aerosol Sci. Technol. 34 (5):457–64. doi:https://doi.org/10.1080/02786820121582.
- Patashnick, H., and E. G. Rupprecht. 1991. Continuous PM10 measurements using the tapered element oscillating microbalance. J Air Waste Manag. Assoc. 41 (8):1079–83. doi:https://doi.org/10.1080/10473289.1991.10466903.
- Patel, P., S. G. Aggarwal, C.-J. Tsai, and T. Okuda. 2021. Theoretical and field evaluation of a PM2.5 high-volume impactor inlet design. Atmos. Environ. 244:117811. 2021. doi:https://doi.org/10.1016/j.atmosenv.2020.117811.
- Peters, T. M., G. A. Norris, R. W. Vanderpool, D. B. Gemmill, R. W. Wiener, R. W. Murdoch, F. F. McElroy, and M. Pitchford. 2001b. Field performance of PM2.5 federal reference method samplers. Aerosol Sci. Technol. 34 (5):433–43. doi:https://doi.org/10.1080/02786820116873.
- Peters, T. M., D. Ott, and P. T. O’shaughnessy. 2006. Comparison of the Grimm 1.108 and 1.109 portable aerosol spectrometer to the TSI 3321 aerodynamic particle sizer for dry particles. Ann. Occup. Hyg. 50 (8):843–50. doi:https://doi.org/10.1093/annhyg/mel067.
- Peters, T. M., R. W. Vanderpool, and R. W. Wiener. 2001a. Design and calibration of the EPA PM2.5 well impactor ninety-six (WINS). Aerosol Sci. Technol. 34 (5):389–97. doi:https://doi.org/10.1080/02786820120352.
- Pöschl, U. 2005. Atmospheric aerosols: Composition, transformation, climate and health effects. Angew. Chem. Int. Ed. 44 (46):7520–40. doi:https://doi.org/10.1002/anie.200501122.
- Purdue, L. J., C. E. Rodes, K. A. Rehme, D. M. Holland, and A. E. Bond. 1986. Intercomparison of high-volume PM10 samplers at a site with high particulate concentrations. J Air Pollut. Control Assoc. 36 (8):917–20. doi:https://doi.org/10.1080/00022470.1986.10466131.
- Rajoy, R. R. S., J. W. C. Dias, E. C. P. Rego, and A. D. Pereira Netto. 2015. Evaluation of sampling inhalable PM10 particulate matter (≤ 10 μm) using co-located high volume samplers. In Journal of Physics: Conference Series, Ouro Preto, Brazil, Vol. 575, No. 1, 012034, IOP Publishing.
- Ranade, M. B., M. C. Woods, F. L. Chen, L. J. Purdue, and K. A. Rehme. 1990. Wind tunnel evaluation of PM10 samplers. Aerosol Sci Technol. 13 (1):54–71. doi:https://doi.org/10.1080/02786829008959424.
- Rodes, C. E., D. M. Holland, L. J. Purdue, and K. A. Rehme. 1985. A field comparison of PM10 inlets at four locations. J Air Pollut. Control Assoc. 35 (4):345–54. doi:https://doi.org/10.1080/00022470.1985.10465915.
- Rosenberg, P. D., A. R. Dean, P. I. Williams, J. R. Dorsey, A. Minikin, M. A. Pickering, and A. Petzold. 2012. Particle sizing calibration with refractive index correction for light scattering optical particle counters and impacts upon PCASP and CDP data collected during the Fennec campaign. Atmos. Meas. Tech. 5 (5):1147–63. doi:https://doi.org/10.5194/amt-5-1147-2012.
- Sánchez-Soberón, F., J. Rovira, M. Mari, J. Sierra, M. Nadal, J. L. Domingo, and M. Schuhmacher. 2015. Main components and human health risks assessment of PM10, PM2.5, and PM1 in two areas influenced by cement plants. Atmos. Environ. 120:109–16. doi:https://doi.org/10.1016/j.atmosenv.2015.08.020.
- Seinfeld, J. H., and S. N. Pandis. 2016. Atmospheric chemistry and physics: From air pollution to climate change. New York: John Wiley & Sons.
- Sen, A., A. S. Abdelmaksoud, Y. Nazeer Ahammed, T. Banerjee, A. C. Mudasir Ahmad Bhat, A. K. Choudhuri, T. Das, A. Dhir, P. Prasad Dhyani, R. Gadi, et al. 2017. Variations in particulate matter over Indo-Gangetic Plains and Indo-Himalayan Range during four field campaigns in winter monsoon and summer monsoon: Role of pollution pathways. Atmos. Environ. 154:200–24.
- Shukla, K., and G. A. Shankar. 2021. Performance check of Beta-gauge method under high PM2.5 mass loading and varying metrological conditions in an urban atmosphere. Atmos. Pollut. Res. 12 (11):101215. doi:https://doi.org/10.1016/j.apr.2021.101215.
- Siddiqi, T. A., and Z. Chong-Xian. 1984. Ambient air quality standards in China. Environ. Manage. 8:473–79. doi:https://doi.org/10.1007/BF01871572.
- Soderholm, S. C. 1989. Proposed international conventions for particle size-selective sampling. Ann. Occup. Hyg. 33 (3):301–20. doi:https://doi.org/10.1093/annhyg/33.3.301.
- Stadlober, E., S. Hörmann, and B. Pfeiler. 2008. Quality and performance of a PM10 daily forecasting model. Atmos. Environ. 42 (6):1098–109. doi:https://doi.org/10.1016/j.atmosenv.2007.10.073.
- Su, Y., U. Sofowote, J. Debosz, L. White, and A. Munoz. 2018. Multi-year continuous PM2.5 measurements with the Federal Equivalent Method SHARP 5030 and comparisons to filter-based and TEOM measurements in Ontario, Canada. Atmosphere 9 (5):191. doi:https://doi.org/10.3390/atmos9050191.
- Tasić, V., M. Jovašević-Stojanović, S. Vardoulakis, N. Milošević, R. Kovačević, and J. Petrović. 2012. Comparative assessment of a real-time particle monitor against the reference gravimetric method for PM10 and PM2.5 in indoor air. Atmos. Environ. 54:358–64. doi:https://doi.org/10.1016/j.atmosenv.2012.02.030.
- Tolocka, M. P., T. M. Peters, R. W. Vanderpool, F.-L. Chen, and R. W. Wiener. 2001. On the modification of the low flow-rate PM10 dichotomous sampler inlet. Aerosol Sci. Technol. 34 (5):407–15. doi:https://doi.org/10.1080/02786820119350.
- Tsai, C.-J., C.-T. Chang, B.-H. Shih, S. G. Aggarwal, L. Shou-Nan, H. Min Chein, and T.-S. Shih. 2002. The effect of environmental conditions and electrical charge on the weighing accuracy of different filter materials. Sci. Total Environ. 293 (1–3):201–06. doi:https://doi.org/10.1016/S0048-9697(02)00015-3.
- Union, P. 2008. Directive 2008/50/EC of the European Parliament and of the Council of 21 May 2008 on ambient air quality and cleaner air for Europe. Off. J. of Eur. Union. L152:1–44.
- Vanderpool, R. W., Byrd, L. A., Wiener, R. W., Hunike, E. T., Labickas, M., Leston, A. R., McElroy, F. F., Murdoch, R. W.,Natarajan, S., Noble, C. A., Peters, T. M. 2007. Laboratory and field evaluation of crystallized DOW 704 oil on the performance of the well impactor ninety-six fine particulate matter fractionator. J. Air Waste Manage. Assoc. 57 (1):14–30. doi:https://doi.org/10.1080/10473289.2007.10465299.
- Vanderpool, R. W., J. D. Krug, S. Kaushik, J. Gilberry, A. Dart, and C. L. Witherspoon. 2018. Size-selective sampling performance of six low-volume “total” suspended particulate (TSP) inlets. Aerosol Sci Technol. 52 (1):98–113. doi:https://doi.org/10.1080/02786826.2017.1386766.
- Vanderpool, R. W., T. M. Peters, S. Natarajan, D. B. Gemmill, and R. W. Wiener. 2001a. Evaluation of the loading characteristics of the EPA WINS PM2.5 separator. Aerosol Sci. Technol. 34 (5):444–56. doi:https://doi.org/10.1080/02786820117739.
- Vanderpool, R. W., T. M. Peters, S. Natarajan, M. P. Tolocka, D. B. Gemmill, and R. W. Wiener. 2001b. Sensitivity analysis of the USEPA WINS PM2.5 separator. Aerosol Sci. Technol. 34 (5):465–76. doi:https://doi.org/10.1080/02786820120868.
- Waldén, J., T. Waldén, S. Laurila, and H. Hakola. 2017. Demonstration of the equivalence of PM2.5 and PM10 measurement methods in Kuopio 2014-2015. Finnish Meteorological Institute Reports 2017(1): 1–134.
- Wang, C., Y. Tu, Z. Yu, and R. Lu. 2015. PM2.5 and cardiovascular diseases in the elderly: An overview. Int. J. Environ. Res. Public Health. 12 (7):8187–97. doi:https://doi.org/10.3390/ijerph120708187.
- Watson, J. G., R. J. Tropp, S. D. Kohl, X. Wang, and J. C. Chow. 2017. Filter processing and gravimetric analysis for suspended particulate matter samples. Aerosol Sci. Eng. 1 (2):93–105. doi:https://doi.org/10.1007/s41810-017-0010-4.
- Wedding, J. B., A. R. McFarland, and J. E. Cermak. 1977. Large Particle Collection Characteristics of Ambient Aerosol Samplers. Environ. Sci. Technol. 11 (4):387–90. doi:https://doi.org/10.1021/es60127a005.
- Wedding, J. B., M. A. Weigand, Y. J. Kim, D. L. Swift, and J. P. Lodge Jr. 1987. A critical flow device for accurate PM10 sampling and correct indication of PM10 dosage to the thoracic region of the respiratory tract. J. Air Waste Manage. Assoc. 37 (3):254–58.
- Williams, R., J. Suggs, C. Rodes, P. Lawless, R. Zweidinger, R. Kwok, J. Creason, and L. Sheldon. 2000. Comparison of PM2.5 and PM10 monitors. J. Expo. Sci. Environ. Epidemiol. 10 (5):497–505.
- Witz, S. 1985. Effect of environmental factors on filter alkalinity and artifact formation. Environ. Sci. Technol. 19 (9):831–35. doi:https://doi.org/10.1021/es00139a011.
- Witz, S., R. W. Eden, M. W. Wadley, C. Dunwoody, R. P. Papa, and K. J. Torre. 1990. Rapid loss of particulate nitrate, chloride and ammonium on quartz fiber filters during storage. J. Air Waste Manage. Assoc. 40 (1):53–61. doi:https://doi.org/10.1080/10473289.1990.10466666.
- Yanosky, J. D., P. L. Williams, and D. L. MacIntosh. 2002. A comparison of two direct-reading aerosol monitors with the federal reference method for PM2.5 in indoor air. Atmos. Environ. 36 (1):107–13. doi:https://doi.org/10.1016/S1352-2310(01)00422-8.
- Young, L.-H., Chiao-Hsin, L., Lin, M.-Y., Hwang, B.-F., Hsu, H.-T., Chen, Y.-C., Jung, C.-R., Chen, K.-C., Cheng, D.-H., Wang, V.-S., Chiang, H.-C., Tsai, P.-J. 2016. Field performance of a semi-continuous monitor for ambient PM2.5 water-soluble inorganic ions and gases at a suburban site. Atmos. Environ. 144:376–88. doi:https://doi.org/10.1016/j.atmosenv.2016.08.062.
- Zhang, J., J. P. Marto, and J. J. Schwab. 2018. Exploring the applicability and limitations of selected optical scattering instruments for PM mass measurement. Atmos. Meas. Tech. 11 (5):2995–3005. doi:https://doi.org/10.5194/amt-11-2995-2018.
- Zhao, B., S. Yaxin, H. Shushen, M. Zhong, and G. Cui. 2016. Evolution and comparative assessment of ambient air quality standards in China. J. Integr. Environ. Sci. 13 (2–4):85–102.
- Zheng, M., L. G. Salmon, J. J. Schauer, L. Zeng, C. S. Kiang, Y. Zhang, and G. R. Cass. 2005. Seasonal trends in PM2.5 source contributions in Beijing, China. Atmos. Environ. 39 (22):3967–76. doi:https://doi.org/10.1016/j.atmosenv.2005.03.036.