
ABSTRACT
Dinosaur National Monument (DINO) is located near the northeastern edge of the Uinta Basin and often experiences elevated levels of wintertime ground-level ozone. Previous studies have shown that high ozone mixing ratios in the Uinta Basin are driven by elevated levels of volatile organic compounds (VOCs) and nitrogen oxides (NOx) from regional oil and gas development coupled with temperature inversions and enhanced photochemistry from persistent snow cover. Here, we show that persistent snow cover and temperature inversions, along with abundant ammonia, also lead to wintertime haze in this region. A study was conducted at DINO from November 2018 through May 2020 where ozone, speciated fine and coarse aerosols, inorganic gases, and VOCs were measured. Three National Ambient Air Quality Standards (NAAQS) ozone exceedances were observed in the first winter, and no exceedances were observed in the second winter. In contrast, elevated levels of particulate matter were observed both winters, with 24-h averaged particle light extinction exceeding 100 Mm−1. These haze events were dominated by ammonium nitrate, and particulate organics were highly correlated with ammonium nitrate. Ammonium nitrate formation was limited by nitric acid in winter. As such, reductions in regional NOx emissions should reduce haze levels and improve visibility at DINO in winter. Long-term measurements of particulate matter from nearby Vernal, Utah, suggest that visibility impairment is a persistent issue in the Uinta Basin in winter. From April through October 2019, relatively clean conditions occurred, with average particle extinction of ~10 Mm−1. During this period, ammonium nitrate concentrations were lower by more than an order of magnitude, and contributions from coarse mass and soil to haze levels increased. VOC markers indicated that the high levels of observed pollutants in winter were likely from local sources related to oil and gas extraction activities.
Implications: Elevated ground-level ozone and haze levels were observed at Dinosaur National Monument in winter. Haze episodes were dominated by ammonium nitrate, with 24-h averaged particle light extinction exceeding 100 Mm−1, reducing visual range near the surface to ~35 km. Despite elevated ammonium nitrate concentrations, additional gas-phase ammonia was available, such that any increase in NOx emissions in the region is likely to lead to even greater haze levels.
Introduction
The Uinta Basin in rural northeastern Utah has extensive oil and gas development and is surrounded by higher elevation terrain. With a population of just under 56,000, Uintah and nearby Duchesne counties produced more than 30 million barrels of oil and over 200 billion cubic feet of natural gas in 2019 (https://oilgas.ogm.utah.gov/oilgasweb/index.xhtml). In winter, cold air near the surface and warm air aloft can result in a stable temperature stratification, or temperature inversion, preventing air within the basin from mixing with the atmosphere aloft (Lareau et al. Citation2013). These events are associated with synoptic-scale high pressure systems with light winds and shallow boundary layers (Ahmadov et al. Citation2015) and allow for the buildup of pollutants from local sources (Lyman and Tran Citation2015). The presence of snow cover influences the characteristics of these cold air pools (CAPs) (Neemann et al. Citation2015) and increases the actinic flux near the surface. Elevated volatile organic compound (VOC) concentrations in a shallow boundary layer and increased photolysis rates due to snow cover lead to rapid winter ozone production (Edwards et al. Citation2014). Enhanced ozone production, coupled with a reduction in ozone deposition due to snow cover (Ahmadov et al. Citation2015; Matichuk et al. Citation2017), results in elevated ozone concentrations (Lyman and Tran Citation2015; Oltmans et al. Citation2014) during winters with persistent snow cover. Elevated ground-level ozone concentrations can impact human health (Cohen et al. Citation2017; Turner et al. Citation2016) and damage vegetation (Kohut Citation2007). Ozone mixing ratios have decreased throughout the Uinta Basin since 2010, and National Ambient Air Quality Standards (NAAQS) exceedances have been trending downward (Mansfield and Lyman Citation2021), but ozone concentrations that exceed 70 parts per billion (ppbv) continue to be observed in winter in the Uinta Basin under certain meteorological conditions (Mansfield and Lyman Citation2021).
Atmospheric stability also impacts particulate matter (PM) concentrations (Whiteman et al. Citation2014), with wintertime PM levels correlated with valley heat deficits (Green et al. Citation2015; Silcox et al. Citation2012; Whiteman et al. Citation2014). Elevated levels of PM have been documented in the western United States (Chen et al. Citation2012; Green et al. Citation2015) and in other locations (Kim et al. Citation2014; Stanier et al. Citation2012; Tian et al. Citation2019; Vecchi et al. Citation2018). PM2.5 (particulate matter with diameters <2.5 μm) concentrations are generally higher during persistent CAPs (PCAPs) in western valleys (Chen et al. Citation2012; Franchin et al. Citation2018; Green et al. Citation2015; Silcox et al. Citation2012; Whiteman et al. Citation2014), where CAP strength and duration affect the concentration of PM (Lareau et al. Citation2013). The primary component of wintertime PM is often ammonium nitrate (NH4NO3) (Franchin et al. Citation2018; Green et al. Citation2015; Kuprov et al. Citation2014; Silva et al. Citation2007).
Much of the work on PCAPs and wintertime haze has focused on the Utah, Salt Lake and Cache Valleys in northern Utah, where aerosol concentrations frequently exceed the PM2.5 NAAQS. In contrast, the Uinta Basin does not have any large urban sources, and there are lower concentrations of nitrogen oxides (NOx) but larger concentrations of VOCs from regional oil and gas development. Photochemical mechanisms that partition odd oxygen and lead to ozone and nitrate formation have different outcomes in the Uinta Basin compared to the northern Utah valleys, with the low NOx to VOC ratio in the Uinta Basin yielding higher ozone and the high NOx to VOC ratio in the Salt Lake Valley leading to high nitric acid (HNO3) (Womack et al. Citation2019) and ultimately high nitrate. As such, most work done in the Uinta Basin has focused on wintertime ozone, while wintertime haze typically has been studied in more urban areas. Nevertheless, enhanced levels of PM can occur and impact visibility in the Uinta Basin at levels well below the NAAQS. Visibility impairment is of particular interest to the National Park Service (NPS) in the remote areas where many national park units are found. This impairment has been linked to oil and gas extraction in some areas. For example, Evanoski-Cole et al. (Citation2017) observed wintertime haze episodes at Theodore Roosevelt National Park (THRO) near the Bakken oil and gas region that were dominated by NH4NO3, while Gebhart et al. (Citation2018) showed increases in elemental carbon, soil, and coarse mass at THRO. Elevated concentrations of wintertime NH4NO3 have also been reported in the vicinity of the Jonah and the Pinedale Anticline gas fields in western Wyoming (Li et al. Citation2014) and Carlsbad Caverns National Park near the Permian Basin (http://views.cira.colostate.edu/fed/).
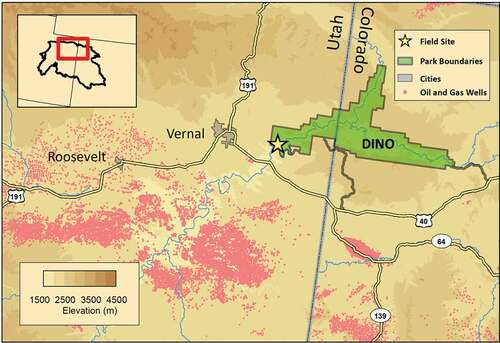
Dinosaur National Monument (DINO) is located near the northeastern edge of the Uinta Basin (), extending between Colorado and Utah. Although DINO includes terrain up to 2745 m, the DINO air quality monitoring site is located at 1462 m, at an elevation similar to much of the Uinta Basin. High concentrations of ground-level ozone have been measured at DINO since 2005, consistent with wintertime ozone events observed throughout the basin (Lyman and Tran Citation2015). However, until recently, only limited aerosol monitoring data have been available at DINO (Benedict et al. Citation2013b) and haze levels have not been quantified. Here, data from long-term monitoring at DINO are reported, as well as additional measurements conducted during a special study over a period encompassing two winters, to better characterize wintertime haze at DINO.
Figure 1. Map showing the study region, including the monitoring site, nearby population centers, oil and gas wells, and major roads. DINO is located near the edge of oil and gas activities. In the inset, an outline of the larger Uinta-Piceance boundary is shown in black.
Methods
All measurements were collocated with the NPS Gaseous Pollutant Monitoring Program (GPMP; https://ard-request.air-resource.com/Project/default.aspx) long-term monitoring site (40.4372° N, −109.3048° W; 1462 m asl) on the west side of DINO (). GPMP has been operating at DINO since 2005. An Interagency Monitoring of Protected Visual Environments (IMPROVE) monitoring site and NPS air quality webcam (https://www.nps.gov/subjects/air/webcams.htm) were installed in November 2018. VOC canister collection and denuder/filter-pack sampling were added from November 2019 to May 2020.
Ozone and meteorology
Ground-level ozone is measured at DINO as part of the NPS GPMP. Ozone measurements at DINO were originally seasonal, but year-round measurements began in 2010. Sampling methods for gaseous and meteorological monitoring are based on the 40 CFR Part 58 (https://ecfr.federalregister.gov/current/title-40/chapter-I/subchapter-C/part-58) requirements, and O3 was measured by UV absorption using a Thermo 49i O3 analyzer coupled with a Thermo 49i O3 reference station for nightly zero, precision, and span checks. One-minute O3 data were recorded, and hourly averages were generated from the 1-min data. The suite of meteorological measurements includes wind speed, wind direction, temperature, solar radiation, and precipitation.
Improve
The IMPROVE particle monitor consists of four sampling modules that collect 24-h samples on filters every third day. Three modules (A, B, and C) collect only fine particles (PM2.5), while the fourth (module D) collects both fine and coarse particles (PM10; particulate matter with diameters <10 μm). Module A is analyzed for PM2.5 gravimetric mass, elemental concentrations (Hyslop, Trzepla, and White Citation2015), and light absorption (White et al. Citation2016). Module B is analyzed for sulfate (SO42-), nitrate (NO3−), chloride (Cl−), and nitrite (NO2−). For this study, several cations were also measured: sodium (Na+), ammonium (NH4+), potassium (K+), magnesium (Mg2+), and calcium (Ca2+). Module C is analyzed for organic and elemental carbon (Chow et al. Citation2015, Citation2007). Module D is fitted with a PM10 inlet to determine PM10 gravimetric mass; coarse mass is determined as the difference between PM10 and PM2.5 gravimetric mass. PM10 elemental composition was also determined for this study from the D module, and an additional module was added in November 2019 to determine PM10 ion concentrations. Reconstructed fine mass (Malm et al. Citation1994) and light extinction (Pitchford et al. Citation2007) are determined from the aerosol measurements, although both have been shown to have biases (Hand et al. Citation2019; Prenni et al. Citation2019). The IMPROVE data used in this analysis are available on the Federal Land Manager Environmental Database (FED; http://views.cira.colostate.edu/fed/; data downloaded 26 April 2021).
Nephelometer
Light scattering was measured using an Optec NGN-2 integrating nephelometer. The Optec NGN-2 nephelometer uses an open-air design to measure total ambient light scattering coefficients for all particle sizes at an effective wavelength of 550 nm (Molenar and Persha Citation2008). Frequent frost buildup inside the instrument during winter, as determined from measurements of zero air every six hours, resulted in large data gaps throughout the study. As such, the complete nephelometer dataset is not reported; measurements are referenced in the paper on non-sampling days for IMPROVE when no frost was present in the nephelometer.
Denuder/filter-pack sampling
A University Research Glassware (URG) Corporation annular denuder/filter-pack sampler was used to capture weekly inorganic gas and PM2.5 aerosol concentrations (Benedict et al. Citation2013a; Lee et al. Citation2008; Yu et al. Citation2006). A sodium-bicarbonate-coated glass annular denuder captures HNO3 and sulfur dioxide (SO2), and a phosphorous-acid-coated denuder captures ammonia (NH3). A filter pack with a 37-mm diameter nylon filter (Measurement Technology Laboratories, LLC) captures PM2.5. Finally, an additional phosphorous-acid-coated denuder placed after the filter captures any NH3 volatilized from NH4NO3 captured on the initial filter. HNO3 from collected NH4NO3 is retained on the nylon filter (Yu et al. Citation2005). Denuder and filter samples were extracted in 18.2 MΩ deionized water and analyzed using ion chromatography to quantify gaseous NH3, HNO3, and SO2 and PM2.5 Na+, NH4+, K+, Mg2+, Ca2+, Cl−, NO2−, NO3−, and SO42-. Daily calibrations using anion and cation standards were performed. Sample blanks, replicates, and independent quality control standards prepared from National Institute of Standards and Technology (NIST) traceable anion and cation standards were analyzed periodically. URG measurement precision is 5–9% relative standard deviation (RSD) for PM2.5 NO3−, SO42-, and NH4+ and HNO3, SO2, and NH3. The precision for the remaining species is 8–22% RSD (Lee et al. Citation2008).
VOCs
Whole air samples were collected on a one-in-three–day schedule, corresponding to IMPROVE sampling periods. Stainless steel Silonite®-coated 1.4-L canisters (Entech Instruments, Simi Valley, CA, USA) were cleaned by repeated filling and evacuating of ultra-high-purity nitrogen gas while heating under vacuum. Timers coupled with a flow controller were used to automatically collect samples from midnight to midnight (local time) for a 24-h integrated sample. Early in the study, one of the automated sampling inlets (of three sampling systems) was not configured properly, resulting in missing data.
A five-channel, three-GC (gas chromatograph) analytical system, which employed three flame ionization detectors, one electron capture detector, and one mass spectrometer, was used to analyze sampled canisters. A complete list of the 72 VOCs measured is included in the Supplemental Information (Table S1). The analytical system and sample analysis methodology used for this study are similar to those used in previous studies (Benedict et al. Citation2020, Citation2019; Russo et al. Citation2010; Zhou et al. Citation2010). Multiple standards were used during sample analysis (analyzed every 10 samples) to track system drift over time. The measurement precision, represented by the RSD of the peak areas for each compound in the whole air standards, was 1–8% for the hydrocarbons, 3–10% for halocarbons, and 3–5% for the alkyl nitrates. System blanks were measured every day prior to analysis and were analyzed in the same manner as other sampled canisters.
Mixing depths
Mixing depth is the height above the surface below which a pollutant can be easily dispersed. It is not measured, but estimated, usually based on vertical temperature profiles. Mixing depths were extracted from the planetary boundary layer height (PBLH) variable in the North American Mesoscale Model with a grid resolution of 12 km (NAM-12; ftp://arlftp.arlhq.noaa.gov/pub/archives/nam12) (Janjic Citation2003). Since there is no measurement of mixing depth, its accuracy is undefined. However, the value of the calculation as an indication of ventilation or stagnation has been previously established (Day et al. Citation2012).
Results and discussion
Ozone and VOCs
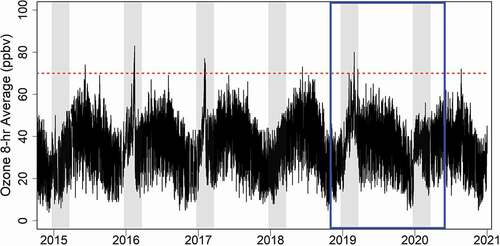
One purpose of the NPS GPMP is to monitor for ozone levels that can lead to exceedances of the Environmental Protection Agency’s (EPA) NAAQS, which occur when the 3-yr average of the fourth highest annual 8-h ozone average exceeds 70 ppbv. Despite being in a rural location, DINO has experienced multiple periods since 2015 when the 8-h maximum average ozone value exceeded 70 ppbv (). Even higher ozone mixing ratios were observed from 2010 to 2015 (not shown), but ozone mixing ratios have been trending downward throughout the Uinta Basin (Mansfield and Lyman Citation2021), likely due to weakening global demand for oil and natural gas and more stringent pollution regulations and controls (Mansfield and Lyman Citation2021). In contrast to much of the nation where ozone is a summertime problem, ozone exceedances in this region are most likely to occur in winter, which has been shown to be tied to the presence of inversions and snow cover (Lyman and Tran Citation2015; Oltmans et al. Citation2014). In addition to enhanced actinic flux, snow cover reduces surface heating, resulting in lower mixing heights, and reduces ozone deposition, both of which lead to higher ambient concentrations (Matichuk et al. Citation2017). Wintertime ozone production in oil and gas basins occurs at lower nitrogen oxide (NOx = NO + NO2) and higher VOC concentrations than summertime urban ozone (Edwards et al. Citation2014). Previous studies have shown high VOC concentrations in the Uinta Basin (Helmig et al. Citation2014), while NOx emissions have declined in the past decade (Mansfield and Lyman Citation2021) and are small relative to other oil and gas basins such as the Permian, Bakken, and Eagle Ford (Dix et al. Citation2020) due to less drilling, production, and gas flaring in the Uinta Basin (Dix et al. Citation2020) relative to the other basins. NOx was not measured at DINO during this study; however, median NOx concentrations at nearby Vernal for the two winter periods were 7 ppbv, significantly lower than for an urban area such as Salt Lake City, which were three to four times higher (https://www.epa.gov/outdoor-air-quality-data) during this same time period.
Figure 2. Timeline of 8-h average ozone mixing ratios from DINO from 2015 to 2020. Winter periods (21 December to 21 March) are shaded in the figure, the study period is outlined in blue, and the EPA’s NAAQS for ozone (70 ppbv) is shown as a dotted red line.
A timeline of total VOCs measured during the study is shown in , and summary statistics for all measured VOCs are given in Table S1. Light alkanes, markers for oil and gas emissions (Gilman et al. Citation2013; Petron et al. Citation2012; Swarthout et al. Citation2013, Citation2015), were prevalent throughout the study, particularly in the colder winter months (Table S1), and mixing ratios of the C2-C6 alkanes were all highly correlated with propane (Figure S1), suggesting a common source. Moreover, the distributions at DINO were similar in magnitude to other wintertime VOC measurements (Figure S1) from Erie, Colorado (Swarthout et al. Citation2013) within the Denver-Julesburg Basin (NACHTT) and at THRO (Prenni et al. Citation2016) near the Bakken region of North Dakota (BAQS) and similar to summertime measurements at Carlsbad Caverns National Park near the Permian Basin (Benedict et al. Citation2020).
Figure 3. (A) Total VOCs (blue) measured during the intensive study period from 20 November 2019 to 06 May 2020. Note that 1 in 3 VOC samples were missing for much of the study period due to an improperly configured valve. Also shown is PM2.5 mass (red) at the DINO site. (B) Daily averaged snow depth (cm) measured in Vernal, UT, wind speed (m/s) at the DINO sampling site and mixing depth (m) from NAM12.
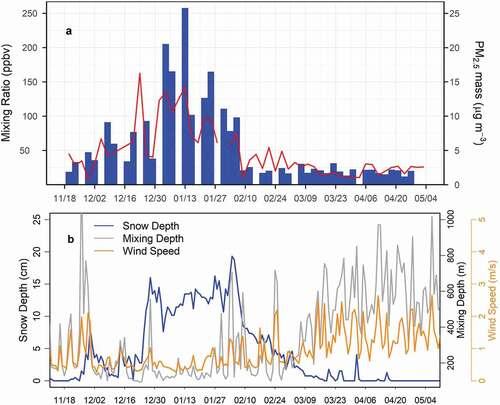
Mixing ratios of nearly all VOC classes were elevated from 8 December 2019 through 6 February 2020, after which time total VOC mixing ratios decreased; PM2.5 mass concentrations also were elevated during this time (). During the period of elevated concentrations, air masses were more likely to be impacted from sources within the Uinta Basin, whereas air masses were more likely to be impacted by emissions outside of the basin after 6 February 2020 (Figure S2). Mean mixing ratios for elevated and non-elevated periods are given in Table S1. The decrease in total mixing ratios corresponds to a warming period (not shown), with decreased snow cover, increased wind speeds, and greater mixing depths ().
Despite snow cover, high VOC concentrations and stagnant conditions in December and January during the second winter, no wintertime ozone exceedances were observed. This is likely due to the lower solar flux during these two winter months. Ozone measurements from the previous five years () show very few ozone exceedances in December and January at DINO, with less than 4% of the wintertime exceedances occurring during these months.
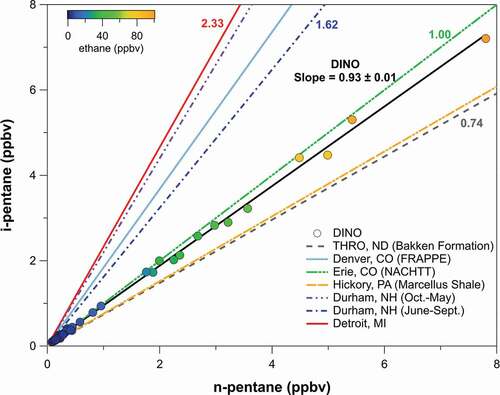
Ratios of alkanes can be used as markers for emission sources. The i-pentane to n-pentane ratio is a robust tracer for assessing impacts from oil and gas emissions (Abeleira et al. Citation2017; Benedict et al. Citation2020, Citation2019; Gilman et al. Citation2013; Swarthout et al. Citation2013, Citation2015). Historically, the i-pentane to n-pentane ratio has been driven by transportation and combustion processes dominated by mobile sources, with reported emission ratios of 2.2–3.8 for vehicle exhaust and tunnel studies, 1.5–3 for liquid gasoline, and 1.8–4.6 for fuel evaporation (Conner, Lonneman, and Seila Citation1995; Harley et al. Citation2001; Jobson et al. Citation2004; Lough et al. Citation2005; McGaughey et al. Citation2004; Russo et al. Citation2010; Velasco et al. Citation2007; Watson, Chow, and Fujita Citation2001). However, the pentane ratio has been declining in areas influenced by oil and natural gas development and in urban areas (Rossabi and Helmig Citation2018) due in part to the increased influence of emissions from oil and natural gas development which have lower i-pentane to n-pentane ratios (≤1). Based on the average mole fractions presented in Helmig et al. (Citation2014) for the Uinta Basin, the i- to n-pentane ratio was 1.1 in winter 2012 and 2013. Throughout the measurement period at DINO in this study, the slope of i-pentane to n-pentane was 0.93 (), consistent with a strong influence from oil and gas emissions sources (Gilman et al. Citation2013; Swarthout et al. Citation2015) and slightly lower than measured by Helmig et al. (Citation2014). This ratio did not change for the more polluted period (8 December 2019 to 6 February 2020) compared to the rest of the measurements, suggesting oil and gas influence at DINO throughout the study.
Figure 4. I-pentane versus n-pentane, colored by ethane mixing ratios. Also shown are i- to n-pentane ratios from a number of other areas.
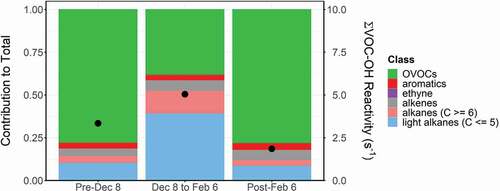
VOC-OH reactivity can be used to determine the reactive species potentially responsible for the formation of ozone (Gilman et al. Citation2013) and daytime conversion of NOx. While VOC-OH reactivity does not account for subsequent reactions following the initial hydroxyl (OH) attack, this metric provides some insight into the VOC classes that play important roles in atmospheric chemistry at DINO in winter. The VOC-OH reactivity is the inverse lifetime of OH due to reaction with a specific VOC (Stroud et al. Citation2008) and is calculated as the product of the rate constant of the VOC with OH (Atkinson Citation1986; Atkinson and Arey Citation2003) and the VOC’s mixing ratio (Abeleira et al. Citation2017). The species that contribute the most to the VOC-OH reactivity often differ from those with the highest mixing ratios because of differences in their rates of reaction with OH. In , VOC-OH reactivity is shown for three time periods: (1) before 8 December 2019; (2) 8 December 2019 to 6 February 2020; and (3) after 6 February 2020. suggests that oxygenated volatile organic compounds (OVOCs) play a critical role in atmospheric chemistry throughout the winter. The importance of OVOCs is apparent despite the fact that methanol, widely used as an anti-freeze in oil and gas extraction (Koh et al. Citation2002), was not quantified in this study and is not included in the VOC-OH reactivity calculations. From 8 December 2019 to 6 February 2020, during the period of elevated pollutants, alkanes are the dominant contributor to VOC-OH reactivity, and total reactivity increases. The elevated alkane reactivity persists despite their relatively slow reaction with OH, resulting from their very high abundances (ranging up to 1–2 orders of magnitude above regional background levels (Helmig et al. Citation2014)) during this time period relative to the OVOCs (Table S1).
Figure 5. Average contribution of key VOC classes for three sampling periods. The fractional VOC contribution is on the left axis, while the black points represent the average combined VOC-OH reactivity of the classes listed on the right axis.
VOC measurements can be used to estimate the age of the air masses influencing the site using a photochemical clock (Bertman et al. Citation1995; Russo et al. Citation2010; Simpson et al. Citation2003). Throughout the VOC measurement period, air masses are estimated to have undergone photochemical processing from less than one day to almost five days (Figure S3). In general, higher methane concentrations, higher NH4NO3 concentrations and higher PM2.5 mass concentrations corresponded to air masses with shorter processing times, indicating local sources. These shorter lifetimes are still sufficient for conversion of NOx to ammonium nitrate, particularly at night (Kenagy et al., Citation2018). Methane and many of the VOC classes measured showed good correlation with fine mass concentrations measured at DINO, consistent with a study in Utah’s Salt Lake Valley that determined that gases such as excess carbon dioxide and methane are reasonable indicators for PM2.5 during PCAPs (Bares et al. Citation2018).
Haze
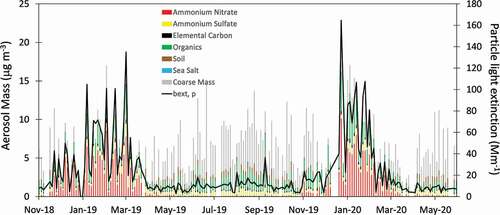
Data from the first 19 months of IMPROVE measurements at DINO are shown in . A distinct seasonal pattern is apparent, with NH4NO3 dominating aerosol mass in winter, similar to observations in other locations (Franchin et al. Citation2018; Green et al. Citation2015; Kuprov et al. Citation2014; Silva et al. Citation2007). Organics and coarse mass dominated aerosol mass the remainder of the year. Elevated levels of organics and elemental carbon (EC) were also present in winter. Source contributions cannot be quantified for organic carbon using the available dataset. However, a previous study at 12 IMPROVE sites showed that at least half of the carbon measured in winter was contemporary (Schichtel et al. Citation2008), and residential and industrial wood combustion have been shown to be significant sources of particulate matter in winter at urban and rural sites throughout the west (Chen et al. Citation2012; Kotchenruther Citation2016; Schichtel et al. Citation2017; Ward and Lange Citation2010). In this study, the absorption Ångström exponent (AAE) was determined from IMPROVE multiwavelength light attenuation measurements (Chen et al. Citation2012; Chow et al. Citation2021, Citation2018). Values of AAE were slightly greater than two throughout both winters, indicative of brown carbon and consistent with the presence of wood smoke (Chen et al. Citation2012; Chow et al. Citation2018). However, other sources likely also contribute in the Uinta Basin, such as secondary brown carbon (Laskin et al. Citation2017) and organic nitrates (Lee et al. Citation2015).
Figure 6. Timeline of IMPROVE speciated aerosol data from DINO from November 2018 to May 2020. Also shown is calculated light extinction from particles (bext, p) calculated from the IMPROVE data.
Ammonium nitrate typically forms in winter (Hand et al. Citation2012) when NOx is oxidized to HNO3, which then reacts with ambient ammonia. The EPA National Emissions Inventory (NEI) indicates that agriculture is the primary source of ammonia in Uintah and Duchesne counties (https://www.epa.gov/air-emissions-inventories/2017-national-emissions-inventory-nei-data; data downloaded 14 October 2021), and that oil and natural gas production is the primary emitter of VOCs (https://www.epa.gov/air-emissions-inventories/2017-national-emissions-inventory-nei-data; data downloaded 24 June 2021) and NOx (EPA NEI: https://www.epa.gov/air-emissions-inventories/2017-national-emissions-inventory-nei-data; data downloaded 18 May 2021). NOx emissions are dominated by diesel engines associated with drilling and fracking, lateral compressors, and artificial lifts (Gorchov Negron et al. Citation2018). Previous versions of the EPA NEI have been shown to have biases for both NOx and VOCs in the Uinta Basin; NOx emissions from oil and gas are likely overestimated and VOC emissions are likely underestimated in the NEI (Ahmadov et al. Citation2015; Francoeur et al. Citation2021; Gorchov Negron et al. Citation2018). Despite the overestimates for NOx, top-down estimates suggest that oil and gas development and the Bonanza Power Plant on the Uintah and Ouray Reservation are major sources of NOx in the region (Ahmadov et al. Citation2015); mobile sources and other fuel combustion also make up a significant fraction (EPA 2017 NEI).
NOx lifetime is controlled primarily by HNO3 production via N2O5 heterogeneous chemistry in winter (Baasandorj et al. Citation2017; Kenagy et al. Citation2018). In previous studies in the Uinta Basin, HNO3 formation through heterogeneous uptake of N2O5 contributed approximately six times more than daytime formation (Wild et al. Citation2016). Daytime versus nighttime HNO3 formation could not be assessed with the current dataset; however, the high abundances of acetone and acetaldehyde observed (Table S1) suggest appreciable OH chemistry and potentially more daytime NOx conversion than previously measured. HNO3 can then be converted to NH4NO3 if sufficient ammonia is present, with the gas–particle equilibrium also a function of temperature and relative humidity. Nocturnal heterogeneous production of HNO3 leads to aerosol nitrate formation in the upper part of the PCAPs during pollution episodes (McDuffie et al. Citation2019), which is mixed to the surface during the day (Baasandorj et al. Citation2017). High time resolution data are not available for PM at DINO, and it is not possible to determine if there is a morning peak due to mixing from aloft. However, meteorological data from DINO show diurnal wind shifts typical of mountain-valley areas (Figure S4), with winds from the southwest primarily during daylight hours in winter. Higher time resolution PM measurements are needed at DINO; however, the met data alone suggest likely diel variability in PM that was not captured in this study, driven by mixing and transport from more developed regions within the Uinta Basin.
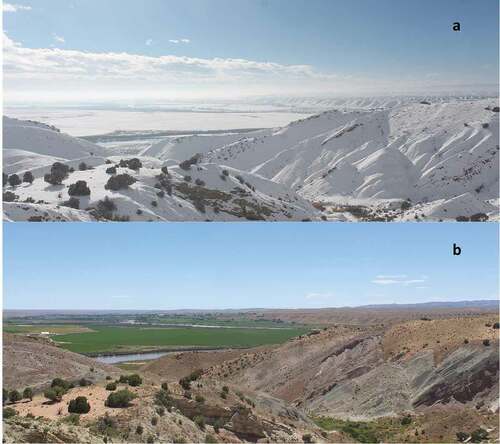
Also shown in are calculated light extinction values for the aerosol phase from the second IMPROVE equation (Pitchford et al. Citation2007). Although PM10 mass is relatively constant throughout the year, there is a large increase in light extinction in winter due to hygroscopic growth of ammonium nitrate and the larger mass scattering efficiency of NH4NO3 relative to coarse mass. Light extinction is inversely proportional to visual range, with particle light extinction of 10 Mm−1 corresponding to a visual range of nearly 200 km in summer, while particle light extinction of 100 Mm−1 yields a much lower visual range of ~35 km in winter. This large difference results in haze visible from DINO during winter. A webcam at DINO, installed at the same time as the IMPROVE monitoring site, is located less than 1 km north of the sampling site and faces southwest toward the Uinta Basin. The images in represent typical light extinction values for DINO during winter and summer. Layered haze is clearly visible in the image from winter (7 January 2019; ), obscuring some of the more-distant landscape features that are evident in the summer image (27 June 2019; ). The haze is confined to lower levels, consistent with measurements in other Utah basins that showed higher mass concentrations within the first few hundred meters of the surface (Franchin et al. Citation2018; Silcox et al. Citation2012) and previous VOC observations in the Uinta Basin that showed that the most-polluted areas in winter are found at the lowest elevations (Helmig et al. Citation2014). There was near-complete snow cover present during the wintertime haze event, coupled with low temperatures (Tavg = −6°C), a shallow mixing layer, and clear skies. Ozone concentrations did not exceed 52 ppbv. The image in does not correspond to an IMPROVE sampling day; however, hourly light scattering measurements from the collocated nephelometer reached nearly 200 Mm−1 on this day. The summertime image corresponds to low aerosol light scattering (10 Mm−1), with very little ammonium nitrate during this period and ozone mixing ratios comparable to 7 January 2019.
Figure 7. Photos from the NPS air quality webcam network taken in (A) winter (7 January) and (B) summer (27 June) 2019. Both images were taken at 13:45 MST.
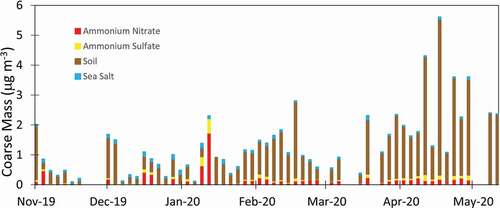
Although nitrate dominates the fine mode in winter, NH4NO3 generally does not extend into the coarse mode. Coarse mode (PM10 – PM2.5) composition for NH4NO3, ammonium sulfate ((NH4)2SO4)), soil, and sea salt is shown in . In the figure, reconstructed mass for each of the species is calculated in the same manner as for fine mass to allow for a direct comparison. However, a significant fraction of particulate nitrate may be in a form other than NH4NO3 in the coarse mode, where nitrate can be associated with sea salt or soil dust (Hrdina et al. Citation2021; Lee et al. Citation2008). Elements associated with soil dominate the coarse mode and make up the majority of the mass in spring and summer (not shown). Some nitrate is evident in the coarse mode in winter, particularly in late January when elevated nitrate was also present in the fine mode (). However, coarse mode nitrate represents a small fraction of the total nitrate and does not appear to be a major sink for HNO3, as has been proposed for the Salt Lake Valley (Hrdina et al. Citation2021).
Figure 8. Coarse mode species determined for part of the study. Coarse-mode composition was only measured for part of the study, and carbon fractions were not measured. Although classified here as ammonium nitrate, the coarse nitrate is more likely composed of nitrate associated with reacted soil dust.
In the IMPROVE network, where ammonium is typically not measured, it is assumed that the measured PM2.5 species nitrate and sulfate are in the forms of (NH4)2SO4 and NH4NO3. In this study, a suite of cations including ammonium was analyzed from IMPROVE samples. Throughout the study, the dominant cation measured was ammonium, accounting for 88% of the cations measured in moles. From the IMPROVE measurements, ammonium concentrations were consistent with sulfate being in the form of ammonium bisulfate (NH4HSO4). However, although nitrate is expected to be retained on the IMPROVE nylon filters (Yu et al. Citation2005), a fraction of the ammonium will likely be lost (Yu et al. Citation2006), leading to an underestimation of ammonium. Weekly integrated ion concentrations from the denuder/filter-pack sampling, which includes a denuder downstream of the filter to capture any ammonia lost from the filter, thus accounting for all ammonium, suggest a more fully neutralized sulfate. The denuder/filter-pack measurements indicate the loss of ammonium from the nylon IMPROVE filters. Because the denuder/filter-pack sampling uses weekly integrated values and IMPROVE is one-in-three-day sampling, these losses cannot be fully quantified.
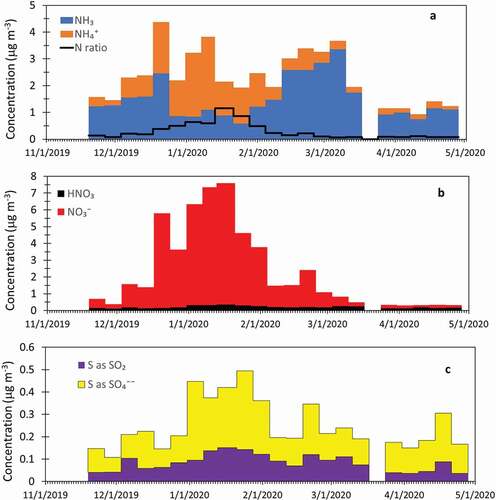
Particulate and gas-phase concentrations from the denuder/filter-pack samplers are shown in . shows gas-phase NH3 and particulate NH4+. Ammonium concentrations are similar to or greater than ammonia from mid-December through the beginning of February, consistent with elevated haze during this period. Nearly all NO3− during this period is in the form of particulate nitrate, indicating near-complete conversion of NO3− to the aerosol phase (). Although this is the maximum haze observed during the winter, ~1 μg m−3 ammonia remains. The nitrogen ratio, or the ratio of oxidized nitrogen (HNO3(g) + particulate nitrate) to reduced nitrogen (NH3(g) + particulate NH4+), can be used to determine the limiting reagent for NH4NO3 formation (McDuffie et al. Citation2016). A nitrogen ratio greater than one implies that oxidized nitrogen is in excess, while a ratio less than one suggests that NH4NO3 formation is limited by nitric acid. This nitrogen ratio is shown as the black line in . To calculate the nitrogen ratio, NH4+ associated with (NH4)2SO4 is subtracted from the reduced nitrogen total. During one week (13 January 2020 to 21 January 2020), the ratio exceeded one, indicating a limitation from reduced nitrogen. This week marked the end of a 3-week period with average temperatures falling below −10°C, the coldest period of the winter. For most of the winter, however, the nitrogen ratio was less than one, indicating that the formation of NH4NO3 in the Uinta Basin was limited by HNO3, similar to results in other Utah valleys (Franchin et al. Citation2018; Kuprov et al. Citation2014; McDuffie et al. Citation2019). Should additional HNO3 be available, additional particulate NH4NO3 could form, adding to haze levels and further impairing visibility. Similarly, reductions in NOx emissions, and thus reductions in available HNO3, would result in improvements to visibility in winter at DINO. This differs from measurements in the Bakken region of North Dakota (Evanoski-Cole et al. Citation2017) and in the Pinedale Anticline in western Wyoming (Li et al. Citation2014) in winter, which showed that NH4NO3 formation was often limited by availability of NH3. SO2 and SO42- are also shown in ; due to the large difference in their molecular weight, the amounts of S in SO2 and SO42- are plotted in the figure. As with VOCs and NO3−, the mid-December to early-February period corresponds to the highest sulfate concentrations, with the majority of the S as SO42-. As was the case for VOCs, for all condensed species the winter period had the highest ambient concentrations for the denuder/filter-pack measurements, reflecting a buildup of pollutants during periods when inversions were likely present.
Figure 9. Weekly integrated samples from the denuder/filter-pack. (A) ammonia (NH3), particulate ammonium (NH4+) and the ratio of oxidized to reduced nitrogen (N ratio); (B) nitric acid (HNO3) and particulate nitrate (NO3−); and (C) sulfur in the form of sulfur dioxide (SO2) and sulfur in the form of particulate sulfate (SO42-).
Comparison of the two winter periods
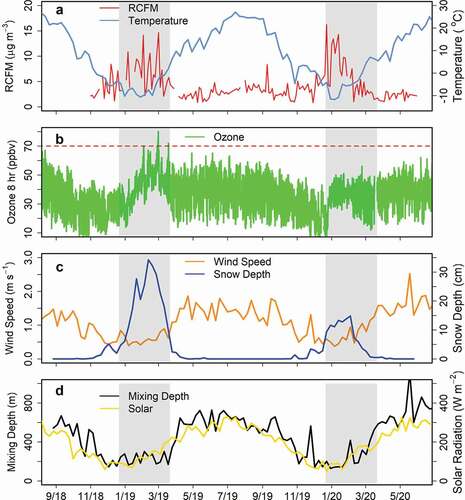
It is instructive to compare the measurements made during the two winters of the study. In , aerosol fine mass from the IMPROVE network and 8-h average ozone from the GPMP are plotted for the entire study period. Also shown in the figure are NAM-12 mixing depths, solar radiation, temperature and wind speed from the met station at DINO, and snow depth from nearby Vernal, Utah (https://mesonet.agron.iastate.edu/; data downloaded 26 August 2020). The 2018–2019 and 2019–2020 winter seasons (21 December to 21 March) are shaded in gray. During the first winter, aerosol concentrations were elevated throughout the winter season, not returning to lower values until April 2019. Elevated values corresponded to lower temperatures, persistent snow cover, lower wind speeds, and shallower mixing depth. As solar radiation increased in late winter, there was a corresponding increase in ozone, leading to several periods where 8-h ozone exceeded 70 ppbv in February and March. A similar pattern was observed for fine aerosol in the second winter, with concentrations decreasing as warmer temperatures, less snow cover and greater mixing occurred at the site. However, this occurred much earlier in 2020 than in 2019, in early February. The differences in haze for the two years can be seen in Figure S5, depicting webcam images from 24 February 2019 and 24 February 2020, with haze at low elevations in 2019 but not 2020. During this second winter, there was less snow cover overall, most snow was gone when solar radiation increased, and ozone mixing ratios were reduced, with no 8-h values greater than 70 ppbv. Lower minimum ozone concentrations were also observed in the second winter, coincident with the lower snow depth.
Figure 10. Comparison of the two winter periods, including (A) reconstructed fine mass from the IMPROVE network (24-h) and weekly averaged temperature; (B) 8-h averaged ozone from the NPS GPMP; (C) weekly averaged snow depth from Vernal, UT, and wind speed from the on-site met station; and (D) weekly averaged mixing depth from NAM-12 and solar radiation from the on-site met station.
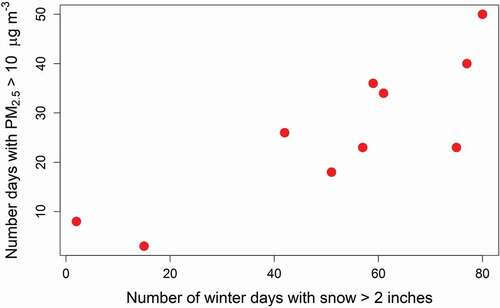
Elevated levels of PM in winter have previously been shown to be associated with snow cover (Chen et al. Citation2012; Green et al. Citation2015; Whiteman et al. Citation2014). Snow cover decreases surface heating and promotes atmospheric stability, while the colder, more humid conditions on snow-covered days also promote ammonium nitrate formation (Chen et al. Citation2012; Green et al. Citation2015; Whiteman et al. Citation2014). Using data from the Utah DEQ site in Vernal (https://www.epa.gov/outdoor-air-quality-data/download-daily-data, data downloaded 16 September 2021), demonstrates the impact of snow on elevated PM2.5 concentrations over a ~10-year period. shows winter data from the Vernal site from December 2010 through March 2021; PM2.5 data were not available for winter 2014–2015. The number of days with elevated PM2.5 (>10 μg m−3) is well correlated with the number of days with snow depth greater than 2 inches, supporting the important role of snow in the Uinta Basin for wintertime PM2.5. Although elevated PM2.5 is observed at the site, maximum 24-h concentrations are typically in the 20–30 μg m−3 range and do not exceed the NAAQS for PM2.5. However, such elevated levels produce a visible haze diminishing the scenic quality. If we assume an aerosol with a concentration of 30 μg m−3, with composition split evenly between ammonium nitrate and organics, and a relative humidity of 90%, this corresponds to a visual range of approximately 10 km. Compared to summer, when visual range is typically near 200 km, this is a dramatic reduction in visibility. Given the number of days with elevated PM2.5 since 2010, these data suggest there is a persistent issue with visibility impairment in the Uinta Basin in winter.
Figure 11. Number of days in Vernal each winter with PM2.5 > 10 μg m−3, relative to the number of days with more than 2 inches of snow depth.
Summary and conclusion
Dinosaur National Monument attracts 300,000 visitors each year, with nearly 40,000 visitors in the months of November–April (https://irma.nps.gov/STATS/). In addition to incredible dinosaur fossils, DINO has hiking trails and scenic vistas for visitors to enjoy. These activities can be limited when air quality is degraded by high levels of pollutants in winter. Previous studies have documented high wintertime ozone in nearby Uinta Basin, driven by NOx and elevated levels of VOCs from regional oil and gas development, coupled with temperature inversions and enhanced photochemistry from persistent snow cover. Persistent snow cover and inversions also can impact haze levels. In this study, we use long-term monitoring data, coupled with expanded measurements for part of the study period, to better characterize air quality at DINO. As for other regions in the Uinta Basin, elevated levels of ozone were observed at DINO, with several days exceeding 70 ppbv during the first winter of the study. Elevated ozone levels occurred when snow cover and stagnant conditions extended later in the season, when solar radiation levels begin to increase from their wintertime minimum. In the second winter, snow cover was nearly gone by March, and 8-h ozone did not exceed 70 ppbv. Wintertime haze was observed at DINO during both winters, with 24-h light extinction values exceeding 100 Mm−1 at least three times each winter. These elevated haze levels were dominated by ammonium nitrate, greatly reducing visual range near the surface to ~35 km. High levels of organics were also observed in winter; a better understanding of this high organic fraction is an important topic left to future research. Analysis of long-term monitoring data at nearby Vernal, Utah suggests that visibility impairment is a persistent problem in the Uinta Basin, impacting visibility at DINO up to 50 days per year.
VOC measurements collected during the second half of this study also showed elevated values during winter. VOC concentrations were dominated by light alkanes, particularly in winter, consistent with oil and gas extraction activities being the primary source in the region. Local meteorological measurements, coupled with modeled mixing depth, suggest that the high VOC and aerosol concentrations observed were the result of temperature inversions, trapping locally emitted pollutants in the basin and allowing them to accumulate to high levels. Nearly all measured pollutants decreased in spring as temperatures increased and conditions were no longer favorable for inversions.
High levels of pollutants due to stagnant conditions in winter are adversely impacting Dinosaur National Monument. Although highly elevated ozone was not observed for both winters in this study, high levels of PM were observed each year in winter. Despite elevated ammonium nitrate concentrations, additional gas-phase ammonia was available during the study period, such that any further increases in NOx emissions in the region are likely to lead to even greater haze levels in winter. Thus, while emissions controls have been successful in helping to reduce NAAQS ozone exceedances in the region (Mansfield and Lyman Citation2021), further reductions in NOx emissions would have the added benefit of limiting wintertime haze at the park.
Acknowledgment
This work was funded by the National Park Service. The CSU portion of the work was funded by Cooperative Agreement P17AC00971, Task Agreements P18AC01188 and P20AC00679. The authors wish to thank the staff at Dinosaur National Monument for site access and support throughout the study. IMPROVE is a collaborative association of state, tribal, and federal agencies, and international partners. The US Environmental Protection Agency is the primary funding source, with contracting and research support from the National Park Service. The Air Quality Group at the University of California, Davis, is the central analytical laboratory, with ion analysis provided by Research Triangle Institute, and carbon analysis provided by Desert Research Institute. Ozone data are collected through the National Park Service Gaseous Pollutant Monitoring Program. The assumptions, findings, conclusions, judgments, and views presented herein are those of the authors and should not be interpreted as necessarily representing the National Park Service.
Data availability statement
Much of the data that support the findings of this study are openly available at
The data that support the findings of this study that are not publicly available are available from the corresponding author, AJP, upon reasonable request.
Disclosure statement
No potential conflict of interest was reported by the author(s).
Additional information
Funding
Notes on contributors
Anthony J. Prenni
Anthony J. Prenni is a chemist in the Air Resources Division of the National Park Service.
Katherine B. Benedict
Katherine B. Benedict is research scientist at Los Alamos National Laboratory.
Derek E. Day
Derek E. Day is a research associate at the Cooperative Institute for Research in the Atmosphere at Colorado State University.
Barkley C. Sive
Barkley C. Sive is a chemist in the Air Resources Division of the National Park Service.
Yong Zhou
Yong Zhou is a research scientist in the Department of Atmospheric Science at Colorado State University.
Lilly Naimie
Lilly Naimie is a graduate student in the Department of Atmospheric Science at Colorado State University.
Kristi A. Gebhart
Kristi A. Gebhart is a senior research associate at the Cooperative Institute for Research in the Atmosphere at Colorado State University.
Tracy Dombek
Tracy Dombek is a research chemist in the Analytical Sciences Division of RTI, International.
Miranda De Boskey
Miranda De Boskey is a chemist in the Analytical Sciences Division of RTI, International.
Nicole P. Hyslop
Nicole P. Hyslop is a principal investigator and operations manager in the Air Quality Research Center at the University of California, Davis.
Emily Spencer
Emily Spencer is a natural resource specialist at Dinosaur National Monument.
Quayle M. Chew
Quayle M. Chew is an air quality monitoring site operator at Dinosaur National Monument.
Jeffrey L. Collett
Jeffrey L. Collett, Jr. is a professor and department head of the Department of Atmospheric Science at Colorado State University.
Bret A. Schichtel
Bret A. Schichtel is a physical scientist in the Air Resources Division of the National Park Service.
References
- Abeleira, A., I. B. Pollack, B. Sive, Y. Zhou, E. V. Fischer, and D. K. Farmer. 2017. Source characterization of volatile organic compounds in the Colorado Northern Front Range Metropolitan Area during spring and summer 2015. J. Geophys.l Res. Atmos. 122 (6):3595–613. doi:10.1002/2016JD026227.
- Ahmadov, R., S. McKeen, M. Trainer, R. Banta, A. Brewer, S. Brown, P. M. Edwards, J. A. de Gouw, G. J. Frost, J. Gilman, et al. 2015. Understanding high wintertime ozone pollution events in an oil- and natural gas-producing region of the western US. Atmos. Chem. Phys. 15 (1):411–29. doi:10.5194/acp-15-411-2015.
- Atkinson, R. 1986. Kinetics and mechanisms of the gas-phase reactions of the hydroxyl radical with organic-compounds under atmospheric conditions. Chem. Rev. 86 (1):69–201. doi:10.1021/cr00071a004.
- Atkinson, R., and J. Arey. 2003. Atmospheric degradation of volatile organic compounds. Chem. Rev. 103 (12):4605–38. doi:10.1021/cr0206420.
- Baasandorj, M., S. W. Hoch, R. Bares, J. C. Lin, S. S. Brown, D. B. Millet, R. Martin, K. Kelly, K. J. Zarzana, C. D. Whiteman, et al. 2017. Coupling between chemical and meteorological processes under persistent cold-air pool conditions: Evolution of wintertime PM2.5 pollution events and N2O5 observations in Utah’s Salt Lake Valley. Environ. Sci. Technol. 51 (11):5941–50. doi:10.1021/acs.est.6b06603.
- Bares, R., J. C. Lin, S. W. Hoch, M. Baasandorj, D. L. Mendoza, B. Fasoli, L. Mitchell, D. Catharine, and B. B. Stephens. 2018. The wintertime covariation of CO2 and criteria pollutants in an Urban Valley of the Western United States. J. Geophys.l Res. Atmos. 123 (5):2684–703. doi:10.1002/2017JD027917.
- Benedict, K. B., X. Chen, A. P. Sullivan, Y. Li, D. Day, A. J. Prenni, E. J. T. Levin, S. M. Kreidenweis, W. C. Malm, B. A. Schichtel, et al. 2013a. Atmospheric concentrations and deposition of reactive nitrogen in Grand Teton National Park. J. Geophys.l Res. Atmos. 118 (20):11875–87. doi:10.1002/2013JD020394.
- Benedict, K. B., D. Day, F. M. Schwandner, S. M. Kreidenweis, B. Schichtel, W. C. Malm, and J. L. Collett. 2013b. Observations of atmospheric reactive nitrogen species in Rocky Mountain National Park and across northern Colorado. Atmos. Environ. 64:66–76. doi:10.1016/j.atmosenv.2012.08.066.
- Benedict, K. B., A. J. Prenni, M. M. H. El-Sayed, A. Hecobian, Y. Zhou, K. A. Gebhart, B. C. Sive, B. A. Schichtel, and J. L. J. Collett. 2020. Volatile organic compounds and ozone at four national parks in the southwestern United States. Atmos. Environ. 239:117783. Article 117783. doi:10.1016/j.atmosenv.2020.117783.
- Benedict, K. B., Y. Zhou, B. C. Sive, A. J. Prenni, K. A. Gebhart, E. V. Fischer, A. Evanoski-Cole, A. P. Sullivan, S. Callahan, B. A. Schichtel, et al. 2019. Volatile organic compounds and ozone in Rocky Mountain National Park during FRAPPE. Atmos. Chem. Phys. 19 (1):499–521. doi:10.5194/acp-19-499-2019.
- Bertman, S. B., J. M. Roberts, D. D. Parrish, M. P. Buhr, P. D. Goldan, W. C. Kuster, F. C. Fehsenfeld, S. A. Montzka, and H. Westberg. 1995. Evolution of alkyl nitrates with air mass age. J. Geophys.l Res. Atmos. 100 (D11):22805–13. doi:10.1029/95JD02030.
- Chen, L. W. A., J. G. Watson, J. C. Chow, M. C. Green, D. Inouye, and K. Dick. 2012. Wintertime particulate pollution episodes in an urban valley of the Western US: A case study. Atmos. Chem. Phys. 12 (21):10051–64. doi:10.5194/acp-12-10051-2012.
- Chow, J. C., L. W. A. Chen, X. L. Wang, M. C. Green, and J. G. Watson. 2021. Improved estimation of PM2.5 brown carbon contributions to filter light attenuation. Particuology 56:1–9. doi:10.1016/j.partic.2021.01.001.
- Chow, J. C., X. L. Wang, B. J. Sumlin, S. B. Gronstal, L.-W. A. Chen, D. L. Trimble, J. G. Watson, S. D. Kohl, S. R. Mayorga, G. Riggio, et al. 2015. Optical calibration and equivalence of a multiwavelength thermal/optical carbon analyzer. Aerosol Air Qual. Res. 15 (4):1145-+. doi:10.4209/aaqr.2015.02.0106.
- Chow, J. C., J. G. Watson, L. W. A. Chen, M. C. O. Chang, N. F. Robinson, D. Trimble, and S. Kohl. 2007. The improve-A temperature protocol for thermal/optical carbon analysis: Maintaining consistency with a long-term database. J. Air Waste Manage. Assoc. 57 (9):1014–23. doi:10.3155/1047-3289.57.9.1014.
- Chow, J. C., J. G. Watson, M. C. Green, X. L. Wang, L. W. A. Chen, D. L. Trimble, P. M. Cropper, S. D. Kohl, and S. B. Gronstal. 2018. Separation of brown carbon from black carbon for IMPROVE and chemical speciation network PM2.5 samples. J. Air Waste Manage. Assoc. 68 (5):494–510. doi:10.1080/10962247.2018.1426653.
- Cohen, A. J., M. Brauer, R. Burnett, H. R. Anderson, J. Frostad, K. Estep, K. Balakrishnan, B. Brunekreef, L. Dandona, R. Dandona, et al. 2017. Estimates and 25-year trends of the global burden of disease attributable to ambient air pollution: An analysis of data from the Global Burden of Diseases Study 2015. Lancet. 389 (10082):1907–18. doi:10.1016/S0140-6736(17)30505-6.
- Conner, T. L., W. A. Lonneman, and R. L. Seila. 1995. Transportation-related volatile hydrocarbon source profiles measured in Atlanta. J. Air Waste Manage. Assoc. 45 (5):383–94. doi:10.1080/10473289.1995.10467370.
- Day, D. E., X. Chen, K. A. Gebhart, C. M. Carrico, F. M. Schwandner, K. B. Benedict, B. A. Schichtel, and J. L. Collett. 2012. Spatial and temporal variability of ammonia and other inorganic aerosol species. Atmos. Environ. 61:490–98. doi:10.1016/j.atmosenv.2012.06.045.
- Dix, B., J. de Bruin, E. Roosenbrand, T. Vlemmix, C. Francoeur, A. Gorchov‐Negron, B. McDonald, M. Zhizhin, C. Elvidge, P. Veefkind, et al. 2020. Nitrogen oxide emissions from U.S. oil and gas production: Recent trends and source attribution. Geophys. Res. Lett. 47 (1). doi:10.1029/2019GL085866.
- Edwards, P. M., S. S. Brown, J. M. Roberts, R. Ahmadov, R. M. Banta, J. A. deGouw, W. P. Dube, R. A. Field, J. H. Flynn, J. B. Gilman, et al. 2014. High winter ozone pollution from carbonyl photolysis in an oil and gas basin. Nature 514 (7522):351-+. doi:10.1038/nature13767.
- Evanoski-Cole, A. R., K. A. Gebhart, B. C. Sive, Y. Zhou, S. L. Capps, D. E. Day, A. J. Prenni, M. I. Schurman, A. P. Sullivan, Y. Li, et al. 2017. Composition and sources of winter haze in the Bakken oil and gas extraction region. Atmos. Environ. 156:77–87. doi:10.1016/j.atmosenv.2017.02.019.
- Franchin, A., D. L. Fibiger, L. Goldberger, E. E. McDuffie, A. Moravek, C. C. Womack, E. T. Crosman, K. S. Docherty, W. P. Dube, S. W. Hoch, et al. 2018. Airborne and ground-based observations of ammonium-nitrate-dominated aerosols in a shallow boundary layer during intense winter pollution episodes in northern Utah. Atmos. Chem. Phys. 18 (23):17259–76. doi:10.5194/acp-18-17259-2018.
- Francoeur, C. B., B. C. McDonald, J. B. Gilman, K. J. Zarzana, B. Dix, S. S. Brown, J. A. de Gouw, G. J. Frost, M. Li, S. A. McKeen, et al. 2021. Quantifying methane and ozone precursor emissions from oil and gas production regions across the contiguous US. Environ. Sci. Technol. 55 (13):9129–39. doi:10.1021/acs.est.0c07352.
- Gebhart, K. A., D. E. Day, A. J. Prenni, B. A. Schichtel, J. L. Hand, and A. R. Evanoski-Cole. 2018. Visibility impacts at Class I areas near the Bakken oil and gas development. J. Air Waste Manage. Assoc. 68 (5):477–93. doi:10.1080/10962247.2018.1429334.
- Gilman, J. B., B. M. Lerner, W. C. Kuster, and J. A. de Gouw. 2013. Source signature of volatile organic compounds from oil and natural gas operations in Northeastern Colorado. Environ. Sci. Technol. 47 (3):1297–305. doi:10.1021/es304119a.
- Gorchov Negron, A. M., B. C. McDonald, S. A. McKeen, J. Peischl, R. Ahmadov, J. A. de Gouw, G. J. Frost, M. G. Hastings, I. B. Pollack, T. B. Ryerson, et al. 2018. Development of a fuel-based oil and gas Inventory of nitrogen oxides emissions. Environ. Sci. Technol. 52 (17):10175–85. doi:10.1021/acs.est.8b02245.
- Green, M. C., J. C. Chow, J. G. Watson, K. Dick, and D. Inouye. 2015. Effects of snow cover and atmospheric stability on winter PM2.5 concentrations in Western U.S. Valleys. J. Appl. Meteorol. Climatol 54 (6):1191–201. doi:10.1175/JAMC-D-14-0191.1.
- Hand, J. L., K. A. Gebhart, B. A. Schichtel, and W. C. Malm. 2012. Increasing trends in wintertime particulate sulfate and nitrate ion concentrations in the great plains of the United States (2000-2010). Atmos. Environ. 55:107–10. doi:10.1016/j.atmosenv.2012.03.050.
- Hand, J. L., A. J. Prenni, B. A. Schichtel, W. C. Malm, and J. C. Chow. 2019. Trends in remote PM2.5 residual mass across the United States: Implications for aerosol mass reconstruction in the IMPROVE network. Atmos. Environ. 203:141–52. doi:10.1016/j.atmosenv.2019.01.049.
- Harley, R. A., S. A. McKeen, J. Pearson, M. O. Rodgers, and W. A. Lonneman. 2001. Analysis of motor vehicle emissions during the Nashville/Middle Tennessee Ozone Study. Journal of Geophysical Research: Atmospheres 106 (D4):1907–18. doi:10.1029/2000JD900677.
- Helmig, D., C. R. Thompson, J. Evans, P. Boylan, J. Hueber, and J. H. Park. 2014. Highly elevated atmospheric levels of volatile organic compounds in the Uintah Basin, Utah. Environ. Sci. Technol. 48:4707–15.
- Hrdina, A., J. G. Murphy, A. G. Hallar, J. C. Lin, A. Moravek, R. Bares, R. C. Petersen, A. Franchin, A. M. Middlebrook, L. Goldberger, et al. 2021. The role of coarse aerosol particles as a sink of HNO3 in wintertime pollution events in the Salt Lake Valley. Atmos. Chem. Phys. 21 (10):8111–26. doi:10.5194/acp-21-8111-2021.
- Hyslop, N. P., K. Trzepla, and W. H. White. 2015. Assessing the suitability of historical PM2.5 element measurements for trend analysis. Environ. Sci. Technol. 49 (15):9247–55. doi:10.1021/acs.est.5b01572.
- Janjic, Z. I. 2003. A nonhydrostatic model based on a new approach. Meteorol. Atmos. Phys. 82 (1–4):271–85. doi:10.1007/s00703-001-0587-6.
- Jobson, B. T., C. M. Berkowitz, W. C. Kuster, P. D. Goldan, E. J. Williams, F. C. Fesenfeld, E. C. Apel, T. Karl, W. A. Lonneman, and D. Riemer. 2004. Hydrocarbon source signatures in Houston, Texas: Influence of the petrochemical industry. J. Geophys.l Res. Atmos. 109 (D24). doi:10.1029/2004JD004887.
- Kenagy, H. S., T. L. Sparks, C. J. Ebben, P. J. Wooldrige, F. D. Lopez-Hilfiker, B. H. Lee, J. A. Thornton, E. E. McDuffie, D. L. Fibiger, S. S. Brown, et al. 2018. NOx lifetime and NOy partitioning during WINTER. J. Geophys.l Res. Atmos. 123:9813–27.
- Kim, Y. J., S. N. Spak, G. R. Carmichael, N. Riemer, and C. O. Stanier. 2014. Modeled aerosol nitrate formation pathways during wintertime in the Great Lakes region of North America. J. Geophys.l Res. Atmos. 119 (21):12420–45. doi:10.1002/2014JD022320.
- Koh, C. A., R. E. Westacott, W. Zhang, K. Hirachand, J. L. Creek, and A. K. Soper. 2002. Mechanisms of gas hydrate formation and inhibition. Fluid Phase Equilib. 194:143–51. doi:10.1016/S0378-3812(01)00660-4.
- Kohut, R. 2007. Assessing the risk of foliar injury from ozone on vegetation in parks in the U.S. National Park Service’s Vital Signs Network. Environ. Pollut. 149 (3):348–57. doi:10.1016/j.envpol.2007.04.022.
- Kotchenruther, R. A. 2016. Source apportionment of PM2.5 at multiple Northwest US sites: Assessing regional winter wood smoke impacts from residential wood combustion. Atmos. Environ. 142:210–19. doi:10.1016/j.atmosenv.2016.07.048.
- Kuprov, R., D. J. Eatough, T. Cruickshank, N. Olson, P. M. Cropper, and J. C. Hansen. 2014. Composition and secondary formation of fine particulate matter in the Salt Lake Valley: Winter 2009. J. Air Waste Manage. Assoc. 64 (8):957–69. doi:10.1080/10962247.2014.903878.
- Lareau, N. P., E. Crosman, C. D. Whiteman, J. D. Horel, S. W. Hoch, W. O. J. Brown, and T. W. Horst. 2013. The persistent cold-air pool study. Bull. Am. Meteorol. Soc. 94 (1):51–63. doi:10.1175/BAMS-D-11-00255.1.
- Laskin, A., P. Lin, J. Laskin, L. T. Fleming, and S. Nizkorodov, 2017. Molecular characterization of atmospheric brown carbon, Symposium on Multiphase Chemistry of Atmospheric Aerosols/Fall 2017 ACS Meeting, Washington, DC, pp. 261–74.
- Lee, L., P. J. Wooldridge, J. deGouw, S. S. Brown, T. S. Bates, P. K. Quinn, and R. C. Cohen. 2015. Particulate organic nitrates observed in an oil and natural gas production region during wintertime. Atmos. Chem. Phys. 15:9313–25.
- Lee, T., X. Y. Yu, B. Ayres, S. M. Kreidenweis, W. C. Malm, and J. L. Collett. 2008. Observations of fine and coarse particle nitrate at several rural locations in the United States. Atmos. Environ. 42 (11):2720–32. doi:10.1016/j.atmosenv.2007.05.016.
- Li, Y., F. M. Schwandner, H. J. Sewell, A. Zivkovich, M. Tigges, S. Raja, S. Holcomb, J. V. Molenar, L. Sherman, C. Archuleta, et al. 2014. Observations of ammonia, nitric acid, and fine particles in a rural gas production region. Atmos. Environ. 83:80–89. doi:10.1016/j.atmosenv.2013.10.007.
- Lough, G. C., J. J. Schauer, W. A. Lonneman, and M. K. Allen. 2005. Summer and winter nonmethane hydrocarbon emissions from on-road motor vehicles in the Midwestern United States. J. Air Waste Manage. Assoc. 55 (5):629–46. doi:10.1080/10473289.2005.10464649.
- Lyman, S., and T. Tran. 2015. Inversion structure and winter ozone distribution in the Uintah Basin, Utah, USA. Atmos. Environ. 123:156–65.
- Malm, W. C., J. F. Sisler, D. Huffman, R. A. Eldred, and T. A. Cahill. 1994. Spatial and seasonal trends in particle concentration and optical extinction in the United States. J. Geophys.l Res. Atmos. 99 (D1):1347–70. doi:10.1029/93JD02916.
- Mansfield, M. L., and S. N. Lyman. 2021. Ozone Pollution in Utah’s Uinta Basin is Attenuating. Atmosphere 12 (4).
- Matichuk, R., G. Tonnesen, D. Luecken, R. Gilliam, S. L. Napelenok, K. R. Baker, D. Schwede, B. Murphy, D. Helmig, S. N. Lyman, et al. 2017. Evaluation of the community multiscale air quality model for simulating winter ozone formation in the Uinta Basin. J. Geophys.l Res. Atmos. 122 (24):13545–72. doi:10.1002/2017JD027057.
- McDuffie, E. E., P. M. Edwards, J. B. Gilman, B. M. Lerner, W. P. Dube, M. Trainer, D. E. Wolfe, W. M. Angevine, J. deGouw, E. J. Williams, et al. 2016. Influence of oil and gas emissions on summertime ozone in the Colorado Northern Front Range. J. Geophys.l Res. Atmos. 121 (14):8712–29. doi:10.1002/2016JD025265.
- McDuffie, E. E., C. C. Womack, D. L. Fibiger, W. P. Dube, A. Franchin, A. M. Middlebrook, L. Goldberger, B. Lee, J. A. Thornton, A. Moravek, et al. 2019. On the contribution of nocturnal heterogeneous reactive nitrogen chemistry to particulate matter formation during wintertime pollution events in Northern Utah. Atmos. Chem. Phys. 19 (14):9287–308. doi:10.5194/acp-19-9287-2019.
- McGaughey, G. R., N. R. Desai, D. T. Allen, R. L. Seila, W. A. Lonneman, M. P. Fraser, R. A. Harley, A. K. Pollack, J. M. Ivy, and J. H. Price. 2004. Analysis of motor vehicle emissions in a Houston tunnel during the texas air quality study 2000. Atmos. Environ. 38 (20):3363–72. doi:10.1016/j.atmosenv.2004.03.006.
- Molenar, J. V., and G. Persha, 2008. Optec NGN-2 LED ambient integrating nephelometer, AWMA Visibility Specialty Conference, Moab, UT, p. 5. Extended Abstract #77.
- Neemann, E. M., E. T. Crosman, J. D. Horel, and L. Avey. 2015. Simulations of a cold-air pool associated with elevated wintertime ozone in the Uintah Basin, Utah. Atmos. Chem. Phys. 15 (1):135–51. doi:10.5194/acp-15-135-2015.
- Oltmans, S., R. Schnell, B. Johnson, G. Pétron, T. Mefford, and R. Neely. 2014. Anatomy of wintertime ozone associated with oil and natural gas extraction activity in Wyoming and Utah. Elementa: Sci. Anthropocene. 2:000024.
- Petron, G., G. Frost, B. R. Miller, A. I. Hirsch, S. A. Montzka, A. Karion, M. Trainer, C. Sweeney, A. E. Andrews, L. Miller, et al. 2012. Hydrocarbon emissions characterization in the Colorado Front Range: A pilot study. J. Geophys.l Res. Atmos. 117 (D4). doi:10.1029/2011JD016360.
- Pitchford, M., W. Malm, B. Schichtel, N. Kumar, D. Lowenthal, and J. Hand. 2007. Revised algorithm for estimating light extinction from IMPROVE particle speciation data. J. Air Waste Manage. Assoc. 57 (11):1326–36. doi:10.3155/1047-3289.57.11.1326.
- Prenni, A. J., D. E. Day, A. R. Evanoski-Cole, B. C. Sive, A. Hecobian, Y. Zhou, K. A. Gebhart, J. L. Hand, A. P. Sullivan, Y. Li, et al. 2016. Oil and gas impacts on air quality in federal lands in the Bakken region: An overview of the Bakken Air Quality Study and first results. Atmos. Chem. Phys. 16 (3):1401–16. doi:10.5194/acp-16-1401-2016.
- Prenni, A. J., J. L. Hand, W. C. Malm, S. Copeland, G. Luo, F. Yu, N. Taylor, L. M. Russell, and B. A. Schichtel. 2019. An examination of the algorithm for estimating light extinction from IMPROVE particle speciation data. Atmos. Environ. 214:116880. doi:10.1016/j.atmosenv.2019.116880.
- Rossabi, S., and D. Helmig. 2018. Changes in atmospheric butanes and pentanes and their isomeric ratios in the continental United States. J. Geophys.l Res. Atmos. 123 (7):3772–90. doi:10.1002/2017JD027709.
- Russo, R. S., Y. Zhou, K. B. Haase, O. W. Wingenter, E. K. Frinak, H. Mao, R. W. Talbot, and B. C. Sive. 2010. Temporal variability, sources, and sinks of C-1-C-5 alkyl nitrates in coastal New England. Atmos. Chem. Phys. 10:1865–83.
- Schichtel, B. A., J. L. Hand, M. G. Barna, K. A. Gebhart, S. Copeland, J. Vimont, and W. C. Malm. 2017. Origin of fine particulate carbon in the rural United States. Environ. Sci. Technol. 51 (17):9846–55. doi:10.1021/acs.est.7b00645.
- Schichtel, B. A., W. C. Malm, G. Bench, S. Fallon, C. E. McDade, J. C. Chow, and J. G. Watson. 2008. Fossil and contemporary fine particulate carbon fractions at 12 rural and urban sites in the United States. J. Geophysl. Res. Atmos. 113.
- Silcox, G. D., K. E. Kelly, E. T. Crosman, C. D. Whiteman, and B. L. Allen. 2012. Wintertime PM2.5 concentrations during persistent, multi-day cold-air pools in a mountain valley. Atmos. Environ. 46:17–24.
- Silva, P. J., E. L. Vawdrey, M. Corbett, and M. Erupe. 2007. Fine particle concentrations and composition during wintertime inversions in Logan, Utah, USA. Atmos. Environ. 41:5410–22.
- Simpson, I. J., N. J. Blake, D. R. Blake, E. Atlas, F. Flocke, J. H. Crawford, H. E. Fuelberg, C. M. Kiley, S. Meinardi, and F. S. Rowland. 2003. Photochemical production and evolution of selected C-2-C-5 alkyl nitrates in tropospheric air influenced by Asian outflow. J. Geophys.l Res. Atmos. 108 (D20). doi:10.1029/2002JD002830.
- Stanier, C., A. Singh, W. Adamski, J. Baek, M. Caughey, G. Carmichael, E. Edgerton, D. Kenski, M. Koerber, J. Oleson, et al. 2012. Overview of the LADCO winter nitrate study: Hourly ammonia, nitric acid and PM2.5 composition at an urban and rural site pair during PM2.5 episodes in the US Great Lakes region. Atmos. Chem. Phys. 12 (22):11037–56. doi:10.5194/acp-12-11037-2012.
- Stroud, C. A., G. Morneau, P. A. Makar, M. D. Moran, W. Gong, B. Pabla, J. Zhang, V. S. Bouchet, D. Fox, S. Venkatesh, et al. 2008. OH-reactivity of volatile organic compounds at urban and rural sites across Canada: Evaluation of air quality model predictions using speciated VOC measurements. Atmos. Environ. 42 (33):7746–56. doi:10.1016/j.atmosenv.2008.05.054.
- Swarthout, R. F., R. S. Russo, Y. Zhou, A. H. Hart, and B. C. Sive. 2013. Volatile organic compound distributions during the NACHTT campaign at the boulder atmospheric observatory: Influence of urban and natural gas sources. J. Geophys.l Res. Atmos. 118:10614–37.
- Swarthout, R. F., R. S. Russo, Y. Zhou, B. M. Miller, B. Mitchell, E. Horsman, E. Lipsky, D. C. McCabe, E. Baum, and B. C. Sive. 2015. Impact of marcellus shale natural gas development in Southwest Pennsylvania on volatile organic compound emissions and regional air quality. Environ. Sci. Technol. 49 (5):3175–84. doi:10.1021/es504315f.
- Tian, M., Y. Liu, F. M. Yang, L. M. Zhang, C. Peng, Y. Chen, G. M. Shi, H. B. Wang, B. Luo, C. T. Jiang, et al. 2019. Increasing importance of nitrate formation for heavy aerosol pollution in two megacities in Sichuan Basin, southwest China. Environ. Pollut. 250:898–905. doi:10.1016/j.envpol.2019.04.098.
- Turner, M. C., M. Jerrett, C. A. Pope, D. Krewski, S. M. Gapstur, W. R. Diver, B. S. Beckerman, J. D. Marshall, J. Su, D. L. Crouse, et al. 2016. long-term ozone exposure and mortality in a large prospective study. Am. J. Respir. Crit. Care Med. 193 (10):1134–42. doi:10.1164/rccm.201508-1633OC.
- Vecchi, R., V. Bernardoni, S. Valentini, A. Piazzalunga, P. Fermo, and G. Valli. 2018. Assessment of light extinction at a European polluted urban area during wintertime: Impact of PM1 composition and sources. Environ. Pollut. 233:679–89. doi:10.1016/j.envpol.2017.10.059.
- Velasco, E., B. Lamb, H. Westberg, E. Allwine, G. Sosa, J. L. Arriaga-Colina, B. T. Jobson, M. L. Alexander, P. Prazeller, W. B. Knighton, et al. 2007. Distribution, magnitudes, reactivities, ratios and diurnal patterns of volatile organic compounds in The Valley of Mexico during the MCMA 2002 & 2003 field campaigns. Atmos. Chem. Phys. 7 (2):329–53. doi:10.5194/acp-7-329-2007.
- Ward, T., and T. Lange. 2010. The impact of wood smoke on ambient PM2.5 in northern Rocky Mountain valley communities. Environ. Pollut. 158 (3):723–29. doi:10.1016/j.envpol.2009.10.016.
- Watson, J. G., J. C. Chow, and E. M. Fujita. 2001. Review of volatile organic compound source apportionment by chemical mass balance. Atmos. Environ. 35 (9):1567–84. doi:10.1016/S1352-2310(00)00461-1.
- White, W. H., K. Trzepla, N. P. Hyslop, and B. A. Schichtel. 2016. A critical review of filter transmittance measurements for aerosol light absorption, and de novo calibration for a decade of monitoring on PTFE membranes. Aerosol Sci. Technol. 50 (9):984–1002. doi:10.1080/02786826.2016.1211615.
- Whiteman, C. D., S. W. Hoch, J. D. Horel, and A. Charland. 2014. Relationship between particulate air pollution and meteorological variables in Utah’s Salt Lake Valley. Atmos. Environ. 94:742–53. doi:10.1016/j.atmosenv.2014.06.012.
- Wild, R. J., P. M. Edwards, T. S. Bates, R. C. Cohen, J. A. de Gouw, W. P. Dube, J. B. Gilman, J. Holloway, J. Kercher, A. R. Koss, et al. 2016. Reactive nitrogen partitioning and its relationship to winter ozone events in Utah. Atmos. Chem. Phys. 16 (2):573–83. doi:10.5194/acp-16-573-2016.
- Womack, C. C., E. E. McDuffie, P. M. Edwards, R. Bares, J. A. de Gouw, K. S. Docherty, W. P. Dube, D. L. Fibiger, A. Franchin, J. B. Gilman, et al. 2019. An Odd Oxygen Framework for Wintertime Ammonium Nitrate Aerosol Pollution in Urban Areas: NOx and VOC Control as Mitigation Strategies. Geophys. Res. Lett. 46:4971–79.
- Yu, X. Y., T. Lee, B. Ayres, S. M. Kreidenweis, J. L. Collett, and W. C. Malm. 2005. Particulate nitrate measurement using nylon filters. J. Air Waste Manage. Assoc. 55 (8):1100–10. doi:10.1080/10473289.2005.10464721.
- Yu, X. Y., T. Lee, B. Ayres, S. M. Kreidenweis, W. Malm, and J. L. Collett. 2006. Loss of fine particle ammonium from denuded nylon filters. Atmos. Environ. 40:4797–807.
- Zhou, Y., D. Shively, H. Mao, R. S. Russo, B. Pape, R. N. Mower, R. Talbot, and B. C. Sive. 2010. Air toxic emissions from snowmobiles in Yellowstone National Park. Environ. Sci. Technol. 44:222–28.