
 ?Mathematical formulae have been encoded as MathML and are displayed in this HTML version using MathJax in order to improve their display. Uncheck the box to turn MathJax off. This feature requires Javascript. Click on a formula to zoom.
ABSTRACT
This paper reports the design and qualification of the first purpose-built, bench-scale reactor system to model the municipal waste-to-energy combustion of fluorinated polymers. Using the principle of similarity, the gas-phase combustion zone of a typical municipal waste-to-energy plant has been scaled down to the bench with a focus on chemical similarity. Chemical similarity is achieved in large part through the use of methanol as a surrogate for municipal solid waste (MSW). Review of prior research shows that methanol is one of the major volatile products expected during MSW thermal conversion in the fuel bed of waste-to-energy plants. Like full-scale waste-energy plants, the design of the bench-scale model includes a flame zone and a post-flame zone. Maintaining steady methanol vapor flow premixed with air to the model reactor system ensures stable combustion resulting in bench-scale CO emission levels comparable to those of full-scale waste-to-energy plants. Since investigation of fluorinated polymer combustion includes trace analysis of exhaust gas for perfluorooctanoic acid (PFOA), qualification testing focused on PFOA collection efficiency. High PFOA collection efficiency (>90%) demonstrated the capability of the reactor system in transporting and absorbing PFOA that may be generated during high-temperature combustion testing of fluorinated polymers. Overall, the bench-scale system is qualified for its intended use to investigate potential generation of PFOA from combustion of fluorinated polymers under conditions representative of waste-to-energy combustion.
Implications: Decision-makers depend on environmental researchers to provide reliable predictions of pollutant emissions from waste combustion of polymers at end of product life. Reliable predictions are especially important with regard to questions about potential PFOA emissions from municipal waste combustion of fluorinated polymers. Results from qualification testing confirm that the novel bench-scale model reactor system is capable of representing gas-phase municipal waste combustion behavior upstream of air pollution control and generating representative exhaust gas samples for off-line trace-level analysis of PFOA.
Introduction
Environmental professionals are often asked how to reliably predict pollutant emissions generated by burning some particular material in a modern waste combustion system. If the question concerns emission of carbon dioxide (CO2), it is readily answered once the carbon content of the material has been determined. If the focus is on emission of an organic compound present in the material, the question is typically straightforward to answer by first checking where the compound stands on the thermal stability-based incinerability index (Carroll et al. Citation1992; Dellinger, Taylor, and Lee Citation1993; Taylor, Dellinger, and Lee Citation1990) and then comparing that ranking to the furnace operating temperature. For conventional pollutants, the U.S. Environmental Protection Agency’s Compilation of Air Pollutant Emission Factors (AP-42) (EPA Citation1995) provides the answer. And for emission of other pollutants such as certain hydrocarbons (Curran Citation2019a) and small halocarbons (Tsang, Burgess, and Babushok Citation1998), computer simulation can fill the data gap. But when it comes to predicting waste combustion emissions for the myriad polymers and synthetic materials in the modern household that can wind up in the trash, the only way to answer the question is to measure empirically. The challenge is to make the measurements in a way that isolates the fate of the specific material and that realistically represents what happens during combustion in a municipal waste-to-energy plant. Simultaneously achieving these two objectives generally requires making initial measurements in the laboratory. Indeed, working in the laboratory allows evaluating the emission impact of the specific material in isolation without the influence of variable process conditions (e.g., municipal waste feed composition) encountered at full scale (Carnes and Dellinger Citation1987; Wikström and Marklund Citation1998). Laboratory-scale thermal reactors also permit economically generating decomposition data from small quantities of test material (Rubey Citation1980), precise control of operating parameters for reproducible conditions (Fängmark et al. Citation1991; Lin, Wu, and Liu Citation1997; Rubey and Carnes Citation1985), easy cleaning between replicate runs (Fängmark et al. Citation1991; Marklund et al. Citation1990), and routine access to the test system (Winter Citation2009). While existing laboratory-scale systems generally have these attributes in common, their use has involved different approaches to representing full-scale behavior and revealed unexpected challenges when studying the high-temperature combustion of fluorinated polymers (as defined by Buck et al. (Citation2011)).
Representing full-scale gas-phase behavior
Examination of the design features and combustion performance of the reactors used in four recent studies illustrates differences in modeling full-scale gas-phase behavior in the laboratory; see . Unlike the vast literature on pyrolysis of fluorinated polymers reviewed in 2014 (Puts, Crouse, and Ameduri Citation2014), these four works investigated the high-temperature combustion characteristic of waste-to-energy plants in the U.S. and municipal waste incinerators in Europe. As with full-scale facilities, the design of the laboratory reactors in these studies can be assessed in terms of the 3 Ts of combustion: time, temperature, and turbulence (Meissner Citation1961), where turbulence refers to the mixing of oxygen with volatiles evolved from the solids in the fuel bed (Corey et al. Citation1953). Review of indicates that the reactors in these studies were designed to operate at temperatures and gas residence times generally consistent with the ranges observed at full-scale waste-to-energy plants in the U.S. or Europe (Giraud, Taylor, and Huang Citation2021).
Table 1. Reactor systems used to investigate high-temperature combustion of fluorinated polymers.
Comparison of combustion performance brings out differences in how the reactor designs deal with mixing. The bench-scale thermal degradation reactor used by Yamada et al. (Citation2005) pyrolyzed the polymer and associated material cocurrent with air without provision for gas mixing as evidenced by the relatively high carbon monoxide (CO) concentration (321 ppmv) resulting in combustion efficiency below 99%. The bench-scale reactor employed by García, Viciano, and Font (Citation2007) was partly packed with Raschig rings to facilitate mixing between air and the gases evolved during polymer pyrolysis. The resulting low combustion efficiencies (≤73%) seem to reflect the focus of García et al. on substoichiometric fuel-rich conditions because earlier exploration of polyvinyl chloride combustion with the same reactor (Aracil, Font, and Conesa Citation2005) yielded 100% combustion efficiency at 1000°C, demonstrating the effectiveness of their mixing approach. Similarly, the pilot-scale systems of Lemieux et al. (Citation2007) and Aleksandrov et al. (Citation2019) exhibited very high (≥99.8%) combustion efficiencies and low carbon monoxide (CO) concentrations (<100 ppmv), signaling the same sort of turbulent mixing of oxygen with volatiles observed at full-scale (Ryu, Shin, and Choi Citation2002).
Comparison of temperature control approaches indicate differences in reaction atmosphere. Electric furnaces were used to control temperature in the two bench-scale systems. Such external heating was required for the non-flame reactor used by Yamada et al. (Graham, Berman, and Dellinger Citation1993; Yamada et al. Citation2005). Lee (Lee et al. Citation1987) criticized the use of bench-scale non-flame reactor results to represent full-scale waste combustion in part because there are no free radicals generated in the flame to be available in the post-flame zone. In contrast, the two pilot-scale systems were heated by burning a hydrocarbon polymer/cellulose blend and wood pellets, respectively, along with natural gas. Hydrocarbon polymers, cellulose, and wood are major components of municipal solid waste (MSW) (Zhou et al. Citation2014). Hence, the reaction atmospheres above the rotary kiln-based fuel beds in these pilot-scale systems are expected to be comparable to the gas composition above the fuel bed of a municipal waste-to-energy plant.
Comparison between the pilot-scale systems and the bench-scale systems highlights the importance of designing a model reactor configured to operate with (1) sufficient control over temperature and gas residence time, (2) an effective surrogate for MSW, (3) adequate air-volatile mixing, and (4) a flame zone prior to the post-flame zone.
Experimental challenges
During three of the four studies in , experimental challenges with the reactor systems were encountered when investigating the potential high-temperature transformation of fluorinated polymers into perfluoroalkyl substances such as perfluorooctanoic acid (PFOA). The bench-scale system used by Yamada et al. (Citation2005) included a quartz wool packed cold trap in the reactor exhaust line to collect volatiles for in-line determination via gas chromatography/mass spectrometry (GC/MS) consistent with prior work on chlorinated organics in the same research group (Graham, Berman, and Dellinger Citation1993; Rubey and Grant Citation1988). This reliance on GC/MS limited the sensitivity of PFOA detection to 0.35 ppmv (5.85 mg dscm−1 where STP = 25°C, 1 atmosphere). But for trace-level analysis of ionic perfluoroalkyl substances, liquid chromatography with tandem mass spectrometry (LC/MS/MS) is the preferred technique (Larsen and Kaiser Citation2007) because LC/MS/MS offers orders of magnitude lower quantitation than GC/MS (Jahnke and Berger Citation2009). Attempts by Yamada et al. (Citation2005) to attain more sensitive detection were thwarted by poor PFOA absorption in their custom bubblers during collection of aqueous samples for off-line LC/MS/MS analysis. Their measurement of PFOA transport across the reactor system yielded collection efficiencies of 15–21% when using aqueous sampling and LC/MS/MS analysis for PFOA as perfluorooctanoate (PFO) anion. Measured high collection efficiency (>70%) is necessary to confirm the ability of the reactor system to capture any PFOA that may result from polymer combustion. Determination via in-line GC/MS yielded a collection efficiency of 74%, and the authors suggested PFOA condensation in an unheated transport line as a potential cause for the shortfall. Since PFOA adheres to glass (Sundström et al. Citation2012), adsorption to the quartz wool packing in the cold trap was also a likely cause.
The two pilot-scale systems (Aleksandrov et al. Citation2019; Lemieux et al. Citation2007) suffered sampling problems of a different sort. PFOA background contamination was experienced in both studies. Lemieux et al. (Citation2007) were not able to distinguish between emissions from burning natural gas and from burning carpet spiked with long-chain side-chain-fluorinated acrylate polymer due to extensive past use of fluorinated polymer tubing for gas sampling or to laboratory artifacts. Aleksandrov et al. (Citation2019) raised their LC/MS/MS-based PFOA limit of quantitation to 300 ng dscm−1 (where STP = 0°C, 1 atmosphere) due to contamination of the solvent used during recovery of the gas sampling train. While the solvent contamination problems faced by Aleksandrov et al. could be overcome on a going-forward basis, the need for large quantities (300 g per run) of high-cost fluoropolymer (Zhang et al. Citation2016) presents another challenge in pursuit of reliable emission predictions. When the number of experimental runs and the mass of polymer consumed by preparatory material characterization are considered, the amount of fluorinated polymer required for pilot-scale emission testing becomes cost-prohibitive.
The challenges encountered during research with these reactor systems highlight the need to ensure collection of representative gas samples for off-line trace-level analysis that are free from external contamination. Additionally, cost-based quantity constraints on the test material favor bench-scale over pilot-scale combustion.
Purpose
In light of the advantages and challenges posed by prior reactor systems, the purpose of this project was to design and qualify a bench-scale reactor system capable of (a) representing municipal waste combustion gas-phase behavior above the fuel bed and (b) collecting representative exhaust gas samples for off-line trace-level analysis of PFOA. Important attributes for the design (Weekman Citation1974) included: (1) compatibility with very small available quantities of test material, (2) tight control over reactor system temperature and gas residence time, (3) an effective surrogate for MSW, (4) adequate air-volatile mixing, (5) a flame zone prior to the post-flame zone, and (6) preventing the influence of external PFOA contamination. This paper reports the first purpose-built reactor system to model the municipal waste-to-energy combustion of fluorinated polymers at bench scale.
Approach
Designing a bench-scale model reactor involves scaling down key aspects of the commercial unit being simulated (Carberry Citation1964). In theory, the principle of similarity (Johnstone and Thring Citation1957) can guide scale-down of the combustion zone of a typical full-scale waste-to-energy plant to the bench to allow study of trace combustion products. However, since complete similarity between bench scale and full scale is essentially impossible (Froment Citation1981; Spalding et al. Citation1963), simplifications are needed to apply similarity to the complexities of combustion process scaling (Leckner, Szentannai, and Winter Citation2011). For example, Wochele and Stucki (Citation1999) have demonstrated how to effectively employ similarity in the design of a bench-scale, batch-fed tubular reactor as a model of a continuous, grate-fired municipal waste incinerator to study the emission behavior of heavy metals. Consistent with Leckner, Szentannai, and Winter (Citation2011), Wochele and Stucki omit consideration of fluid dynamic similarity in their scale down. Like Winter (Citation2009), they focus more on chemical similarity. Following these precedents, the scale down in this project concentrated mainly on chemical similarity.
This paper describes the design and qualification of the bench-scale model of municipal waste-to-energy combustion of fluorinated polymers in five subsequent sections. First, key aspects of waste-to-energy combustion technology affecting chemical transformation are characterized to provide the design basis for the bench-scale model. The design of the model system is then presented, highlighting similarity to full-scale municipal waste combustion. Next, the experimental methodology to qualify the bench-scale model for use is summarized before presenting the results and discussion of this qualification testing, followed by conclusions.
Municipal waste combustion as design basis
In practice, full-scale waste-to-energy plants have the following components: waste supply, thermal conversion, gas-phase combustion, energy recovery, air pollution control, and management of ash and other residues (Leckner Citation2015). An additional plant component is gas monitoring for process control and compliance with emission standards on pollutants such as CO (Kedrowski and Chromec Citation2013). Thermal conversion and gas-phase combustion dominate the chemical transformations. MSW is thermally converted to gases and vapors via pyrolysis and gasification in the first stage, and then the gas is combusted in the second stage. conceptually illustrates the main components of a waste-to-energy plant in a block flow diagram.
Figure 1. Waste-to-energy plant block flow diagram.
The potential to emit compounds as gas-phase products of incomplete combustion (PICs) depends not only on the design and operation of the combustion process but also on the characteristics of the waste feed (Brunner Citation1985). Hence, waste characterization is discussed next prior to turning to thermal conversion and gas-phase combustion in later subsections.
MSW Characterization
For the waste-to-energy process, the feedstock is a complex mixture of materials differing in physical and chemical characteristics, namely MSW (Matsakas et al. Citation2017). As part of their tracking of MSW composition, the U.S. Environmental Protection Agency (EPA) characterizes waste processed via municipal waste combustion. The main MSW source categories in 2017 were food waste (22.0%), plastics (16.4%), paper and paperboard (13.2%), textiles (9.3%), metals (8.6%), wood (8.4%), rubber (6.7%), yard waste (6.2%), glass (4.3%), other (4.3%), and leather (0.6%) (EPA Citation2019a, Citation2019b). The “other” category includes wood pulp and other disposable diaper residues (EPA Citation2019b).
Reallocating these source categories into high-level material classes facilitates an understanding of the effect of waste inputs on reaction atmosphere above the fuel bed of full-scale waste-to-energy facilities. provides a Sankey diagram (Lupton and Allwood Citation2017) to summarize the material characterization of MSW into plant-based materials, synthetic polymers, inorganics, and animal products as presented in section S1 of the Supplemental Material.
Figure 2. Material characterization of MSW to waste-to-energy combustion in 2017.
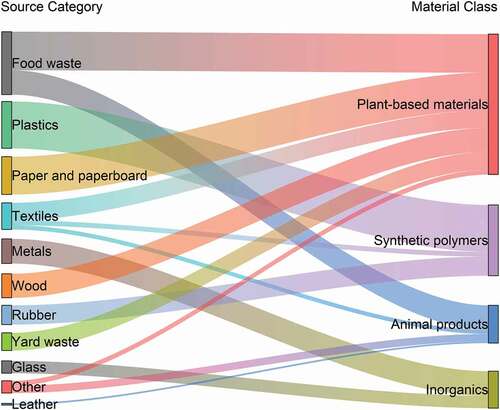
As shown in Table S1 in the Supplemental Material, MSW can be characterized into the following high-level material classes: 49% plant-based materials, 25% synthetic polymers, 13% inorganics, and 13% animal products. These values are on a wet (as is) basis.
Accounting for roughly half of the annual feed to U.S. waste-to-energy plants, plant-based biomass consists of water, carbohydrates, lignin, lipid, proteins, ash precursors, and extractable compounds (Speight Citation2008). Of these fractions, water is generally the most abundant, typically accounting for 70% of food waste, 6% of waste paper, 10% of textile waste, 20% of waste wood, and 60% of yard waste (Tchobanoglous, Theisen, and Vigil Citation1993). Plant carbohydrates can be divided into monosaccharides (e.g., glucose), disaccharides (e.g., sucrose), and polysaccharides (Sawyer and McCarty Citation1978). The polysaccharides include cellulose, hemicellulose, and starch (e.g., pectin).
The rich diversity of plant-based biomass can be seen in the varying carbohydrate composition of plants and plant-based products on a dry basis. Raw peeled potatoes contain 85% starch (Quadram Institute Citation2019). U.S. newsprint (part of paper and paperboard category) contains 48.5% cellulose, 9% hemicellulose, and 24% lignin (Eleazer et al. Citation1997). On the other hand, office paper contains 80% cellulose, 10% hemicellulose, and 0% lignin (Castaldi et al. Citation2020). Bond paper and some paperboard contain 2% to 4% starch (Hofreiter Citation1980) as an additional constituent. Cotton (the major component in the textile subcategory) contains over 95% cellulose (Castaldi et al. Citation2020). Across wood species, carbohydrate composition varies. Poplar is on the high end of cellulose content at 50% cellulose, 25% hemicellulose, and 18% lignin (Davison et al. Citation2013). Pine bark is on the low end with 34% cellulose, 16% hemicellulose, and 34% lignin (Prakash and Karunanithi Citation2008). While the grass clippings part of yard waste contains 25–27% cellulose, 10–15% hemicellulose, and 22–28% lignin, leaves contain 15% cellulose, 11% hemicellulose, and 44% lignin (Eleazer et al. Citation1997). Collectively, cellulose, hemicellulose, lignin, and starch account for the bulk of dry plant-based biomass. Consistent with the prevalence of cellulose and lignin, this plant-based biomass is often referred to as lignocellulose or lignocellulosic materials (Balat Citation2011; Speight Citation2008). The observation that lignocellulosic materials account for 49% of MSW combusted in the U.S. indicates a decrease from the almost 65% noted by Helt and his coworkers in 1989 (Ahmed, Kumar, and Helt Citation1989). This decrease makes sense in light of the fraction of paper and paperboard combusted decreasing from 30% in 1990 to 13.2% in 2017 (EPA Citation2019b).
Synthetic polymers make up the other major fraction of municipal combustion feedstock. In descending order, the top three contributors to this category are the hydrocarbon plastics: polyethylene (high and low density), polypropylene, and polyester (i.e., polyethylene terephthalate or PET) (EPA Citation2019b). In this category, other components include polystyrene, polyisoprene, and polyvinyl chloride.
Overall, 74% of the MSW feed to waste-to-energy plants in the U.S. is composed of wet plant-based biomass and synthetic polymers. In simplest terms, the bulk of this MSW feed can be thought of as a wet mixture of lignocellulosic materials and synthetic polymers. Their thermal conversion in the fuel bed drives the composition of gases available for gas-phase combustion.
Thermal conversion
In over 90% of municipal waste-to-energy facilities globally, thermal conversion of the MSW takes place in a waste fuel bed on a mechanical grate (Castaldi and Themelis Citation2010). (The other major type of MSW combustion technology relies on a fluidized bed for this conversion (Leckner and Lind Citation2020/05).) As MSW moves along the grate, it is exposed to primary combustion air from below and radiation from above via the flame and walls (Leckner Citation2015). Consequently, thermal conversion proceeds through a series of four major steps: drying, devolatilization, char gasification, and char burning (Asthana et al. Citation2010/08; Swithenbank and Sharifi Citation2013). The main final products of this step-wise conversion are volatiles (i.e., vapors and gases) for combustion as well as bottom ash. Other than the heterogenous oxidation of carbonaceous char particles in the bed, combustion involves the homogeneous oxidation of volatiles evolved from the bed in the flame zone above the bed and continuing up into the furnace (Leckner Citation2015; Swithenbank and Sharifi Citation2013).
From a fuel perspective, MSW consists of water, volatile matter, fixed carbon, and non-combustibles (i.e., inorganics) (Tchobanoglous, Theisen, and Eliassen Citation1977). The first three undergo transformation in the fuel bed of a waste-to-energy plant. Water evaporates into steam. Beginning at about 260°C, volatile matter (primarily lignocellulosic materials and synthetic polymers) undergoes devolatilization, evolving gases (e.g., CO, CO2, H2) and hydrocarbon (CmHnOl) vapors (Yang et al. Citation2003/12). Concurrently, MSW solids undergo further radiative heating, ignite, burn vigorously, consume locally available oxygen, and form char (Goh et al. Citation1998, Citation2000/07). Consistent with the ignition temperature for paper (Williams Citation2003), Goh et al. (Citation1998) estimate MSW ignition temperature at roughly 320°C. In practice, MSW solids ignite over a range of temperatures because they are made up on different materials (Yang et al. Citation2004/05), and ignition temperature varies with moisture content and combustion air preheat temperature (van Blijderveen, Bramer, and Brem Citation2013/06). The devolatilized char undergoes gasification and combustion (Goh et al. Citation2000/07). Fixed carbon in the MSW and the residual char report to bottom ash with heavy non-combustibles. The unburned carbon content of bottom ash from modern MSW combustion is generally less than 2% (Spliethoff Citation2010). The remaining non-combustibles travel with the gases for later removal as fly ash. During devolatilization, heat-driven reactions release volatiles in both the presence and absence of oxygen (Fritsky, Miller, and Cernansky Citation1994/09). Pyrolysis occurs in localized areas where oxygen has been consumed. Hence, the process of devolatilization involves gasification, pyrolysis, and oxidation. Hydrogen is generated through the pyrolysis and gasification of lignocellulosic materials (Demirbas Citation2006/09; Hajaligol et al. Citation1982/07) and hydrocarbon plastics (Kaminsky Citation1985/04; Williams and Williams Citation1997) in MSW. Thermal conversion is shown schematically in .
Figure 3. Thermal conversion of municipal solid waste.Source: Adapted from Applied Energy, Vol 247, T. Gu, C. Yin, W. Ma, and G. Chen, Municipal solid waste incineration in a packed bed: A comprehensive modeling study with experimental validation, Page 130, Copyright 2019, with permission from Elsevier.
Measurements above the fuel bed
Gaining a quantitative understanding of the vapors and gases generated during thermal conversion starts with review of waste-to-energy plant data. Sampling and analysis of grate-fired commercial facilities has characterized gaseous species in the vicinity of the fuel bed. Over-bed measurements at a conventional 168 Mg day−1 reciprocating grate plant near Linköping, Sweden (Dos Santos and Collin Citation1992) included characterization of the 700–1000°C segment of the grate. Here, fuel bed devolatilization (3–4 m from inlet) results in dry-basis gas concentrations of 15–18% CO2, 10–18% CO, 6–16% H2, 1.8–2.2% methane (CH4), 0.7–1% ethylene (C2H4), and 0.5–1% O2 within 0.5 m above the bed. Dos Santos and Collin (Citation1992) observe that these high CO2 and low O2 concentrations reflect oxidative conditions in the bed and note the influence of the water-gas shift reaction (Equationequation 1(1)
(1) ) on the high observed H2 concentrations.
Measurements at a conventional 240 Mg day−1 reciprocating grate plant in Frankfurt, Germany (Waldner et al. Citation2013/02) indicate that the first half of the grate is dominated by drying and pyrolysis and that the second half is an air-rich zone for carbon burnout. Accordingly, the gases observed above the bed in the first half contain up to 40% H2O, 10% CO, and 5% H2 as well as CO2 and hydrocarbons. While molar composition values are not reported for CO2 and hydrocarbons, Gehrmann and his colleagues (Waldner et al. Citation2013/02) do note the absence of O2 in the gases above this drying and pyrolysis zone. Related modeling results (Simsek et al. Citation2009/08) suggest these concentrations correspond to above-bed temperatures between 500°C and 900°C and a gas concentration of 1% to 3% CH4.
Testing above the fuel bed of a 330 Mg day−1 reverse-reciprocating grate gasification-combustion plant in Tulsa, Oklahoma (Lusardi et al. Citation2014) indicates gasification stage dry-basis concentrations of 12.8% H2, 11.4% CO, and 3.7% CH4 along the centerline. Castaldi and his coworkers (Lusardi et al. Citation2014) attribute 2% O2 and 7% CO2 in the synthesis gas leaving the substoichiometric gasification zone to air bypassing along the walls. They also note that the gas temperature for this stage is 677°C or greater. Although not reported in these three studies, rapid heating rates on the order of 104–106°C min−1 are expected close to the reaction front in grate combustion of MSW (Mätzing et al. Citation2018/08). With an understanding of the relevant ranges for temperature (500–1000°C) and heating rates, prior studies on pyrolysis of the dominant lignocellulose fraction of MSW provide important information on the products of thermal conversion.
Lignocellulose pyrolysis and gasification
The products of lignocellulose pyrolysis and gasification have been extensively characterized. Rapid heating during primary pyrolysis favors the generation of volatiles, which may be converted further by secondary gas-phase reactions (Collard and Blin Citation2014/10). Including these secondary reactions, the most abundant volatile products of lignocellulose pyrolysis are CO, H2O, CH4, CO2, and H2 (Ranzi, Faravelli, and Manenti Citation2016). The three primary pyrolysis pathways are char formation, depolymerization, and fragmentation (Collard and Blin Citation2014/10). While CO, CH4, and H2 are the main volatile products of char formation reactions above 500°C, fragmentation of cellulose, hemicellulose, and lignin forms CO and CO2 as well. Levoglucosan is the main product of cellulose depolymerization and one of the main products of hemicellulose depolymerization (Collard and Blin Citation2014/10). At 600°C and a heating rate of 70°C/min, secondary reactions of levoglucosan yield 2% formaldehyde (CH2O) and 0.5% CH4 under an N2 atmosphere (Fukutome, Kawamoto, and Saka Citation2016). At the same temperature, increasing O2 concentration from 0% to 7% results in the methanol (CH3OH) yield increasing to 2% (an increase of 40 times relative to N2 atmosphere), surpassing the yields to CH2O and CH4. In the same study, CH4 yields from both levoglucosan and cellulose exceeded 9% in N2 at 900°C. Lignin fragmentation also produces CH2O and CH3OH among the main volatile products, and CH3OH is one of the main volatile products of hemicellulose fragmentation (Collard and Blin Citation2014/10). Formation of methanol via lignocellulose pyrolysis is not surprising because pyrolytic “destructive distillation” of wood was how methanol, also known as wood alcohol, was commercially produced in the early part of the 20th century (Frolich, Spalding, and Bacon Citation1928; Stiles Citation1977). Depending on temperature, fragmentation of methoxy (−OCH3) groups in lignin is seen as the common source of both CH3OH and CH4 (Collard and Blin Citation2014/10). The −OCH3 group on the 4-O-methylgluronic acid unit is also considered the precursor of the greater than 1% yield to methanol from hemicellulose between 510°C and 690°C (Shen, Gu, and Bridgwater Citation2010/03). Jegers and Klein (Citation1985) suggest that the methylol (−CH2OH) side groups in lignin are significant in methanol formation. The prevalence of −CH2OH side groups in cellulose (Speight Citation2008), hemicellulose (Ebringerová, Hromádková, and Heinze Citation2005), and starch (Sawyer and McCarty Citation1978) helps explain methanol formation more broadly.
Rapid pyrolysis experiments confirm the relative abundance of methanol produced by lignocellulose pyrolysis under conditions relevant to grate-fired waste-to-energy plants. At a heating rate of 1.8 × 10⁴ oC min−1, Funazukuri, Hudgins, and Silveston (Citation1987/01) reported a CH3OH yield from cellulose at 600°C on par with that of CH4. More recently, Norinaga and his coworkers found CH3OH yield from cellulose within a factor of 2 of those of CH4 and CO2 between 700°C and 800°C (Norinaga et al. Citation2013/01). Hajaligol et al. (Citation1982/07) detected the same trend for CH3OH and CH4 yields from cellulose between 800 and 1000°C with a heating rate of 6 × 10⁴°C min−1 and found that the CH3OH yield plateaued at 800°C, 200°C lower than the plateau for CH4 yield. Using the same experimental rig and heating rate, Nunn et al. (Citation1985/07) reported CH3OH yield from milled wood lignin within a factor of 2 relative to CH4 and CO2 between 727°C and 927°C, with the CH3OH yield from lignin being higher than that of CH4 at 527°C. Caballero et al. (Citation1993/12) observed the same trends during pyrolysis of Klason lignin (from almond shells) between 600°C and 800°C with heating rates greater than 1.2 × 10⁵°C min−1. Norinaga and his coworkers generally confirmed these results, finding CH3OH yields from lignin within a factor of 5 of those to CH4 and CO2 between 650°C and 750°C (Yang et al. Citation2015/07). Across these prior studies, yields to CO were much higher; and yields to H2 were comparable to or lower than the yield to CH3OH where reported. These studies also demonstrate that CH3OH is a major volatile product of lignocellulose pyrolysis under conditions expected during MSW thermal conversion along the grate.
Thermal conversion products
Adding to steam generated during drying and volatiles produced from pyrolysis and gasification of lignocellulose, devolatilization of synthetic polymers in MSW contributes significant levels of hydrocarbons. For example, Conesa et al. (Citation1994/11) reported CH4 and C2H4 yields from pyrolysis of high-density polyethylene (HDPE) of 3.1% and 15.1%, respectively, at 700°C with heating rates in the range of 1.2 × 10⁵°C min−1 to 1.6 × 10⁵ oC min−1. When the pyrolysis temperature was increased to 800°C and secondary reactions were also considered, the same research group (Font et al. Citation1995/04) observed CH4 and C2H4 yields from HDPE increased to 19.45% and 37.02%, respectively. During pyrolysis and gasification of plastics, further increases in temperature lead to higher H2 levels and lower levels of C2H4 and CH4 (Wu and Williams Citation2014). Hydrogen is generated by high-temperature thermal decomposition of C2H4 (Westbrook, Dryer, and Schug Citation1982/01) and steam reforming of CH4 (Wu and Williams Citation2014), as shown in Equationequation 2(2)
(2) (Pinto et al. Citation2003). As described in Equationequations 3
(3)
(3) and Equation4
(4)
(4) , char gasification produces additional CO and H2 (Asthana et al. Citation2010/08). Char burning generates CO2 and CO according to Equationequations 5
(5)
(5) and Equation6
(6)
(6) , respectively (Mätzing et al. Citation2018/08).
In light of (a) these transformations, (b) full-scale measurements, and (c) the products of lignocellulose pyrolysis, the major vapor-phase products of MSW thermal conversion are expected to be H2O, CO2, CO, H2, CH4, C2H4, and CH3OH in generally descending order. Except for H2 (not reported), García, Font, and Marcilla (Citation1992/05) confirmed this trend in their study of MSW pyrolysis with a heating rate of 2.5 × 10⁴°C min−1. Like the results of Yang et al. (Citation2015/07) for lignin pyrolysis, they observed a CH3OH yield from MSW at 700°C within a factor of 5 of the yield to CH4. The major volatile products above constitute the bulk of the reaction atmosphere for gas-phase combustion of minor species in MSW.
Gas-phase combustion
Gases and vapors that evolve from thermal conversion mix with secondary combustion air and burn in the gas phase above the fuel bed of a municipal waste-to-energy plant. In the gas-phase combustion zone (see ), the gas residence time is typically over 2 seconds at temperatures above 1000°C in excess air (Giraud, Taylor, and Huang Citation2021), and excess air levels can range from 50% to 200% (Chandler et al. Citation1997). At such elevated temperatures, hydrocarbons undergo high-temperature combustion (Warnatz Citation1984), organic molecules break down via chain-induced decomposition, carbon atoms bond to oxygen, and more free radicals are formed as the reactions proceed to completion (Tsang Citation1990/11). Recognizing molecular and radical species common to the oxidation of all hydrocarbons (e.g., H•, •OH), extensive kinetic models have been systematically developed, incorporating a wide range of species (e.g., H2, CH4, CH3OH, C2H4) (Westbrook and Dryer Citation1984/01). For methane (the most abundant hydrocarbon of the thermal conversion products), high-temperature combustion involves four interlinked chain reactions for oxidation of H2, CH4, CH2O, and CO (Lissianski, Zamansky, and Gardiner Citation2000). Overall, methane combustion proceeds through the sequence (Basevich Citation1987/01; Lissianski, Zamansky, and Gardiner Citation2000) depicted in Figure S1, where free radical species are framed by dashed lines.
These reactions begin in the free radical-rich flame zone above the bed and continue in the post-flame zone where flame-heated oxidative decomposition takes place (Lee and Huffman Citation1989). Lee and Huffman (Citation1987/01) found that in-flame hydrocarbon conversion is responsible for ≥90% of organic destruction with the post-flame zone accounting for the remainder. After hydrocarbons rapidly oxidize to CO in the flame zone, gas residence time in the post-flame zone allows the much slower oxidation of CO to CO2 to proceed to completion (Howard, Williams, and Fine Citation1973/01; Niessen Citation2010). Consequently, CO concentration is used as an indicator of combustion control for trace organic emissions (Kilgroe et al. Citation1990/11) and as a regulatory emission standard in the U.S. The CO emission standard for large grated-fired plants is 100 parts per million by volume (ppmv) corrected to 7% oxygen, dry basis (EPA Citation2006). As the plot of typical performance of a 363 Mg day−1 reciprocating grate plant in Spokane, WA in indicates, full-scale waste-to-energy plants generally operate at low levels well below the emission standard.
Figure 4. Typical CO emission performance for grate-fired waste-to-energy plant.Source: Plotted using full-scale waste-to-energy plant CO emission performance data provided by Kelle Vigeland of the City of Spokane.
The flames and product gases in the combustion zone above the bed radiate heat to the furnace walls, which in turn allows energy recovery in the form of steam (Zhang, Li, and Zhou Citation2016) and radiative heating of the fuel bed surface (Goh et al. Citation1998). As such, radiation is the predominant mode of heat transfer in full-scale combustion systems (Niessen Citation2010). The furnace shell enclosing combustion is made largely of silica-alumina refractory materials (Niessen Citation2010) and corrosion-resistant metals such as chromium-silicon-iron-nickel alloy tubing (Lee, Themelis, and Castaldi Citation2007/03). Following energy recovery and air pollution control, the combustion exhaust gas is continuously monitored prior to discharge to the atmosphere.
Gas monitoring
Continuous emission monitoring assures ongoing compliance with design and emission standards (Kilgroe et al. Citation1990/11). For example, furnace exit gas on-line monitoring has been a longstanding approach to measure O2 levels (Visalli Citation1987/12) used to control addition of secondary combustion air (El Asri and Baxter Citation2004). Oxygen is typically monitored with paramagnetic analyzers (Lee, Huffman, and Oberacker Citation1986/08). Emissions are monitored for CO to ensure compliance with applicable environmental regulations (EPA Citation2006, Citation2000). Continuous emission monitors (CEMs) are also used to track CO2 emissions for greenhouse gas reporting at large waste-to-energy plants (EPA Citation2009). For both CO and CO2, the standard approach is to monitor with nondispersive infrared (NDIR) photometers (Lee, Huffman, and Oberacker Citation1986/08). In each case, extractive sampling is generally used to convey the gas sample to the relevant emission analyzer (White Citation1991).
Produced by ABB, one of the leading suppliers of CEM technology globally (Bogue Citation2006), the Model EL 3020 EasyLine continuous gas analyzer (CGA) is a typical example of an extractive, rack-mounted CEM used at solid fuel combustion facilities. For example, common configurations for the EL 3020 either pair a paramagnetic analyzer for oxygen with an NDIR photometer for CO (Kristensen, Kristensen, and Rodrigues Citation2017) or with an NDIR photometer for CO2 (Ndibe et al. Citation2015/09/09). In either configuration (or with all three detectors combined), ABB (ABB Citation2005) notes that the EL 3020 is designed to operate with a gas flow of 30–90 L hr−1 (0.5–1.5 L min−1).
Design of model system
To represent full-scale waste-to-energy plant gas-phase behavior above the fuel bed, the design of the bench-scale model reactor focuses on the same four elements of a full-scale system described in the design basis section: feedstock, thermal conversion, gas-phase combustion, and gas monitoring. To ensure collection of representative exhaust gas samples for off-line trace analysis, the design also addresses a fifth element: exhaust gas sampling. conceptually illustrates the main components of the bench-scale model reactor system. The point of this design is to capture the essential chemistry affecting transformations in the combustion zone above the bed. This section presents each of the five design elements in turn. (Introduction of test material is described in the thermal conversion subsection).
Figure 5. Bench-scale model reactor system block flow diagram.
MSW surrogate
To elucidate the effect of the test material, it is essential to feed a consistent fuel with steady composition throughout the entire study as a surrogate for MSW (Marklund et al. Citation1990). In the 1990s, the common approach to preparing an MSW surrogate was to match the surrogate’s composition to the elemental (Wochele and Stucki Citation1999) or material (Wikström and Marklund Citation1998) composition of the relevant country’s MSW. More recently, biomass thermochemical conversion researchers (Mettler et al. Citation2012) have inspired focus on a surrogate that generates pyrolysis products relevant to the solids of interest. Since hydrocarbon plastics generally complete decomposition at higher temperatures than lignocellulose (García, Marcilla, and Font Citation1995/04; Williams and Besler Citation1992), pyrolyzing the polymer test material in the presence of a volatile product of lignocellulose pyrolysis would subject it to the same sort of reaction atmosphere experienced by synthetic polymers in full-scale waste-to-energy plants. As described in the design basis section, these volatiles include methane and methanol.
Methanol vapor is an effective surrogate for the volatiles produced by thermal conversion of the dominant lignocellulosic fraction of MSW. Methanol is one of the major volatile products of lignocellulose pyrolysis. Like the most abundant volatile hydrocarbon product (methane), methanol has a hydrogen to carbon ratio of 4:1. Moreover, high-temperature combustion of methanol follows the same conversion pathway as methane depicted in Figure S1 except that •CH2OH is the principal intermediate en route to CH2O rather than •CH3 (Liao et al. Citation2011; Lissianski, Zamansky, and Gardiner Citation2000). Importantly, using methanol maintains the focus on gas-phase combustion behavior because methanol flames do not form soot (McEnally and Pfefferle Citation2011/03). For an academic environmental engineering laboratory that relies on cylinders for gas supply, methanol is inherently safer (Bollinger et al. Citation1996) to work with than methane because the amount of methanol liquid needed during a set of experiments can be readily minimized. Delivery of methanol vapor is a key part of the thermal conversion component of the model reactor system.
Thermal conversion
In the bench-scale reactor system, thermal conversion is represented by pyrolysis and gasification of the test material in the presence of vaporized methanol premixed with air.
Delivery of methanol vapor
Assuring a representative reaction atmosphere starts with steady introduction of methanol vapor. In turn, maintaining a consistent flow of methanol vapor requires (1) a steady flow of liquid methanol and (2) reproducible, effective vaporization of the liquid.
As the piping and instrument diagram for the model system in shows, a syringe pump is used to supply methanol liquid. Specifically, a Model 100DX high-pressure Isco syringe pump with an ultra-high molecular weight polyethylene seal (Teledyne Isco, Lincoln, NE) is used to supply methanol liquid. This type of pump can provide steady flow free of pulsation (Simpson, Wei, and Sundaresan Citation1996; Woitalka, Kuhn, and Jensen Citation2014/09).
Figure 6. Piping & instrument diagram for bench-scale model reactor system.
Under excess air levels typical of full-scale waste-to-energy plants (see design basis section) and a total gas flow rate in the range of the commercial-scale extractive CEM (0.5–1.5 L min−1), the required methanol flow rate to the system is less than 100 µL min−1. Achieving such low methanol flow rates requires insulation and control of the pump cylinder head temperature to minimize temperature fluctuations that would interfere with pump performance at such low liquid flow rates (Teledyne Isco Citation2006). Accordingly, the methanol supply pump (Model 100DX) is outfitted with an Isco insulating cover and cooled to a fixed temperature (24°C) with a NESLAB RTE-7 D1 115/60 circulating water chiller (ThermoFisher, Newington, NH). Using anhydrous methanol (DriSolv® 100 mL bottle with septum cap, EMD Chemicals, Gibbstown, NJ), a steady flow of 61.71 µL min−1 has been attained by running in pressure control mode at 2400 psig (165.5 bar) through a 12.5 feet (3.81 m) length of 0.0025 inch (65 µm) ID PEEKTM capillary tubing.
Recognizing that vaporization rate is proportional to droplet size (Diemer et al. Citation1995), pneumatic atomization can be used to break the liquid up into fine droplets (Niessen Citation2010). Due to the low flows in this system, combustion air is used to effect atomization (instead of the independent atomization air used for liquid burners at full scale). This approach facilitates methanol-air mixing concurrent with methanol vaporization. Moreover, the low liquid flow rate requirement calls for the sort of nebulizer used to introduce samples to an inductively coupled plasma mass spectrometer (ICP-MS) for metals analysis (Montaser et al. Citation1998) rather than a traditional liquid fuel atomizer. However, even ICP-MS nebulizers are generally designed for liquid flow rates above 250 µL min−1 (Beauchemin Citation2020). Therefore, the model system employs a custom nebulizer. Borrowing from another part of analytical chemistry (liquid chromatography) (Woolf Citation1993), a commercial stainless steel post-column reaction mixing tee (Part # TCEF411C, Valco Instruments, Houston, TX) provides the body for the custom nebulizer. As Figure S2 illustrates, the post-column reaction tee has been modified to pass a partly sleeved length of 0.005 inch (130 µm) ID x 0.1 inch (2.54 mm) stainless steel capillary tubing through the throat for liquid flow and to create an annulus for air flow. This configuration resembles Golitizine’s nozzle design as depicted by Gretzinger and Marshall (Citation1961) in their study characterizing pneumatic atomization.
As Table S2 indicates, the nebulizer body is temperature controlled by Heat Zone 5 with heating tape (target 40°C). With a steady flow of liquid less than 100 µL min−1, atomization via this custom nebulizer with preheated air provides a steady flow of methanol vapor pre-mixed with air.
Also noted in Table S2, the air heater exit temperature is controlled by Heat Zone 4 with two band heaters (target 35°C) surrounding a length of split cylindrical stock that fits around the process tubing, and the nebulizer exit mixture flows through tubing that is temperature-controlled in the same way by Heat Zone 1 (target 100°C). Consistent with industrial laboratory reactor practice, heat transfer to small diameter tubing is facilitated through the use of metal (e.g., aluminum) stock clamped by band heaters around the tubing (Hickman Citation2020).
To further assure delivery of a well-mixed vapor/air mixture to the tubular reactor, the low flow rate (laminar flow) mixture next passes through a helical-element static mixer (Myers, Bakker, and Ryan Citation1997; Patterson et al. Citation2004), electrically heated to effectively function as a heater-mixer. The mixer is a Kenics ¼ inch (6.35 mm) O.D. stainless steel tube mixer with 27 elements (Chemineer, North Andover, MA), and its temperature is controlled by Heat Zone 2 (target 100°C). Upstream of the inlet to the tubular reactor, vapor/gas temperatures are maintained below the lower flammability limit for the target concentration of methanol in air.
The resulting methanol vapor/air mixture flows toward the tubular reactor, sweeping the products of test material pyrolysis and gasification into the reactor.
Pyrolysis and gasification of test material
Just like the thermal conversion process taking place in full-scale waste-to-energy plants, pyrolysis and gasification transform the test material into vapor to undergo gas-phase combustion in the model reactor system. To accomplish this, an analytical pyrolyzer with a resistive heating coil heats up a sample of the solid test material according to pre-set temperature programming (Moldoveanu Citation2019; Wampler Citation2006). Specifically, the sample solids in a small quartz tube are placed into the coil and then heated and gasified with a 1/4 -inch (6.35 mm) diameter CDS-2000 pyroprobe (CDS Analytical, Oxford, PA). Although traditionally connected by a low volume interface to a GC/MS with helium as sweep gas (Funazukuri, Hudgins, and Silveston Citation1986; Moldoveanu Citation2019), the pyroprobe in the model system introduces vapor into a tubular reactor akin to how Caballero, Font, and Marcilla (Citation1996/12) connected a CDS-1000 pyroprobe with a tubular laminar flow reactor for further pyrolysis. However, the methanol/air mixture sweeps the pyrolysis vapors into the inlet of the tubular reactor rather than helium so that the tubular laminar flow reactor in this system performs gas-phase combustion.
Funazukuri, Hudgins, and Silveston (Citation1986), García, Font, and Marcilla (Citation1992/05), and more recent studies, e.g., (Biagini, Lippi, and Tognotti Citation2006/12) have found significant discrepancies between the pyroprobe nominal heating rate and the measured actual heating rate. To minimize the impact of such discrepancies, use of this reactor system has included three provisions. First, sample tubes (cartridges) are the same length as the heating coil and open on both ends (without quartz wool). Second, test material pyrolysis is continued to a higher temperature than predicted by thermogravimetric analysis (TGA) or held for several minutes at the temperature corresponding to the final TGA weight loss asymptote. Third, the empty cartridge after pyrolysis is weighed after the experiment to confirm the absence of residue and thereby verify complete gasification.
Moldoveanu (Citation2010) reports very good reproducibility for CDS pyroprobes, especially when used to pyrolyze synthetic polymers (the planned use for the bench-scale model). Sablier and his coworkers (Ji et al. Citation2009/04) have confirmed that use of a CDS-2000 pyrolyzer can provide reproducible results when sample quantity and sampling loading technique are consistent. The procedures for use of this reactor system have been set accordingly to assure pyroprobe performance for one experiment is comparable to another.
As illustrates, the pyroprobe inserts into the reactor inlet through a ball valve. The ball valve permits steady-state methanol combustion to be demonstrated prior to introduction of the gasified test material, and this arrangement is designed to minimize disruption to methanol combustion upon pyroprobe insertion.
Gas-phase combustion
Like the gases above the fuel bed in grate-fired waste-to-energy plants, the vapor/air mixture entering the tubular reactor is radiatively heated. Reactor heating is provided by a horizontally oriented, bench-top, split-tube furnace (ThermCraft, Inc., Winston Salem, NC) described in Table S2. While this furnace can accommodate a larger diameter reactor tube as needed for a specific project, here it heats a 14 mm I.D. x 997 mm long quartz reactor tube with 2 mm thick walls (H.S. Martin, Vineland, NJ). Quartz is known to stand up to temperatures above 1100°C (Rubey and Carnes Citation1985) and to minimize activity toward potential surface reactions at the wall (Rasmussen et al. Citation2008; Sudholt, Cai, and Pitsch Citation2019/04). As such, the reactor walls resemble the enclosures of full-scale furnaces described in the design basis section. The temperature controller for each furnace zone operates on feedback from an imbedded thermocouple integral to the furnace. Due to the gap between the inside diameter of the furnace and the exterior of the reactor tube, specifying temperature controller setpoints requires correlating the controller readings with reactor tube temperature measurements; see the experimental section. Extending beyond the side walls of the furnace are the ½ inch (12.7 mm) O.D. ground quartz ends of the reactor. These ends are connected to the inlet and exit process tubing via Ultra-Torr fittings (Swagelok®, Solon, OH), equipped with S310 VMQ (silicone) O-rings (Freudenberg-NOK, Plymouth, MI) rated for 70 hours of continuous service at 260°C (Simrit Citation2007) to facilitate reactor tube change-out. Although the first and last 3 inch (7.62 cm) long sections inside the furnace are insulated and not radiatively heated, each is heated by conduction along the quartz tube. Conduction along the quartz tube also affects the temperature at the inlet and exit ground quartz ends of the tube as well as the metal tubing used for inlet and exit transfer lines (Heat Zones 6 and 7). A ceramic conduction shield inserted between Heat Zone 6 (100°C < target < 240°C) and Heat Zone 3 (target 100°C) reduces the temperature influence of the split tube furnace on upstream process tubing, minimizing the potential for methanol oxidation upstream of the reactor.
As the vapor/air mixture proceeds into the radiation-driven, conductively heated inlet of the reactor tube, it enters into the flammability region due to its rise in temperature and begins to react. While Lange’s Handbook (Lange and Dean Citation1979) reports the lower flammability limit (LFL) and upper flammability limit (UFL) for methanol in air at 25°C as 6.7 and 50%, respectively, these limits are influenced by temperature (Coward and Jones Citation1952). Observing an 8% decrease in LFL and an 8% increase in UFL as temperature increases each 100°C across a wide range of hydrocarbons, Bodurtha (Citation1980) provides Equationequations 7(7)
(7) and Equation8
(8)
(8) to show how the flammability limits (as volume %) change with temperature (T).
By 300°C (temperature at inlet to reactor), the LFL drops to 5.2%, indicating that a mixture containing 5.2% methanol in air is flammable. This concentration corresponds to 155% excess air for the target methanol injection rate noted previously, which is within the 50–200% range for full-scale waste-to-energy plants (see design basis section). The flow of the methanol/air mixture entering the reactor is laminar because it has a Reynolds number (Re) of 26. Between 360°C and 390°C, methanol begins to partially oxidize at atmospheric pressure, initially producing CH2O and CO (Bone and Gardner Citation1936). Initiation of the chain-induced decomposition of methanol under preflame conditions produces •HO2 radicals that go on to propagate the chain reaction (Aniolek and Wilk Citation1995/05; Bell, Tipper, and Bawn Citation1956).
Further heating of the flammable mixture brings on ignition and high-temperature combustion. At a temperature between 385°C (Zabetakis Citation1965) and 433.1 ± 8.7°C (Chen et al. Citation2010), the mixture ignites spontaneously in the absence of a spark or supplemental flame. As in the ASTM test method (ASTM Citation2015), ignition in the reactor tube occurs upon externally heating the premixed vapor/air to this autoignition temperature. In effect, radiation from the electrical furnace enclosing the reactor tube causes ignition, thereby simulating radiation above the fuel bed in full-scale plants (Mätzing et al. Citation2018/08). In the flame, ignition occurs at less than the autoignition temperature due to diffusion of free radicals upstream from the flame (Borman and Ragland Citation1998). The characteristic length of this laminar premixed flame is known as the flame thickness (δ), which can be estimated from the laminar flame velocity (SL) and thermal diffusivity (α) (Glassman, Yetter, and Glumac Citation2015; Williams Citation1985) using Equationequation 9(9)
(9) .
where α = λ/ρCp
Evaluating properties for combustion air as the unburned gas properties (Borman and Ragland Citation1998), the length of the flame zone in the reactor is estimated as flame thickness in Table S3. The calculated thickness (5 mm) is in the same range of flame thicknesses predicted by Westbrook and Dryer via detailed modeling with a methanol combustion mechanism involving 84 elementary reactions and 26 chemical species (Westbrook and Dryer Citation1979, Citation1980/01). The balance of the reactor serves as the post-flame zone. Overall, gas-phase combustion of methanol is described by Equationequation 10(10)
(10) .
During combustion in laminar flow, mixing is limited to molecular diffusion (Hottel and Hawthorne Citation1948/01). Specifically, the volatiles emanating from the pyroprobe are mixed with premixed methanol vapor/air via radial diffusion. The extent of such diffusion can be assessed by comparing the diffusion distance x in Equationequation 11(11)
(11) (Crank Citation1979) to the radial distance outward from the pyroprobe (r = 0.3175 cm) to the reactor wall (r = 0.70 cm).
where
D = diffusivity (cm2 sec−1)
t = time (sec)
Diffusivity between two species A and B can computed from Chapman-Enskog theory and the Lennard-Jones 12–6 potential via Equationequation 12(12)
(12) (Reid, Prausnitz, and Sherwood Citation1977; Sherwood, Pigford, and Wilke Citation1975).
where T = temperature (oK)
MA = molecular weight of species A
MB = molecular weight of species B
P = pressure (atm)
σ = Lennard-Jones characteristic length (Å)
ΩD = collision integral, dimensionless
Pyrolysis of the common fluorinated polymer PTFE yields gaseous difluorocarbene (Puts, Crouse, and Ameduri Citation2014) with a molecular weight of 50.01 g/mole. The diffusivity between difluorocarbene and air can be estimated by calculating the diffusivity between CO2 (molecular weight of 44.01 g/mole) and air based on their comparable molecular weights. Using the procedures and data compiled by Reid, Prausnitz, and Sherwood (Citation1977), the diffusivity between CO2 and air is calculated via Equationequation 12(12)
(12) to be 1.867 cm2 sec−1 at 1000°C. This value can be used to estimate the diffusivity between difluorocarbene pyrolysis gas and premixed methanol/air undergoing combustion. Solving Equationequation 11
(11)
(11) for time indicates that radial diffusion from the outer radius of the pyroprobe to the outer radius of the reactor tube (r1 – r2 = 0.3825 cm) occurs in less than 0.08 seconds. Since this is equivalent to less than 4% of a 2 second gas residence time at 1000°C, molecular diffusion is sufficient to provide radial mixing of the pyrolysis gas and the reacting premixed methanol/air. The combination of radial mixing and premixing assures adequate air-volatile mixing in this reactor system. Under these conditions, the organofluorine content of the PTFE pyrolysis gas is expected to transform to hydrogen fluoride (HF) consistent prior observation of HF as a thermodynamic end product of fluorocarbon combustion (Manion and Tsang Citation1997).
Process monitoring allows automatic control of the reactor. As noted in Table S3, the combustion air feed to the reactor is synthetic air composed of 79% nitrogen and 21% oxygen in cylinders (Airgas, Royal Oak, MI). A steady flow of synthetic air is measured and controlled by a Brooks Model 5850S mass flow controller with Buna-N seals (Brooks Instrument, Hatfield, PA) that reads out in standard cubic centimeters per minute (sccm) with standard conditions set at 21.1°C and 1 atmosphere. Flow measurement is accomplished by a thermal mass flow sensor (Kim, Han, and Kim Citation2007/03) integral to the mass flow controller. Five 1/8 inch (3.175 mm) O.D. Type K thermocouples of varying length (KQXL-18 U, Omega Engineering, Stamford, CT) are placed along the length of the reactor tube. As noted in , these thermocouples are designated T23, T24, T3, T25, and T30. T23 monitors the furnace temperature at the beginning of the first 6-inch (15.24 cm) long heated zone, 7.62 cm from the inlet of the furnace. T24 monitors the exterior wall temperature of the reactor tube at the midpoint of the inlet-end heated zone, 15.24 cm from the inlet of the furnace. T3 monitors the exterior wall temperature of the reactor tube at the midpoint of the 18-inch (45.72 cm) long middle heated zone (midpoint of the reactor), 45.72 cm from the inlet of the furnace. T25 monitors the exterior wall temperature of the reactor tube at the midpoint of the exit-end 15.24 cm long heated zone, 76.2 cm from the inlet of the furnace. T30 monitors the furnace temperature near the end of the exit-end heated zone, 81.28 cm from the inlet of the furnace (10.16 cm from the exit of the furnace). For the three thermocouples along the wall of the reactor tube (T24, T3, and T25), wire secures the thermocouple shielded by a ceramic protection tube (Omega Engineering, Stamford, CT) at the prescribed location. T23 and T30 were held in place by the 3 inches (7.62 cm) of insulation on the inlet- and exit-ends of the furnace, respectively. LabVIEW data acquisition equipment and software (National Instruments, Austin, TX) are used to continuously record flow rate and temperature data during each run. Additionally, a Florite (Valencia, CA) Model 990 M2C2 Universal Flow Controller is used to set and read gas flow rate values.
Gas monitoring
The exhaust gas exits the reactor through the heated Silcosteel® (Restek, Bellefonte, PA) outlet transfer line (Heat Zone 7, 200°C < target < 250°C), where the exit flow is split at a Silcosteel® reducing tee. The vast majority of the ~700 sccm exhaust gas flows out a stub slanted approximately 45 degrees downward, connected to flexible white silicone tubing (Part # 06411–71,Cole Parmer, Vernon Hills, IL) en route to the gas sampling apparatus described in the next section. Upon leaving the sampling apparatus, the gas flows to the CGA through flexible tubing with three tee fittings along the way. The first tee connects a thermocouple to monitor gas temperature exit the gas sampling apparatus. The second and third tees in series connect a needle valve (SS-1RS4, Swagelok®, Solon, OH) and a Magnehelic® standard low-pressure differential gauge (0–50 in. W.C., Dwyer Instruments, Michigan City, IN) for manual control to prevent pressure buildup downstream of the sampling apparatus by venting excess flow. The gas between the sampling apparatus and the first tee flows through white silicone tubing (Cole Parmer). Between the first tee and the barbed stainless steel fitting on the CGA, the gas flows through clear Tygon® tubing (Saint-Gobain, Malvern, PA) or amber latex rubber tubing (VWR, Radnor, PA) to maintain gas-tight connections. The lesser part of the split is a nominal flow of 1 sccm. This portion passes through a fused silica capillary through Heat Zone 8 (target 201°C) and into the GC oven set at 201°C (Tmax = 400°C, Model 5890, Hewlett-Packard, Inc., Palo Alto, CA) without chromatographic separation and into the mass selective detector (Model 5970B, Hewlett-Packard, Inc., Palo Alto, CA). As configured, the mass selective detector provides real-time monitoring of H2O, conceptually consistent with Curran’s measurement of H2O as a combustion diagnostic (Curran Citation2019b) and observes O2, CO2, and N2. Monitoring for these gases did not include a quartz wool packed cold trap. The target temperatures for Heat Zones 7 and 8 were set to prevent PFOA condensation in the exit transfer lines.
Primary real-time monitoring of exhaust gas composition relied on technology described in the design basis section, namely NDIR photometers for CO and CO2 and a paramagnetic analyzer for O2. In fact, this monitor was the same model CGA (EL 3020, ABB, Frankfurt, Germany) described previously, yet with the option to combine CO and CO2 measurement along with O2 monitoring in one instrument. ABB’s Uras26 modules measured CO and CO2, and Magnos206 module measured O2 (ABB Citation2005). Consistent with commercial practice at waste-to-energy plants, the exhaust gas was dried prior to the CGA (McCurdy Citation2001). Moisture was selectively removed from the exhaust gas just upstream of the instrument via a Ballston coalescing filter (Parker Hannifin, Lancaster, NY) and a Nafion® membrane dryer (Model DM-110-24, Perma Pure LLC, Toms River, NJ) commonly used for sample conditioning at full-scale plants (Clarke Citation1998a).
LabVIEW data acquisition equipment and software are used to continuously record CGA concentrations during each run. ChemStation (Agilent Technologies, Santa Clara, CA) software is used to record mass selective detector monitoring.
Gas sampling
Gas sampling design for pollutants of interest starts with an understanding of the available analytical methods (Ostaszewski Citation2019). Therefore, the gas sampling component of the model system was designed to capture PFOA into water because of the availability of trace-level LC/MS/MS analysis for PFO anion in this matrix (Larsen and Kaiser Citation2007; Risha et al. Citation2005/03). With the exception of the nominal 1 sccm flow to the mass selective detector noted previously, the entire exhaust gas flow from the reactor is routed to a set of glass impingers. The impingers are 30 mL midget impingers, commercially scaled down from larger Greenburg-Smith impingers (US Public Health Service Citation1944). They are like the ones used in EPA Method 26 (CitationEPA) non-isokinetic HF emission sampling at full-scale plants. While Method 26 notes a gas flow rate of 2 liters min−1, EPA has also demonstrated the suitability of midget impingers to sample hydrogen halides at gas flow rates between 0.5 and 1.0 L min−1 (Stern et al. Citation1984). Supplied by Kimble-Kontes (Vineland, NJ, Part 737550–0000), these graduated midget impingers feature a 1 mm orifice at the bottom of the dip tube (US Public Health Service Citation1944). The gas sampling apparatus consists of three midget impingers in series connected by flexible white silicone tubing (Cole Parmer). The first and second contain HPLC-grade water, consistent with the type of water used for solution makeup for trace analysis of PFOA (Berger et al. Citation2011/06). The third impinger is empty to capture any liquid carried over from the first two. While the bulk of the impinger solution is assigned to PFOA analysis, a small portion of high-temperature combustion testing impinger solution is set aside for fluoride ion analysis to determine the other main pollutant of interest, HF. Due to the potential effect of hydroxide on PFOA recovery (Zhang et al. Citation2013/06) and the lack of available method development studies to explore such effects, hydroxide is not added to the HPLC-water in the impingers. Nevertheless, water has been successfully used as an effective HF absorbent in industrial emission control (Kohl and Riesenfeld Citation1979) and in stack gas sampling (Clarke Citation1998b; Jacobson and Heifer Citation1976/11). In stack gas sampling, water-containing Greenburg-Smith impinger trains have been found to have high HF collection efficiencies (Jacobson and Heifer Citation1976/11), comparable to the fluoride collection efficiencies of impingers containing 0.1 N sodium hydroxide (Mitchell and Midgett Citation1976).
Experimental
Consistent with the general approach for evaluation of field instruments prior to deployment (Kerfoot et al. Citation1990/08), the performance of the model reactor system was characterized prior to routine use at planned experimental operating conditions. This sort of qualification testing is critical to assuring the equipment is “fit for purpose” (Burgess and Jones Citation1998).
Equipment calibration
As standardized measurements are necessary for reliable and reproducible results (Coleman et al. Citation2015), qualification testing began with calibration checks on key process instrumentation traceable to NIST standards at the beginning of each set of experiments. The factory calibration of the three Brooks mass flow controllers was confirmed using an ADM 2000 reference flowmeter (Agilent Technologies, Wilmington, DE). Beside the flow controller for synthetic air described previously, mass flow controllers of the same design are in place for nitrogen used for zero calibration of the CGA and the mass selective detector and for calibration gas used to span the CGA and mass selective detector. The CO2 span gas has a nominal concentration of 5.5% CO2 in N2. The gas used for span calibration of the CGA CO signal is nominally 900 ppmv CO in N2. The CGA and mass selective detector were calibrated at zero and span levels using certified cylinder gases (Airgas, Royal Oak, MI). The mass selective detector was calibrated for H2O via water injection through the reactor system using an Isco 260D syringe pump (Teledyne Isco, Lincoln, NE). Flow checks were performed for both this water supply pump and the Isco 100DX methanol supply pump to confirm acceptable pump flow accuracy. The KQXL-18 U thermocouples used to monitor reactor wall temperature in the furnace were Omega (Stamford, CT) special limits of error thermocouples.
Confirming representative behavior
While methanol can be fed continuously, pyrolysis and gasification via the pyroprobe is effectively a batch operation, requiring establishment of targets for test material mass and experimental run duration. Readable to 1 µg, the microbalance was capable of measuring 100 µg of test material loaded into a pyroprobe cartridge. Monitoring requirements for full-scale waste-to-energy plants (EPA Citation2018a) point to 15 minutes as a minimum run duration. With this as a minimum along with a typical European value for full-scale flue gas (prior to air pollution control) HF concentration of 10 mg Nm−3 (Kamuk Citation2009) in mind, a duration of 16 minutes corresponds to combustion of 100 µg of PTFE. Hence, 16 minutes was set as the run duration. With run duration set, TGA results for a test material provide the basis for pyroprobe temperature programming to assure continuous gasification of a nominal 100 µg batch of material over the course of the run.
Other high-temperature combustion test experimental conditions were based on the survey of combustion operating conditions at full-scale U.S. waste-to-energy plants (Giraud, Taylor, and Huang Citation2021) coupled with EPA-sponsored shutdown/startup testing at a 249.5 Mg day−1 reverse-reciprocating grate furnace near Salem, OR (EPA Citation1988) as follows: 2 seconds gas residence time at 1000°C with 13% oxygen (dry basis) and 10% water in the exhaust. These conditions can be achieved with a methanol feed rate of 61.71 µL min−1 and 155% excess air according to stoichiometric calculations for the reaction in Equationequation 10(10)
(10) .
Prior to beginning high-temperature experiments, the reactor was traversed with a certified, calibrated 121.92 cm long thermocouple (KQXL-18 U-48-CL5, Omega Engineering, Stamford, CT) coupled to a NIST traceable certified, calibrated thermocouple reader (CL23A, Omega Engineering) to measure gas temperature inside the reactor with synthetic air flowing at 660 sccm. Radiation-induced error in these gas temperature measurements was calculated to be less than 10°C based on the approach for thermocouple error analysis described by Carvalho and Dos Santos (Citation1990/09). Trial and error allowed determination of the furnace zone setpoints required to achieve 1000°C 10°C thermocouple readings over a long section of the reactor tube that defines the effective length of the target high-temperature zone for combustion testing. This effective length is used to confirm alignment with the gas residence time target. These readings also allow the continuously measured exterior wall temperatures to be related to actual gas temperature.
High-temperature experiments evaluated system performance during methanol combustion at the target operating conditions noted earlier in this section. The reactor feeds were anhydrous methanol as described in the system design section and synthetic air as described in Table S3. While the pyroprobe was inserted and heated during this testing, its cartridge was not loaded with test material solids.
Demonstrating PFOA collection efficiency
Qualification testing also determined the collection efficiency for transport across the bench-scale reactor system (under conditions similar to those planned for subsequent combustion testing) and absorption of PFOA into aqueous impingers. For this collection efficiency testing, the solid test material to be gasified was 99.8% purity PFOA (Oakwood Products, West Columbia, SC) instead of polymer, and the liquid to be injected and vaporized was HPLC-grade water (Alfa Aesar, Ward Hill, MA) rather than methanol. Water injection provided the nominal 10% concentration necessary to simulate the water of combustion. To achieve the oxygen concentration expected during high-temperature combustion testing, it was necessary to feed CEM calibration gas-grade nitrogen from certified cylinders (AirGas, Royal Oak, MI) as a diluent in addition to the synthetic air. This testing required operation at a temperature much lower than the combustion test setpoint to allow quantitative determination of PFOA by minimizing degradation. Prior NMR studies indicated that PFOA is thermally stable in vacuum at 300°C (Krusic, Marchione, and Roe Citation2005/12). Thermogravimetric analysis of PFOA in air at 10°C min−1 (Figure S3) indicates complete gasification by 150°C. Viewing these two values as bounds, the reactor midpoint temperature was set at 250°C for collection efficiency testing. The exit gas transfer line temperature was set slightly above 200°C to prevent potential loss of PFOA therein via condensation. Pyroprobe temperature programming was set to ensure complete gasification of a nominal 100 µg mass of PFOA during each experimental run across a 16-min run duration as follows: initial temperature = 100°C, heating rate = 10°C min−1, and final temperature = 215°C with a holding time of 4.5 minutes.
Collection efficiency testing was conducted across three replicate tests consistent with plans for high-temperature combustion testing and standard practices for performance tests at full-scale waste-to-energy plants (EPA Citation2018b). Prior to each experimental run, a thermal blank run was conducted. Following each experimental run (with PFOA in a pyroprobe cartridge) was a steam cleaning run, where nitrogen was used in place of air and where 50 mL of HPLC-grade water was injected into the reactor system over a 75-min period followed by a 20-min N2 purge. Post-run steam cleaning collected any PFOA that may have condensed in the reactor system. Except for the steam cleaning and the 250°C temperature noted above, the other conditions for collection efficiency testing (i.e., gas residence time, exhaust oxygen concentration, exhaust moisture level, and experimental run duration) were set at the levels planned for high-temperature combustion testing. During each of the three types of runs, reactor exhaust was collected in a set of three midget impingers located in a crushed ice bath. Except during steam cleaning, the first two impingers were pre-loaded with HPLC-grade water (Alfa Aesar, Ward Hill, MA). During steam cleaning, the impingers were initially empty in order to collect the condensed steam. The flexible white silicone tubing into the first impinger was rinsed with 5 mL of HPLC-grade water to collect potential condensate from this unheated line. The aqueous impinger samples from each run were weighed before and after addition of this rinsate. These aqueous samples were analyzed for PFOA by MPI Research (State College, PA) via LC/MS/MS based on the approach described by Risha and her coworkers (Citation2005/03). The limit of quantitation (LOQ) was 25 ng L−1, and the limit of detection was 5 ng L−1.
Results and discussion
illustrates the temperature profile measured along the length of the reactor tube of the bench-scale system with 660 sccm synthetic air flow as well as corresponding values for the three thermocouples along the wall of the reactor tube (T24, T3, and T25). These three continuously monitored wall temperatures are within 0.5% (5°C) of interior gas temperatures. In the direction of flow, the three furnace zone setpoints required to achieve this profile were 991°C, 977°C, and 987°C. Under these conditions, a gas residence time of 2 seconds is achieved over an effective length of 66 cm for this 14 mm I.D. laminar flow reactor. The shape of the curve in is comparable to the temperature profile of the laminar flow reactor used by García , Viciano, and Font (Citation2007; Esperanza, Font, and Garc‡a Citation2000) in fuel-rich combustion experiments and approximates the “square wave” temperature profile advocated by Rubey and Carnes (Citation1985) for precise control over gas residence time.
Figure 7. Temperature profile for reactor tube with 1000 °C target temperature.
describes bench-scale reactor system performance during high-temperature methanol combustion in terms of concentrations of O2, CO2, and CO in the exhaust gas. Once the flow of methanol vapor had stabilized, O2 and CO2 levels converged on 13% and 5.7%, respectively, as expected from combustion stoichiometry at 155% excess air. At this point, the ball valve was opened and the pyroprobe was inserted into the reactor, as evidenced by the slight O2 blip up and the slight CO2 dip down between 13 and 14 minutes along the x-axis in . Steady CO levels between 1 and 2 ppmv indicate stable and complete combustion. When put on a common 7% O2 basis, the average CO concentration (2.6 ppmv) corresponds favorably with the low end of the range for full-scale performance in .
Figure 8. Bench-scale reactor performance during methanol combustion.
As shows, the PFOA collection efficiency was greater than 90%. One-fifth of this efficiency can be attributed to the practice of steam cleaning after each experimental run. The observed efficiency represents a better than fourfold improvement in comparison to prior work (Yamada et al. Citation2005) and is consistent with the 70–130% general guideline for surrogate recovery in environmental analysis (Keith Citation1996).
Table 2. PFOA collection efficiency.
Blank analysis indicates the absence of background levels of PFOA in the experimental system. The results for pretest steam cleaning and for the first thermal blank in confirm that the reactor system as constructed did not contribute PFOA to the impinger samples. These findings demonstrate that specifying the seals on reactor system equipment (e.g., pumps and gas flow controllers) to be free of fluoropolymers prevented the sort of historical PFOA contamination associated with use of fluoropolymer parts in laboratory equipment (Martin et al. Citation2004). Additionally, analysis of reagent blanks (not tabulated) confirmed that the HPLC-grade water did not contain detectable PFOA.
Comparison of experimental results to waste-to-energy plant operation and design forms the basis for assessing the degree of similarity achieved in the design of model reactor system (Wochele and Stucki Citation1999). Thermal similarity across these two scales is supported by radiation-driven heat transfer as observed at full-scale (Niessen Citation2010). Use of the same gas monitoring technology for O2, CO2, and CO practiced at full-scale allows direct evaluation of chemical similarity. Chemical similarity is achieved in large part through the use of methanol as a surrogate for MSW. Chemical similarity is confirmed by comparison of CO performance between the full-scale plant in Spokane () and the bench-scale model when operated at temperature, gas residence time, and oxygen values representative of typical waste-to-energy facilities.
Conclusion
Material characterization of EPA’s 2017 MSW composition information indicates that lignocellulose accounts for roughly half of the annual feed to municipal waste-to-energy plants in the U.S. Review of prior studies shows that hydrogen-containing species such as hydrogen, methane, and methanol are expected as major volatile products of MSW thermal conversion in the fuel bed of municipal waste-to-energy plants. In the bench-scale system, methanol vapor is an effective surrogate for MSW because of its evolution during thermal conversion of MSW’s lignocellulose fraction at full-scale and its combustion along essentially the same conversion pathway as methane in the same temperature range. The representativeness of the reactor system is enhanced by assuring a flame zone and a post-flame zone. When operated at conditions representative of full-scale waste-to-energy plants (e.g., temperature, gas residence time), maintaining steady methanol vapor flow premixed with air to the model reactor system ensures stable combustion resulting in bench-scale CO emission levels comparable to those of full-scale plants. Additionally, molecular diffusion is sufficient to provide radial mixing of volatiles emanating from the pyroprobe with air under these conditions. Simply put, the bench-scale reactor system provides for the 3 Ts of combustion by design. Overall, operation of the bench-scale reactor effectively represents the gas-phase behavior above the fuel bed of full-scale waste-to-energy plants. High PFOA collection efficiency demonstrates that the reactor system is capable of transporting and absorbing PFOA that may be generated during high-temperature combustion testing of fluorinated polymers. Experiments for high-temperature testing should include post-run steam cleaning to prevent potential analyte loss, thereby ensuring collection of representative exhaust gas samples for off-line trace-level analysis. In summary, the bench-scale system is qualified for its intended use to investigate generation of PFOA from combustion of fluorinated polymers under conditions representative of full-scale waste-to-energy plants.
While the bench-scale reactor system described herein was designed to model municipal waste-to-energy combustion, the system can also be used to simulate other types of waste combustion across a wide range of solid organic materials. For example, by gasifying a polymer via the pyroprobe and injecting liquid solvent representative of hazardous waste, this system can be adapted to study hazardous waste incineration. Should such simulation require higher gas flow rates at combustion temperature, it would be important to match impinger sizing with gas flow and to compensate for radiation effects during gas temperature profiling. Use of additional exhaust gas monitoring instrumentation such as Fourier-transform infrared (FTIR) spectroscopy would extend the range of components sensed in real time.
Giraud_et_al_-_Design_and_qualification_of_a_bench-scale_model_-_Supplemental_Material.pdf
Download PDF (397.7 KB)Acknowledgment
The authors gratefully acknowledge Gary Foggin, Rich McKay, Rich Striebich, Tak Yamada, Larry Bonam, Troy Francisco, and Mike Peo for their guidance and assistance in the design of the reactor system and thank Kelle Vigeland of the City of Spokane for providing the full-scale CO emission performance data depicted in .
Disclosure statement
No potential conflict of interest was reported by the author(s).
Supplementary material
Supplemental data for this paper can be accessed on the publisher’s website
Additional information
Notes on contributors
Robert J. Giraud
Robert J. Giraud completed his doctoral research in environmental engineering at the University of Delaware in 2021 after serving over 30 years as an internal consultant to DuPont and Chemours in environmental engineering and green chemistry. He also teaches green engineering in the University of Delaware Department of Chemical & Biomolecular Engineering.
Philip H. Taylor
Philip H. Taylor founded PTaylor & Associates LLC in 2021 with 5 years of experience as Assistant Vice President of Research at the University of Cincinnati and 28 years of experience in waste combustion as a researcher and group leader in environmental engineering at the University of Dayton Research Institute.
R. Bertrum Diemer
R. Bertrum Diemer joined the faculty of the University of Delaware Department of Chemical & Biomolecular Engineering in 2014 after retiring from DuPont as an Engineering Fellow with over 30 years of service as an internal consultant in the general field of reaction engineering.
Chin-Pao Huang
Chin-Pao Huang holds appointments as the Donald C. Phillips Professor and Francis Alison Professor in the Department of Civil and Environmental Engineering at the University of Delaware in recognition for his over 50 years of research in the thermodynamics and kinetics of environmentally-relevant chemical processes.
References
- ABB. November 2005. Easy line continuous gas analyzers model EL3020 data sheet 10/24-4.10 EN. ABB Automation GmbH Analytical Division. Accessed September 1, 2020. https://library.e.abb.com/public/efd7afc56879d6b5c1257b0c0054673c/10-24-410-02-EN.pdf
- Ahmed, S., R. Kumar, and J. E. Helt. 1989. Computer simulation of a municipal solid waste combustor. JAPCA 39 (10):1328–33. doi:https://doi.org/10.1080/08940630.1989.10466627.
- Aleksandrov, K., H.-J. Gehrmann, M. Hauser, H. Mätzing, D. Pigeon, D. Stapf, and M. Wexler. 2019. Waste incineration of Polytetrafluoroethylene (PTFE) to evaluate potential formation of per- and Poly-Fluorinated Alkyl Substances (PFAS) in flue gas. Chemosphere 226:898–906. doi:https://doi.org/10.1016/j.chemosphere.2019.03.191.
- Aniolek, K. W., and R. D. Wilk. 1995/05. Preflame oxidation characteristics of methanol. Energy & Fuels 9(3):395–405. doi:https://doi.org/10.1021/ef00051a002.
- Aracil, I., R. Font, and J. A. Conesa. 2005. Semivolatile and volatile compounds from the pyrolysis and combustion of polyvinyl chloride. J Anal Appl Pyrolysis 74 (1–2):465–78. doi:https://doi.org/10.1016/j.jaap.2004.09.008.
- Asthana, A., Y. Ménard, P. Sessiecq, and F. Patisson. 2010/08. Modeling on-grate MSW incineration with experimental validation in a batch incinerator. Ind Eng Chem Res 49(16):7597–604. doi:https://doi.org/10.1021/ie100175e.
- ASTM E659-15, Standard Test Method for Autoignition Temperature of Chemicals. ASTM International, West Conshohocken, PA, 2015.
- Balat, M. 2011. Chapter 3 Fuels from biomass – Overview. In The Biofuels Handbook, ed. J. G. Speight, 76–117. Cambridge, UK: The Royal Society of Chemistry.
- Basevich, V. Y. 1987/01. Chemical kinetics in the combustion processes: A detailed kinetics mechanism and its implementation. Progress in Energy and Combustion Science 13(3):199–248. doi:https://doi.org/10.1016/0360-1285(87)90011-6.
- Beauchemin, D., Ed. 2020. Sample Introduction Systems in ICPMS and ICPOES. Amsterdam: Elsevier.
- Bell, K. M., C. F. H. Tipper, and C. E. H. Bawn. 1956. The slow combustion of methyl alcohol. A general investigation. Proc. R. Soc. Lond. A Math. Phys. Sci. 238 (1213):256–68. doi:https://doi.org/10.1098/rspa.1956.0218.
- Berger, U., M. A. Kaiser, A. Kärrman, J. L. Barber, and S. P. J. van Leeuwen. 2011/06. Recent developments in trace analysis of poly- and perfluoroalkyl substances. Anal Bioanal Chem 400(6):1625–35. doi:https://doi.org/10.1007/s00216-011-4823-8.
- Biagini, E., F. Lippi, and L. Tognotti. 2006/12. Characterization of a lab-scale platinum filament pyrolyzer for studying the fast devolatilization of solid fuels. Fuel 85(17–18):2408–18. doi:https://doi.org/10.1016/j.fuel.2006.06.002.
- Bodurtha, F. T. 1980. Industrial explosion prevention and protection. New York: McGraw-Hill.
- Bogue, R. W. 2006. Technology roadmap: Optoelectronic gas sensors in the petrochemicals, gas and water industries. OtpoCem.Net Consortium. Accessed August 29, 2020. https://www.researchgate.net/profile/Robert-Bogue-2/publication/228994463_Technology_roadmap_Optoelectronic_gas_sensors_in_the_petrochemicals_gas_and_water_industries/links/5423fe4c0cf26120b7a70d18/Technology-roadmap-Optoelectronic-gas-sensors-in-the-petrochemicals-gas-and-water-industries.pdf
- Bollinger, R. E., D. G. Clark, A. M. Dowell III, R. M. Ewbank, D. C. Hendershot, W. K. Lutz, S. I. Meszaros, D. E. Park, E. D. Wixom, and D. A. Crowl, Eds. Inherently safer chemical processes: A life cycle approach (A CCPS concept book). New York: Center for Chemical Process Safety of the American Institute of Chemical Engineers, 1996.
- Bone, W. A., and J. B. Gardner. 1936. Comparative studies of the slow combustion of methane, methyl alcohol, formaldehyde, and formic acid. Proc. R. Soc. Lond. A Math. Phys. Sci. 154 (882):297–328. doi:https://doi.org/10.1098/rspa.1936.0052.
- Borman, G. L., and K. W. Ragland. 1998. Combustion engineering. Boston: McGraw-Hill.
- Brunner, C. R. 1985. Estimating incinerator emissions. In Hazardous air emissions from incineration, 108–22. New York: Chapman and Hall.
- Buck, R. C., J. Franklin, U. Berger, J. M. Conder, I. T. Cousins, P. de Voogt, A. A. Jensen, K. Kannan, S. A. Mabury, S. P. van Leeuwen, et al. 2011. Perfluoroalkyl and polyfluoroalkyl substances in the environment: Terminology, classification, and origins. Integr Environ Assess Manag 7 (4):513–41. doi:https://doi.org/10.1002/ieam.258.
- Burgess, C., and D. G. Jones. 1998. Equipment qualification for demonstrating the fitness for purpose of analytical instrumentation. The Analyst 123 (9):1879–86. doi:https://doi.org/10.1039/A804670K.
- Caballero, J. A., R. Font, and A. Marcilla. 1996/12. Kinetic study of the secondary thermal decomposition of Kraft lignin. J Anal Appl Pyrolysis 38(1–2):131–52. doi:https://doi.org/10.1016/S0165-2370(96)00953-9.
- Caballero, J. A., R. Font, A. Marcilla, and A. N. García. 1993/12. Flash pyrolysis of Klason lignin in a Pyroprobe 1000. J Anal Appl Pyrolysis. 27 (2): 221–44. doi:https://doi.org/10.1016/0165-2370(93)80011-N.
- Carberry, J. J. 1964. Designing laboratory catalytic reactors. Ind Eng Chem 56 (11):39–46. doi:https://doi.org/10.1021/ie50659a007.
- Carnes, R. A., and B. Dellinger. 1987. A correlation of emissions from laboratory and pilot scale thermal decomposition of an organic compound mixture. Toxicol Environ Chem 14 (4):307–20. doi:https://doi.org/10.1080/02772248709357214.
- Carroll, G. J., R. C. Thurnau, J. W. Lee, L. R. Waterland, B. Dellinger, and P. H. Taylor. 1992. Pilot-scale evaluation of an incinerability ranking system for hazardous organic compounds. J. Air Waste Manage. Assoc. 42 (11):1430–36. doi:https://doi.org/10.1080/10473289.1992.10467089.
- Carvalho, J. A., and W. F. N. Dos Santos. 1990/09. Radiation errors in temperature measurements with thermocouples in a cylindrical combustor. International Communications in Heat and Mass Transfer 17(5):663–73. doi:https://doi.org/10.1016/0735-1933(90)90014-B.
- Castaldi, M. J., Y. Chi, S. Ciuta, J. Dong, P. He, N. Lyczko, A. Nzihou, and F. Wang. 2020. Municipal solid waste. In Handbook on characterization of biomass, biowaste and related by-products, ed. A. Nzihou, 731–840. Cham, Switzerland: Springer International Publishing.
- Castaldi, M. J., and N. J. Themelis. March 01 2010. The case for increasing the global capacity for waste to energy (WTE). Waste and Biomass Valorization 1 (1):91–105. doi:https://doi.org/10.1007/s12649-010-9010-1.
- Chandler, A. J., T. T. Eighmy, J. Hartlén, O. Hjelmar, D. S. Kosson, S. E. Sawell, H. A. van der Sloot, and J. Vehlow. “Chapter 3 - Municipal solid waste incineration technologies,” In Municipal solid waste incinerator residues (Studies in Environmental Science 67). Amsterdam: Elsevier, 1997, pp. 59–95.
- Chen, C.-C., H.-J. Liaw, C.-M. Shu, and Y.-C. Hsieh. 2010. Autoignition temperature data for methanol, ethanol, propanol, 2-butanol, 1-butanol, and 2-methyl-2,4-pentanediol. J Chem Eng Data 55 (11):5059–64. doi:https://doi.org/10.1021/je100619p.
- Clarke, A. G. 1998a. Gas sampling and conditioning. In Industrial air pollution monitoring, ed. A. G. Clarke, 81–99. Dordrecht: Springer Netherlands.
- Clarke, A. G. 1998b. Batch sampling and wet chemical methods of gas analysis. In Industrial air pollution monitoring, ed. A. G. Clarke, 100–19. Dordrecht: Springer Netherlands.
- Coleman, M. D., S. Render, C. Dimopoulos, A. Lilley, R. A. Robinson, T. O. M. Smith, R. Camm, and R. Standring. 2015. “Testing equivalency of an alternative method based on portable FTIR to the European standard reference methods for monitoring emissions to air of CO, NO x, SO 2, HCl, and H 2 O,” J. Air Waste Manage. Assoc. 65 (8):1011–19. doi: https://doi.org/10.1080/10962247.2015.1058868.
- Collard, F.-X., and J. Blin. 2014/10. A review on pyrolysis of biomass constituents: Mechanisms and composition of the products obtained from the conversion of cellulose, hemicelluloses and lignin. Renewable and Sustainable Energy Reviews 38:594–608. doi:https://doi.org/10.1016/j.rser.2014.06.013.
- Conesa, J. A., R. Font, A. Marcilla, and A. N. García. 1994/11. Pyrolysis of polyethylene in a fluidized bed reactor. Energy & Fuels 8(6):1238–46. doi:https://doi.org/10.1021/ef00048a012.
- Corey, R. C., L. A. Spanct, C. H. Schwartz, and H. Perry. 1953. Experimental study of effects of tangential overfire air on the incineration of combustible wastes. Air Repair 3 (2):109–16. doi:https://doi.org/10.1080/00966665.1953.10467597.
- Coward, H. F., and G. W. Jones. 1952. Limits of flammability of gases and vapors. Washington, D.C.: U.S. Department of the Interior, Bureau of Mines. Bureau of Mines Bulletin 503.
- Crank, J. 1979. The mathematics of diffusion. 2d ed. Oxford, UK: Clarendon Press.
- Curran, H. J. 2019a. Developing detailed chemical kinetic mechanisms for fuel combustion. Proceedings of the Combustion Institute 37 (1):57–81. doi:https://doi.org/10.1016/j.proci.2018.06.054.
- Curran, H. J. 2019b. Combustion chemistry and modeling lecture notes: Basic chemical kinetic principles I. Princeton-Combustion Institute Summer School on Combustion. Accessed August 29, 2020. https://cefrc.princeton.edu/sites/cefrc/files/day2_curran.pdf
- Davison, B. H., J. Parks, M. F. Davis, and B. S. Donohoe. 2013. Plant cell walls: Basics of structure, chemistry, accessibility and the influence on conversion. In Aqueous Pretreatment of Plant Biomass for Biological and Chemical Conversion to Fuels and Chemicals, ed. C. E. Wyman, 23–38. Chichester, UK: John Wiley & Sons.
- Dellinger, B., P. H. Taylor, and C. C. Lee. 1993. Full-scale evaluation of the thermal stability-based hazardous organic waste incinerability ranking. Air & Waste 43 (2):203–07. doi:https://doi.org/10.1080/1073161X.1993.10467126.
- Demirbas, M. F. 2006/09. Hydrogen from various biomass species via pyrolysis and steam gasification processes. Energy Sources, Part A: Recovery, Utilization, and Environmental Effects 28(3):245–52. doi:https://doi.org/10.1080/009083190890003.
- Diemer, R. B., T. D. Ellis, G. D. Silcox, J. S. Lighty, and D. W. Pershing. 1995. Incinerators. In Kirk‐Othmer Encyclopedia of Chemical Technology, ed. J. Kroschwitz and M. Howe-Grant, vol. 14, 86–122. New York: John Wiley & Sons.
- Dos Santos, A. M., and R. Collin, “Study of a MSW incinerator: Overall operation and on-site measurements over the grate,” in Proceedings of the 1992 National Waste Processing Conference, Detroit, 1992: American Society of Mechanical Engineers, pp. 133–43.
- Ebringerová, A., Z. Hromádková, and T. Heinze. 2005. Hemicellulose. In Polysaccharides I: Structure, Characterization and Use, ed. T. Heinze, 1–67. Berlin, Heidelberg: Springer.
- El Asri, R., and D. Baxter. 2004. Process control in municipal solid waste incinerators: Survey and assessment. Waste Management & Research: The Journal for a Sustainable Circular Economy 22 (3):177–85. doi:https://doi.org/10.1177/0734242x04044352.
- Eleazer, W. E., W. S. Odle, Y.-S. Wang, and M. A. Barlaz. 1997. Biodegradability of municipal solid waste components in laboratory-scale landfills. Environ. Sci. Technol. 31 (3):911–17. doi:https://doi.org/10.1021/es9606788.
- EPA. Emission guidelines for small municipal waste combustion units (65 Federal Register 76378). December 6, 2000.
- EPA. Method 26: Determination of hydrogen halide and halogen emissions from stationary sources non-isokinetic method. 40 CFR 60 Appendix A, 2019.
- EPA. Municipal waste combustion multipollutant study summary report: Marion County solid waste-to-energy Ogden Martin Systems of Marion, Inc. Brooks, Oregon. EMB Report 86-MIN-03A. EPA Office of Air Quality Planning and Standards, Research Triangle Park, NC, 1988.
- EPA. 1995. Compilation of air pollutant emission factors (AP-42), 5th ed. (EPA Office of Air Quality Planning and Standards). Research Triangle Park, NC: U.S. Environmental Protection Agency.
- EPA. 2006. Standards of performance for new stationary sources and emission guidelines for existing sources: Large municipal waste combustors. Federal Register 71:27324–48.
- EPA. 2009. Mandatory greenhouse gas reporting rule: EPA’s response to public comments, volume no. 15: Subpart C - general stationary fuel combustion sources, Washington, DC: EPA Office of Atmosphere Programs, Climate Change Division. Accessed August 25, 2020. https://www.epa.gov/sites/production/files/2015-02/documents/subpartc-rtc.pdf
- EPA. 40 CFR 60.13 monitoring requirements. Washington, D.C, 2018a.
- EPA. 40 CFR 60.8 performance tests. Washington, DC, 2018b.
- EPA. 2019a. Advancing sustainable materials management: 2017 fact sheet. Accessed April 23, 2020. https://www.epa.gov/sites/production/files/2019-11/documents/2017_facts_and_figures_fact_sheet_final.pdf
- EPA. 2019b. Advancing sustainable materials management: 2016 and 2017 tables and figures. Accessed April 23, 2020. https://www.epa.gov/sites/production/files/2019-11/documents/2016_and_2017_facts_and_figures_data_tables_0.pdf
- Esperanza, M. M., R. Font, and A. N. Garc‡a. 2000. Toxic byproducts from the combustion of varnish wastes based on polyurethane in a laboratory furnace. J. Hazard. Mater. 77 (1–3):107–21. doi:https://doi.org/10.1016/S0304-3894(00)00182-5.
- Fängmark, I., S. Marklund, C. Rappe, B. Strömberg, and N. Berge. 1991. Use of a synthetic refuse in a pilot combustion system for optimizing dioxin emission, part II. Chemosphere 23 (8–10):1233–43. doi:https://doi.org/10.1016/0045-6535(91)90148-7.
- Font, R., A. Marcilla, A. N. García, J. A. Caballero, and J. A. Conesa. 1995/04. Comparison between the pyrolysis products obtained from different organic wastes at high temperatures. J Anal Appl Pyrolysis 32 /01/:41–49. doi:https://doi.org/10.1016/0165-2370(94)00835-O.
- Fritsky, K. J., D. L. Miller, and N. P. Cernansky. 1994/09. Methodology for modeling the devolatilization of refuse-derived fuel from thermogravimetric analysis of municipal solid waste components. Air & Waste 44(9):1116–23. /01. doi:https://doi.org/10.1080/10473289.1994.10467308.
- Frolich, P. K., H. B. Spalding, and T. S. Bacon. 1928. Destructive distillation of wood and cellulose under pressure. Ind Eng Chem 20 (1):36–40. doi:https://doi.org/10.1021/ie50217a019.
- Froment, G. F. 1981. Thermal cracking for olefins production. Fundamentals and their application to industrial problems. Chem Eng Sci 36 (8):1271–82. doi:https://doi.org/10.1016/0009-2509(81)80161-3.
- Fukutome, A., H. Kawamoto, and S. Saka. 2016. Molecular mechanisms for the gas-phase conversion of intermediates during cellulose gasification under nitrogen and oxygen/nitrogen. Chemical Industry and Chemical Engineering Quarterly 22 (4):343–53. doi:https://doi.org/10.2298/CICEQ160325018F.
- Funazukuri, T., R. R. Hudgins, and P. L. Silveston. 1986. Correlation of volatile products from fast cellulose pyrolysis. Industrial & Engineering Chemistry Process Design and Development 25 (1):172–81. doi:https://doi.org/10.1021/i200032a027.
- Funazukuri, T., R. R. Hudgins, and P. L. Silveston. 1987/01. Product distribution for flash pyrolysis of cellulose in a coil pyrolyzer. J Anal Appl Pyrolysis 10(3):225–49. doi:https://doi.org/10.1016/0165-2370(87)80005-0.
- García, A. N., R. Font, and A. Marcilla. 1992/05. Kinetic studies of the primary pyrolysis of municipal solid waste in a Pyroprobe 1000. J Anal Appl Pyrolysis 23(1):99–119. doi:https://doi.org/10.1016/0165-2370(92)80016-F.
- García, A. N., A. Marcilla, and R. Font. 1995/04. Thermogravimetric kinetic study of the pyrolysis of municipal solid waste. Thermochim Acta 254:277–304. doi:https://doi.org/10.1016/0040-6031(94)02002-6.
- García, A. N., N. Viciano, and R. Font. 2007. Products obtained in the fuel-rich combustion of PTFE at high temperature. J Anal Appl Pyrolysis 80 (1):85–91. doi:https://doi.org/10.1016/j.jaap.2007.01.004.
- Giraud, R. J., P. H. Taylor, and C.-P. Huang. 2021. Combustion operating conditions for municipal Waste-to-Energy facilities in the U.S. Waste Management 132:124–32. doi:https://doi.org/10.1016/j.wasman.2021.07.015.
- Glassman, I., R. A. Yetter, and N. G. Glumac. 2015. Combustion. 5th ed. Waltham, MA: Academic Press.
- Goh, Y. R., R. G. Siddall, V. Nasserzadeh, R. Zakaria, J. Swithenbank, Lawrence, N. Garrod, and B. Jones. 1998. Mathematical modelling of the burning bed of a waste incinerator. J. Inst. Energy 71 (487):110–18.
- Goh, Y. R., Y. B. Yang, J. Goodfellow, R. Zakaria, C. N. Lim, K. H. Chan, G. Reynolds, R. G. Siddall, V. Nasserzadeh, J. Swithenbank, “Energy from waste: Current research and development in municipal waste incineration at Sheffield University waste incineration centre (SUWIC),” International Journal of Ambient Energy, vol. 21, no. 3, pp. 149–60, 2000/07/01, 2000. doi: https://doi.org/10.1080/01430750.2000.9675367.
- Graham, J. L., J. M. Berman, and B. Dellinger. 1993. High-temperature thermal—photolytic oxidation of monochlorobenzene. J Photochem Photobiol A Chem 71(1):65–74. doi. doi:https://doi.org/10.1016/1010-6030(93)87011-B.
- Gretzinger, J., and W. R. Marshall Jr. 1961. Characteristics of pneumatic atomization. AIChE J. 7 (2):312–18. doi:https://doi.org/10.1002/aic.690070229.
- Hajaligol, M. R., J. B. Howard, J. P. Longwell, and W. A. Peters. 1982/07. Product compositions and kinetics for rapid pyrolysis of cellulose. Industrial & Engineering Chemistry Process Design and Development 21(3):457–65. doi:https://doi.org/10.1021/i200018a019.
- Hickman, D. A., “Right-sizing lab fixed bed reactors for gas-solid Systems (webinar),” American Institute of Chemical Engineers, https://www.aiche.org/academy/webinars/right-sizing-lab-fixed-bed-reactors-gas-solid-systems, March 18, 2020.
- Hofreiter, B. T. 1980. Natural products for wet-end addition. In Pulp and paper chemistry and chemical technology, ed. J. P. Casey, ch. 14, vol. 3, 3rd ed., 1475–514. New York: John Wiley & Sons.
- Hottel, H. C., and W. R. Hawthorne. 1948/01. Diffusion in laminar flame jets. Symposium on Combustion and Flame, and Explosion Phenomena 3(1):254–66. doi:https://doi.org/10.1016/S1062-2896(49)80034-1.
- Howard, J. B., G. C. Williams, and D. H. Fine. 1973/01. Kinetics of carbon monoxide oxidation in postflame gases. Symposium (International) on Combustion 14(1):975–86. doi:https://doi.org/10.1016/S0082-0784(73)80089-X.
- Jacobson, J. S., and L. I. Heifer. 1976/11. Evaluation of probes used for source sampling of hydrogen fluoride. J. Air Pollut. Control Assoc. 26(11):1065–68. doi:https://doi.org/10.1080/00022470.1976.10470361.
- Jahnke, A., and U. Berger. 2009. Trace analysis of per- and polyfluorinated alkyl substances in various matrices—How do current methods perform? J. Chromatogr. A 1216 (3):410–21. doi:https://doi.org/10.1016/j.chroma.2008.08.098.
- Jegers, H. E., and M. T. Klein. 1985. Primary and secondary lignin pyrolysis reaction pathways. Industrial & Engineering Chemistry Process Design and Development 24 (1):173–83. doi:https://doi.org/10.1021/i200028a030.
- Ji, L., L. P. Riana, M. Sablier, and J. Vial. 2009/04. Precision of flash pyrolysis-GC-MS analysis: Experimental evaluation of the sources of variability. Chromatographia 69(7–8):691–99. doi:https://doi.org/10.1365/s10337-009-0965-7.
- Johnstone, R. E., and M. W. Thring. 1957. Pilot plants, models, and scale-up methods in chemical engineering. (McGraw-Hill Series in Chemical Engineering). New York: McGraw-Hill.
- Kaminsky, W. 1985/04. Thermal recycling of polymers. J Anal Appl Pyrolysis 8:439–48. doi:https://doi.org/10.1016/0165-2370(85)80042-5.
- Kamuk, B., “Is De-NOx by SCR to Be the future in US?: Technology and tendencies within APC-equipment,” in Proceedings of the 17th Annual North American Waste-to-Energy Conference, Chantilly, VA, 2009: American Society of Mechanical Engineers, pp. 77–82, doi: https://doi.org/10.1115/NAWTEC17-2364.
- Kedrowski, C., and P. Chromec. 2013. Hitachi Zosen Inova technology. In Renewable energy systems, ed. M. Kaltschmitt, N. J. Themelis, L. Y. Bronicki, L. Söder, and L. A. Vega, 1060–99. New York: Springer.
- Keith, L. H. 1996. Compilation of EPA’s sampling and analysis methods. Boca Raton: CRC/Lewis Publishers.
- Kerfoot, H. B., S. L. Pierett, E. N. Amick, D. W. Bottrell, and J. D. Petty. 1990/08. Analytical performance of four portable gas chromatographs under field conditions. J. Air Waste Manage. Assoc. 40(8):1106–13. doi:https://doi.org/10.1080/10473289.1990.10466755.
- Kilgroe, J. D., L. Patrick Nelson, P. J. Schindler, and W. Steven Lanier. 1990/11. Combustion control of organic emissions from municipal waste combustors. Combustion Science and Technology 74(1–6):223–44. doi:https://doi.org/10.1080/00102209008951690.
- Kim, D.-K., I. Y. Han, and S. J. Kim. 2007/03. Study on the steady-state characteristics of the sensor tube of a thermal mass flow meter. Int J Heat Mass Transf 50(5–6):1206–11. doi:https://doi.org/10.1016/j.ijheatmasstransfer.2006.08.021.
- Kohl, A. L., and F. C. Riesenfeld. 1979. Gas purification. 3rd ed. Houston: Gulf Publishing Company Book Division.
- Kristensen, E., J. Kristensen, and A. Rodrigues. 2017. Evaluation of an operation of burning of wheat straw batches in a pilot scale facility in Denmark. Silva Lusitana 25 (1):31–49.
- Krusic, P. J., A. A. Marchione, and D. C. Roe. 2005/12. Gas-phase NMR studies of the thermolysis of perfluorooctanoic acid. J Fluor Chem 126(11–12):1510–16. doi:https://doi.org/10.1016/j.jfluchem.2005.08.016.
- Lange, N. A., and J. A. Dean. 1979. Lange’s handbook of chemistry. 12th ed. New York: McGraw-Hill.
- Larsen, B. S., and M. A. Kaiser. 2007. Challenges in perfluorocarboxylic acid measurements. Anal. Chem. 79 (11):3966–73. doi:https://doi.org/10.1021/ac071918c.
- Leckner, B. 2015. Process aspects in combustion and gasification waste-to-energy (WtE) units. Waste Management 37:13–25. doi:https://doi.org/10.1016/j.wasman.2014.04.019.
- Leckner, B., and F. Lind. 2020/05. Combustion of municipal solid waste in fluidized bed or on grate – A comparison. Waste Management 109:94–108. doi:https://doi.org/10.1016/j.wasman.2020.04.050
- Leckner, B., P. Szentannai, and F. Winter. 2011. Scale-up of fluidized-bed combustion – A review. Fuel 90 (10):2951–64. doi:https://doi.org/10.1016/j.fuel.2011.04.038.
- Lee, K. C., L. G. Doucet, B. Dellinger, E. R. Altwicker, and E. T. Opelt. 1987. Incineration of hazardous waste: Critical review discussion papers. JAPCA 37 (9):1011–24. doi:https://doi.org/10.1080/08940630.1987.10466291.
- Lee, C. C., and G. L. Huffman. 1987/01. EPA’s pilot-scale research in hazardous waste thermal destruction. Waste Management & Research 5(1):67–71. doi:https://doi.org/10.1016/0734-242X(87)90035-8.
- Lee, C. C., and G. L. Huffman. 1989. Incineration of solid waste. Environmental Progress 8 (3):143–51. doi:https://doi.org/10.1002/ep.3300080312.
- Lee, C. C., G. L. Huffman, and D. A. Oberacker. 1986/08. An overview of hazardous/toxic waste incineration. J. Air Pollut. Control Assoc. 36(8):922–31. doi:https://doi.org/10.1080/00022470.1986.10466132.
- Lee, S.-H., N. J. Themelis, and M. J. Castaldi. 2007/03. High-temperature corrosion in waste-to-energy boilers. Journal of Thermal Spray Technology 16(1):104–10. doi:https://doi.org/10.1007/s11666-006-9005-4.
- Lemieux, P., M. Strynar, D. Tabor, J. Wood, M. Cooke, B. Rayfield, and P. Kariher. Emissions of fluorinated compounds from the combustion of carpeting. In International Conference on Incineration and Thermal Treatment Technologies, IT3, Phoenix, Arizona, 2007.
- Liao, S.-Y., H.-M. Li, L. Mi, X.-H. Shi, G. Wang, Q. Cheng, and C. Yuan. 2011. Development and validation of a reduced chemical kinetic model for methanol oxidation. Energy & Fuels, 25 (1): 60–71. doi:https://doi.org/10.1021/ef101335q.
- Lin, C., T. C. Wu, and S. E. Liu. 1997. Correlation between the combustion performance indices and the products of incomplete combustion (PICs) in a laboratory scale incinerator. Hazardous and Industrial Wastes: Proceedings of the Mid-Atlantic Industrial and Hazardous Waste Conference, Blacksburg, VA, 29, 344–52.
- Linak, W. P., J. D. Kilgroe, J. A. McSorley, J. O. L. Wendt, and J. E. Dunn. 1987. On the occurrence of transient puffs in a rotary kiln incinerator simulator I. Prototype solid plastic wastes. JAPCA 37 (1):54–65. doi:https://doi.org/10.1080/08940630.1987.10466202.
- Lissianski, V. V., V. M. Zamansky, and W. C. Gardiner. 2000. Combustion chemistry modeling. In Gas-phase combustion chemistry, ed. W. C. Gardiner, ch. 1, 1–123. New York: Springer.
- Lupton, R. C., and J. M. Allwood. 2017. Hybrid Sankey diagrams: Visual analysis of multidimensional data for understanding resource use. Resources, Conservation and Recycling 124:141–51. doi:https://doi.org/10.1016/j.resconrec.2017.05.002.
- Lusardi, M. R., M. Kohn, N. J. Themelis, and M. J. Castaldi. 2014. Technical assessment of the CLEERGAS moving grate-based process for energy generation from municipal solid waste. Waste Management & Research: The Journal for a Sustainable Circular Economy 32 (8):772–81. doi:https://doi.org/10.1177/0734242X14543813.
- Manion, J. A., and W. Tsang. 1997. The removal of fluorine atoms from halocarbons. In Halon Replacements, ed. A. W. Miziolek and W. Tsang, vol. 611, ch. 26, 341–57 ( ACS Symposium Series, no. 611). Washington, DC: American Chemical Society.
- Marklund, S., I. Fängmark, C. Rappe, N. Berge, and B. Strömberg. 1990. Use of a synthetic refuse in a pilot combustion system for optimizing dioxin emission. Part 1. Chemosphere 20 (10–12):1859–65. doi:https://doi.org/10.1016/0045-6535(90)90353-U.
- Martin, J. W., K. Kannan, U. Berger, P. D. Voogt, J. Field, J. Franklin, J. P. Giesy, T. Harner, D. C. G. Muir, B. Scott, et al. 2004. Peer reviewed: Analytical challenges hamper perfluoroalkyl research. Environ. Sci. Technol. 38 (13): 248A–255A. doi: https://doi.org/10.1021/es0405528.
- Matsakas, L., Q. Gao, S. Jansson, U. Rova, and P. Christakopoulos. 2017. Green conversion of municipal solid wastes into fuels and chemicals. Electronic Journal of Biotechnology 26:69–83. doi:https://doi.org/10.1016/j.ejbt.2017.01.004.
- Mätzing, H., H.-J. Gehrmann, H. Seifert, and D. Stapf. 2018/08. Modelling grate combustion of biomass and low rank fuels with CFD application. Waste Management 78: 686–97. doi:https://doi.org/10.1016/j.wasman.2018.05.008.
- McCurdy, J. 2001. Replacement of outlet monitors for the continuous emission monitoring system at the York County Resource Recovery Center. In Proceedings of the 9th Annual Waste-to-Energy Conference (NAWTEC 9), Miami: American Society of Mechanical Engineers, doi: https://doi.org/10.1115/NAWTEC9-111.
- McEnally, C. S., and L. D. Pfefferle. 2011/03. Sooting tendencies of oxygenated hydrocarbons in laboratory-scale flames. Environ. Sci. Technol. 45(6):2498–503. doi:https://doi.org/10.1021/es103733q.
- Meer, H. G. 1961. Incinerator Furnace Temperature. J. Air Pollut. Control Assoc. 11 (10):479–82. doi:https://doi.org/10.1080/00022470.1961.10468028.
- Mettler, M. S., S. H. Mushrif, A. D. Paulsen, A. D. Javadekar, D. G. Vlachos, and P. J. Dauenhauer. 2012. Revealing pyrolysis chemistry for biofuels production: Conversion of cellulose to furans and small oxygenates. Energy Environ. Sci. 5 (1):5414–24. doi:https://doi.org/10.1039/C1EE02743C.
- Mitchell, W. J., and R. Midgett. 1976. Adequacy of sampling trains and analytical procedures used for fluoride. Atmospheric Environment (1967) 10(10):865–72. 1976/01/01/. doi:https://doi.org/10.1016/0004-6981(76)90141-4.
- Moldoveanu, S. C. 2010. Chapter 4 Instrumentation used in pyrolysis. In Pyrolysis of organic molecules: Applications to health and environmental issues, ed. S. C. Moldoveanu, vol. 28, 79–104 (Techniques and Instrumentation in Analytical Chemistry). Amsterdam: Elsevier.
- Moldoveanu, S. 2019. Pyrolysis of Organic Molecules: Applications to Health and Environmental Issues. 2nd ed. Amsterdam: Elsevier.
- Montaser, A., M. G. Minnich, J. A. McLean, H. Liu, J. A. Caruso, and C. W. McLeod. 1998. Sample introduction in ICPMS. In Inductively coupled plasma mass spectrometry, ed. A. Montaser, ch. 3, 85–224. New York: Wiley-VCH.
- Myers, K. J., A. Bakker, and D. Ryan. 1997. Avoid agitation by selecting static mixers. Chemical Engineering Progress 93 (6):28–38.
- Ndibe, C., S. Grathwohl, M. Paneru, J. Maier, and G. Scheffknecht. 2015/09. Emissions reduction and deposits characteristics during cofiring of high shares of torrefied biomass in a 500kW pulverized coal furnace. Fuel 156:177–89. doi:https://doi.org/10.1016/j.fuel.2015.04.017.
- Niessen, W. R. 2010. Combustion and incineration processes: Applications in environmental engineering. 4th ed. Boca Raton: CRC Press.
- Norinaga, K., T. Shoji, S. Kudo, and J.-I. Hayashi. 2013/01. Detailed chemical kinetic modelling of vapour-phase cracking of multi-component molecular mixtures derived from the fast pyrolysis of cellulose. Fuel 103: 141–50. doi:https://doi.org/10.1016/j.fuel.2011.07.045.
- Nunn, T. R., J. B. Howard, J. P. Longwell, and W. A. Peters. 1985/07. Product compositions and kinetics in the rapid pyrolysis of milled wood lignin. Industrial & Engineering Chemistry Process Design and Development 24(3):844–52. doi:https://doi.org/10.1021/i200030a054.
- Ostaszewski, D. 2019. PFAS source emission testing procedures: A pollutant in search of a method. In International Conference on Thermal Treatment Technologies (IT3) & Hazardous Waste Combustors, League City, TX: Air & Waste Management Association.
- Patterson, G. K., E. L. Paul, S. M. Kresta, and A. W. Etchells. 2004. Mixing and chemical reactions. In Handbook of industrial mixing, ed. E. L. Paul, V. A. Atiemo-Obeng, and S. M. Kresta, 755–867. Hoboken, NJ: John Wiley & Sons, Inc.
- Pinto, F., C. Franco, R. N. André, C. Tavares, M. Dias, I. Gulyurtlu, and I. Cabrita. 2003. Effect of experimental conditions on co-gasification of coal, biomass and plastics wastes with air/steam mixtures in a fluidized bed system. Fuel 82 (15–17):1967–76. doi: https://doi.org/10.1016/S0016-2361(03)00160-1.
- Prakash, N., and T. Karunanithi. 2008. Kinetic modeling in biomass pyrolysis – A Review. Journal of Applied Sciences Research 4 (12):1627–36.
- Puts, G., P. Crouse, and B. Ameduri, “Thermal degradation and pyrolysis of polytetrafluoroethylene,” in Handbook of Fluoropolymer Science and Technology, D. W. Smith, S. T. Iacono, and S. S. Iyer Eds. Hoboken, NJ: John Wiley & Sons, Inc., 2014, ch. 5, pp. 81–104.
- Quadram Institute. 2019. McCance and Widdowson’s composition of foods integrated dataset (Last updated 25 March 2019). Public Health England. Accessed May 7, 2020.https://www.gov.uk/government/publications/composition-of-foods-integrated-dataset-cofid
- Ranzi, E., T. Faravelli, and F. Manenti. 2016. Chapter one - Pyrolysis, gasification, and combustion of solid fuels. In Thermochemical Process Engineering, ed. K. M. Van Geem, 49, 1–94 (Advances in Chemical Engineering). Cambridge, MA: Academic Press.
- Rasmussen, C. L., J. Hansen, P. Marshall, and P. Glarborg. 2008. Experimental measurements and kinetic modeling of CO/H2/O2/NOx conversion at high pressure. International Journal of Chemical Kinetics 40 (8):454–80. doi:https://doi.org/10.1002/kin.20327.
- Reid, R. C., J. M. Prausnitz, and T. K. Sherwood. 1977. The properties of gases and liquids, 3rd ed., ch. 11, 548–53; appendix C, 678–79 (McGraw-Hill Chemical Engineering Series). New York: McGraw-Hill
- Risha, K., J. Flaherty, R. Wille, W. Buck, F. Morandi, and T. Isemura. 2005/03. Method for trace level analysis of C8, C9, C10, C11, and C13 perfluorocarbon carboxylic acids in water. Anal. Chem. 77(5):1503–08. doi:https://doi.org/10.1021/ac0490548.
- Rubey, W. A. 1980. Design considerations for a thermal decomposition analytical system (EPA-600/2-80-098). Cincinnati: U.S. Environmental Protection Agency.
- Rubey, W. A., and R. A. Carnes. 1985. Design of a tubular reactor instrumentation assembly for conducting thermal decomposition studies. Review of Scientific Instruments 56 (9):1795–98. doi:https://doi.org/10.1063/1.1138096.
- Rubey, W. A., and R. A. Grant. 1988. Design aspects of a modular instrumentation system for thermal diagnostic studies. Review of Scientific Instruments 59 (2):265–69. doi:https://doi.org/10.1063/1.1140238.
- Ryu, C., D. Shin, and S. Choi. 2002. Combined simulation of combustion and gas flow in a grate-type incinerator. J. Air Waste Manage. Assoc. 52 (2):189–97. doi:https://doi.org/10.1080/10473289.2002.10470769.
- Sawyer, C. N., and P. L. McCarty. 1978. Chemistry for Environmental Engineering, 3rd ed. (McGraw Hill Series in Water Resources and Environmental Engineering). New York: McGraw-Hill.
- Shen, D. K., S. Gu, and A. V. Bridgwater. 2010/03. Study on the pyrolytic behaviour of xylan-based hemicellulose using TG–FTIR and Py–GC–FTIR. J Anal Appl Pyrolysis 87(2):199–206. doi:https://doi.org/10.1016/j.jaap.2009.12.001.
- Sherwood, T. K., R. L. Pigford, and C. R. Wilke. 1975. Mass transfer (McGraw Hill Chemical Engineering Series). New York: McGraw-Hill.
- Simpson, M., J. Wei, and S. Sundaresan. 1996. Kinetics of zeolitic solid acid-catalyzed alkylation of isobutane with 2-butene. In Green chemistry: Designing chemistry for the environment, ed. P. T. Anastas and T. C. Williamson, ch. 9, 105–15 ( ACS Symposium Series, no. 626). Washington, DC: American Chemical Society.
- Simrit. 2007. Material Properties: S315 (VMQ) (Pub#2576). Plymouth, MI: Freudenberg-NOK.
- Simsek, E., B. Brosch, S. Wirtz, V. Scherer, and F. Krüll. 2009/08. Numerical simulation of grate firing systems using a coupled CFD/discrete element method (DEM). Powder Technology 193(3):266–73. doi:https://doi.org/10.1016/j.powtec.2009.03.011.
- Spalding, D. B., H. C. Hottel, S. L. Bragg, A. H. Lefebvre, D. G. Shepherd, and A. C. Scurlock. 1963. The art of partial modeling. Symposium (International) on Combustion 9 (1):833–43. doi:https://doi.org/10.1016/S0082-0784(63)80090-9.
- Speight, J. G. 2008. Fuels from biomass. In Synthetic fuels handbook: Properties, process, and performance, ch. 8. New York: McGraw-Hill.
- Spliethoff, H. 2010. Power generation from biomass and waste. In Power generation from solid fuels, 361–467. Heidelberg: Springer-Verlag.
- Stern, D. A., B. M. Myatt, J. F. Lachowski, and K. T. McGregor. 1984. Speciation of halogen and hydrogen halide compounds in gaseous emisssions. In Incineration and Treatment of Hazardous Waste: Proceedings of the Ninth Annual Research Symposium (EPA-600/9-84-015), Fort Mitchell, KY: U.S. Environmental Protection Agency, Office of Research and Development, 33–41.
- Stiles, A. B. 1977. Methanol, past, present, and speculation on the future. AIChE J. 23 (3):362–75. doi:https://doi.org/10.1002/aic.690230321.
- Sudholt, A., L. Cai, and H. Pitsch. 2019/04. Laminar flow reactor experiments for ignition delay time and species measurements at low temperatures: Linear alkanes and dimethyl ether. Combustion and Flame 202:347–61. doi:https://doi.org/10.1016/j.combustflame.2018.11.017.
- Sundström, M., J. Bogdanska, H. V. Pham, V. Athanasios, S. Nobel, A. McAlees, J. Eriksson, J. W. DePierre, and Å. Bergman. 2012. Radiosynthesis of perfluorooctanesulfonate (PFOS) and perfluorobutanesulfonate (PFBS), including solubility, partition and adhesion studies. Chemosphere 87 (8):865–71. doi:https://doi.org/10.1016/j.chemosphere.2012.01.027.
- Swithenbank, J., and V. N. Sharifi. 2013. Incinerator grate combustion phenomena. In Renewable Energy Systems, ed. M. Kaltschmitt, N. J. Themelis, L. Y. Bronicki, L. Söder, and L. A. Vega, 1135–54. New York: Springer.
- Taylor, P. H., B. Dellinger, and C. C. Lee. 1990. Development of a thermal stability-based ranking of hazardous organic compound incinerability. Environ. Sci. Technol. 24(3):316–28. doi:https://doi.org/10.1021/es00073a005.
- Taylor, P. H., T. Yamada, R. J. Giraud, M. Kaiser, and R. C. Buck, “Fate of fluorotelomer treated consumer articles in a municipal waste incinerator (poster session),” presented at the Society of Environmental Toxicology and Chemistry North America Annual Meeting, Portland, OR, 2004.
- Tchobanoglous, G., H. Theisen, and R. Eliassen. 1977. Solid wastes: Engineering principles and management issues. (McGraw-Hill Series in Water Resoures and Environmental Engineering). New York: McGraw-Hill.
- Tchobanoglous, G., H. Theisen, and S. A. Vigil. 1993. Integrated Solid Waste Management: Engineering Principles and Management Issues, (McGraw Hill Series in Water Resources and Environmental Engineering). New York: McGraw-Hill.
- Teledyne Isco. January 13, 2006. D-Series pumps installation and operation guide (Revision G). Lincoln:Teledyne Isco
- Tsang, W. 1990/11. Mechanisms for the formation and destruction of chlorinated organic products of incomplete combustion. Combustion Science and Technology 74(1–6):99–116. doi:https://doi.org/10.1080/00102209008951683.
- Tsang, W., D. R. Burgess, and V. Babushok. 1998. On the incinerability of highly fluorinated organic compounds. Combustion Science and Technology 139 (1):385–402. doi:https://doi.org/10.1080/00102209808952095.
- US Public Health Service Engineering Unit. 1944. All-glass midget impinger unit. Industrial & Engineering Chemistry Analytical Edition 16 (5): 346–346. doi:https://doi.org/10.1021/i560129a032.
- van Blijderveen, M., E. A. Bramer, and G. Brem. 2013/06. Modelling spontaneous ignition of wood, char and RDF in a lab-scale packed bed. Fuel 108:190–96. doi:https://doi.org/10.1016/j.fuel.2013.01.040
- Visalli, J. R. 1987/12. A comparison of dioxin, furan and combustion gas data from test programs at three MSW incinerators. JAPCA 37(12):1451–63. doi:https://doi.org/10.1080/08940630.1987.10466343.
- Waldner, M. H., R. Halter, A. Sigg, B. Brosch, H. J. Gehrmann, and M. Keunecke. 2013/02. Energy from waste – Clean, efficient, renewable: Transitions in combustion efficiency and NOx control. Waste Management 33(2):317–26. /01/. doi:https://doi.org/10.1016/j.wasman.2012.08.007.
- Wampler, T., Ed. 2006. Applied pyrolysis handbook. 2nded. Boca Raton: CRC Press.
- Warnatz, J. 1984. Rate coefficients in the C/H/O system. In Combustion chemistry, ed. W. C. Gardiner, ch. 5, 197–360. New York: Springer-Verlag.
- Weekman, V. W. 1974. Laboratory reactors and their limitations. AIChE J. 20 (5):833–40. doi:https://doi.org/10.1002/aic.690200502.
- Westbrook, C. K., and F. L. Dryer. 1979. Modeling of flame properties of methanol. In Proceedings of Third International Symposium on Alcohol Fuels Technology, Asilomar, CA, U.S. Department of Energy, 127–36.
- Westbrook, C. K., and F. L. Dryer. 1980/01. Prediction of laminar flame properties of methanol-air mixtures. Combustion and Flame 37:171–92. doi:https://doi.org/10.1016/0010-2180(80)90084-X.
- Westbrook, C. K., and F. L. Dryer. 1984/01. Chemical kinetic modeling of hydrocarbon combustion. Progress in Energy and Combustion Science 10(1):1–57. doi:https://doi.org/10.1016/0360-1285(84)90118-7.
- Westbrook, C. K., F. L. Dryer, and K. P. Schug. 1982/01. A comprehensive mechanism for the pyrolysis and oxidation of ethylene. Symposium (International) on Combustion 19(1):153–66. doi:https://doi.org/10.1016/S0082-0784(82)80187-2.
- White, J. 1991. Extractive sampling systems for continuous emissions monitors. In Proceedings SPIE Environmental Sensing and Combustion Diagnostics, 1434. Los Angeles: SPIE, [Online]. Available: doi:https://doi.org/10.1117/12.48471.
- Wikström, E., and S. Marklund. 1998. Combustion of an artificial municipal solid waste in a laboratory fluidised bed reactor. Waste Management & Research: The Journal for a Sustainable Circular Economy 16 (4):342–50. doi:https://doi.org/10.1177/0734242x9801600406.
- Wikström, E., M. Tysklind, and S. Marklund. 1999. Influence of variation in combustion conditions on the primary formation of chlorinated organic micropollutants during municipal solid waste combustion. Environ. Sci. Technol. 33 (23):4263–69. doi:https://doi.org/10.1021/es990568b.
- Williams, E. A., and P. T. Williams. 1997. The pyrolysis of individual plastics and a plastic mixture in a fixed bed reactor. J. Chem. Technol. Biotechnol. 70 (1):9–20. doi:https://doi.org/10.1002/(SICI)1097-4660(199709)70:1<9::AID-JCTB700>3.0.CO;2-E.
- Williams, F. A. 1985. Combustion theory: The fundamental theory of chemically reacting flow systems. 2nd ed. Boca Raton: CRC Press.
- Williams, F. A. 2003. Combustion. In Encyclopedia of physical science and technology, ed. R. A. Meyers, 3rd ed., 315–38. New York: Academic Press.
- Williams, P. T., and S. Besler. 1992. The pyrolysis of municipal solid waste. J. Inst. Energy 65 (465):192–200.
- Winter, F. 2009. The concept of chemical similarity to optimize and design high-temperature gas-solid processes. In Scale-up in combustion, ed. M. Lackner, 15–32. Vienna: ProcessEng Engineering GmbH.
- Wochele, J., and S. Stucki. 1999. Similarity laws for the tubular furnace as a model of a fixed-bed waste incinerator. Chemical Engineering & Technology 22 (3):209–12. doi:https://doi.org/10.1002/(SICI)1521-4125(199903)22:3<209::AID-CEAT209>3.0.CO;2-T.
- Woitalka, A., S. Kuhn, and K. F. Jensen. 2014/09. Scalability of mass transfer in liquid–liquid flow. Chem Eng Sci 116:1–8. doi:https://doi.org/10.1016/j.ces.2014.04.036.
- Woolf, E. J. 1993. Post-column derivatization techniques. In A practical guide to HPLC detection, ed. D. Parriott, ch. 8, 211–32. San Diego: Academic Press.
- Wu, C., and P. T. Williams. 2014. Hydrogen from waste plastics by way of pyrolysis–gasification. Proceedings of the Institution of Civil Engineers - Waste and Resource Management 167 (1):35–46. doi:https://doi.org/10.1680/warm.13.00006.
- Yamada, T., P. H. Taylor, R. C. Buck, M. A. Kaiser, and R. J. Giraud. 2005. Thermal degradation of fluorotelomer treated articles and related materials. Chemosphere 61 (7):974–84. doi:https://doi.org/10.1016/j.chemosphere.2005.03.025.
- Yang, H.-M., S. Appari, S. Kudo, J.-I. Hayashi, and K. Norinaga. 2015/07. Detailed chemical kinetic modeling of vapor-phase reactions of volatiles derived from fast pyrolysis of lignin. Ind Eng Chem Res 54(27):6855–64. doi:https://doi.org/10.1021/acs.iecr.5b01289.
- Yang, Y. B., C. Ryu, J. Goodfellow, V. N. Sharifi, and J. Swithenbank. 2004/05. Modelling waste combustion in grate furnaces. Process Safety and Environmental Protection 82(3):208–22. /01/. doi:https://doi.org/10.1205/095758204323065975.
- Yang, Y. B., H. Yamauchi, V. Nasserzadeh, and J. Swithenbank. 2003/12. Effects of fuel devolatilisation on the combustion of wood chips and incineration of simulated municipal solid wastes in a packed bed. Fuel 82(18):2205–21. doi:https://doi.org/10.1016/S0016-2361(03)00145-5.
- Zabetakis, M. G. 1965. Flammability characteristics of combustible gases and vapors. Washington, D.C: U.S. Department of the Interior, Bureau of Mines. Bureau of Mines Bulletin 627.
- Zhang, E., E. Greiner, H. Janshekar, and T. Kumamoto. 2016. Fluoropolymers chemical economics handbook. Englewood, CO: IHS Chemical.
- Zhang, K., J. Huang, G. Yu, Q. Zhang, S. Deng, and B. Wang. 2013/06. Destruction of perfluorooctane sulfonate (PFOS) and perfluorooctanoic acid (PFOA) by ball milling. Environ. Sci. Technol. 47(12):6471–77. doi:https://doi.org/10.1021/es400346n.
- Zhang, Y., Q. Li, and H. Zhou. 2016. Theory and calculation of heat transfer in furnaces. London: Academic Press, an imprint of Elsevier.
- Zhou, H., A. Meng, Y. Long, Q. Li, and Y. Zhang. 2014. Classification and comparison of municipal solid waste based on thermochemical characteristics. J. Air Waste Manage. Assoc. 64 (5):597–616. doi:https://doi.org/10.1080/10962247.2013.873094.