
 ?Mathematical formulae have been encoded as MathML and are displayed in this HTML version using MathJax in order to improve their display. Uncheck the box to turn MathJax off. This feature requires Javascript. Click on a formula to zoom.
ABSTRACT
The U.S. Environmental Protection Agency (EPA) modified its guidance on determining “method detection limits” (MDL) in 2017. The recommended procedures have not yet been applied to the analyses routinely done on filter samples for EPA’s Chemical Speciation Network (CSN). This paper applies the new EPA procedure for estimating MDL to Energy Dispersive X-Ray Fluorescence (EDXRF) analysis of atmospheric aerosol samples collected on filters. The procedure involves estimating MDL by two approaches – statistical distributions of unloaded blank sample measurements and lightly loaded, spiked samples – and sets the MDL as the maximum of these two approaches. Spiked samples at low concentrations were developed using an aerosol deposition chamber to follow this approach. The MDL procedure was initially conducted on one EDXRF instrument, and the spike-based MDL was found to be higher than blank-based MDL for 28 of the 31 elements. The blank-based MDL was higher than the spike-based MDL for Si, K and Fe, which are common contaminants present in filter raw media or arising from EDXRF hardware. The annual verification performed using five EDXRF analyzers demonstrated that the MDL estimated following the EPA procedure was stable over time and analyzers for all elements except K, which yielded a higher MDL.
Implications: Lightly loaded reference materials (RM) were developed for Energy Dispersive X-ray Fluorescence (EDXRF) measurements of elemental concentrations in filter-based particulate matter samples using a novel aerosol generation chamber. These RM were then used to estimate method detection limits (MDL) following U.S. Environmental Protection Agency guidance. These new MDL estimates were compared to alternative estimates and, for most elements, are higher. Our work provides EDXRF users with MDL estimates for each element and an assessment of different MDL estimation approaches.
Introduction
Detection capabilities of a measurement process are among the fundamental performance characteristics that must be characterized to identify marginal data and to design a method meeting specified analytical goals (Hyslop and White Citation2008; Currie, Citation1995). Fully characterized detection limits address two subtly different questions. The first question typically arises after the measurement is made: At what threshold of measured concentrations can we be confident that the analyte is truly present? The second question arises when developing a measurement plan: At what minimum actual concentration can we be confident that the analyte will be measured? These questions are familiar in forensic and clinical settings where two types of errors are distinguished: false positives, often called type I errors, and false negatives or type II errors. Confidence in detection limits is expressed in terms of the rates at which these errors are expected to be made.
The United States Environmental Protection Agency (EPA) defines the Method Detection Limit (MDL) as the minimum measured concentration of a substance that is distinguishable from method blank with a statistical confidence of 99% (EPA Citation2016), which addresses the first question above to avoid false positives. Analytical results higher than MDL should be deemed detected at a 99% confidence level. The premise for this judgment is that the measurement is specific to the analyte of interest and not subject to interferences from other analytes. Note that MDL does not address the precision or accuracy of the measurement, only the presence or absence of analytes.
In 2017, the EPA updated the procedure to estimate the MDL for physical and chemical methods (EPA Citation2017). This procedure expands upon the previous version wherein the MDL was based solely on the standard deviation of analytical results from lightly loaded, spiked samples. The new procedure requires two steps to determine the MDL. First, a set of blanks are prepared and analyzed to calculate the blank-based MDL. Second, “spike” samples with concentrations approximately two to ten times higher than the blank-based MDL are prepared and analyzed to calculate spike-based MDL. The higher of the two MDL estimates, blank-based or spike-based, is then reported as the MDL. It is not obvious that one MDL estimation method, blank- or spike-based, will provide higher MDL estimates than the other. Factors such as contamination in blank filter media and filter thickness consistency may yield higher variability, thus higher MDL; higher concentrations on spiked samples may overwhelm the inherent variability in the blank media and lead to more precise measurements, thus lower MDL estimates. On the other hand, background noise may be higher in spiked samples, and measurement interferences can add uncertainty, so spiked samples may yield higher MDL estimates. For wet-chemistry-based analytical methods, blank contamination levels are easily controlled using high-purity reagents and high-quality labware; in addition, generating consistent spiked samples are readily prepared using precise volume and mass measurement devices.
For aerosol samples on filter media, both tasks are challenging due to random contamination of raw filter media and the lack of instrumentation to generate consistent spiked samples at known loadings. The EPA’s Chemical Speciation Network (CSN) measures the chemical composition of atmospheric fine particulate matter samples (PM2.5) collected on filters using multiple analytical techniques, including Energy Dispersive X-ray Fluorescence (EDXRF) to measure 33 elements in the samples. The major advantage of EDXRF analysis of air samples over wet-chemistry-based methods is direct measurement on the filters without any sample preparation. Estimating MDL by the EPA approach is a major undertaking in terms of analysis time if each element is evaluated individually using commercially available reference materials; the spike-based MDL step would require 693 analysis (2 MDL estimates × 7 analyses × 3 batches × 33 elements, recommended by EPA in 40 CFR 136 appendix B, Citation2017). In addition, measurement interferences are common for spectral analyses where many species are measured simultaneously, like EDXRF. Therefore, it is essential to estimate MDL for multiple elements simultaneously.
Unfortunately, spiked samples are not readily available for atmospheric PM2.5 collected on filter membranes, particularly at low loadings (Hyslop et al. Citation2019). To overcome this limitation, The University of California Davis (UCD) Air Quality Research Center (AQRC) designed an aerosol generation system (AGS) capable of generating spiked samples at target elemental loadings on polytetrafluoroethylene filters (PTFE) filter membranes. The AGS has been used to successfully generate reference materials for EDXRF (Hyslop et al. Citation2019; Indresand et al. Citation2013; Sinan et al. Citation2018; Yatkin et al. Citation2016, Citation2020). The elemental loadings of these reference materials are usually much higher than the blank-based MDL estimates (MDLLB).
In this paper, the AGS was used to develop lightly spiked samples, and the new EPA procedure for estimating MDL was applied to EDXRF measurements of PM2.5 collected on polytetrafluoroethylene filters (PTFE filters, Model PT47-EP, MTL Inc, USA). The MDL estimated from statistical variation of blank and spiked filters analyzed multiple times are compared to the MDL reported in the literature and the MDL estimate currently reported for CSN. Results of the periodic verification of MDLs performed a year after the original determination, as the EPA procedure requires, are also reported.
Methods And materials
EDXRF analysis
The samples were analyzed using Epsilon 5 EDXRF systems (Malvern Panalytical, the Netherlands). The sample area subject to EDXRF excitement is a 3.53 cm2 circular area. Seven different analytical conditions are used during a single analysis run to balance sensitivity and exposure time for 33 reported elements. Each analytical condition is designed to optimize detection for a subset of these 33 elements and uses a different secondary target, X-ray tube voltage and current, resolution setting, and exposure time. Details of the EDXRF application are presented in . The AQRC uses five EDXRF analyzers for routine analysis of CSN samples, but for this evaluation study, the procedure was initially applied to only one analyzer.
Table 1. Epsilon 5 application used to analyze samples.
The EPA procedure
The EPA procedure first requires preparing and analyzing three sets of at least seven laboratory blank filters over 3 days (EPA Citation2017, Citation2016). The laboratory blank-based MDL (MDLLB) from these results is calculated by EquationEq.1(1)
(1)
where is the average measured blank loading (ng/cm2),
is the standard deviation of the blank loadings (ng/cm2), n is the number of blanks, and
is student t value for a 99% confidence level in a one-tailed distribution. In CSN, median monthly field blank measurements are subtracted from each EDXRF sample measurement in the same month to account for background contamination. These laboratory blanks used to estimate MDLLB were treated similarly, and the median laboratory blank loading was subtracted from each laboratory blank. This should be noted when comparing these MDLLB with other MDL datasets, which might be calculated without blank subtraction. For a few elements (Al, Cr, Fe, Ni, Rb, In, Sn, Ba, Ce), this correction resulted in negative mean loadings, and a value of zero was substituted for the negative mean value.
Second, the procedure requires the preparation and analysis of seven “spiked” samples with known loadings. The EPA recommends elemental loadings on spiked samples of 2 to 10 times MDLLB (40 CFR 136 appendix B, Citation2017). Three sets of spiked samples should be prepared and analyzed daily on three different days with daily prepared calibrations. However, the sets used in this study were prepared on the same day because the AGS used to generate the spiked samples has high startup requirements. Also, since EDXRF analyzers are typically only calibrated annually, the spiked samples were analyzed using a single calibration. The spiked multielement (ME) sample-based MDL (MDLME) is calculated by EquationEq. 2(2)
(2) where
is the standard deviation of the ME spiked-sample loadings from EDXRF analysis (ng/cm2), and m is the number of spiked samples.
The maximum of MDLLB and MDLME are assigned as MDL by the EPA procedure (MDLEPA).
The MDLEPA must be verified periodically to check for changes over time. For annual verification, the entire measurement and calculation procedure described above must be repeated. If the verification MDL of any element does not remain between 50% and 200% of the current MDL estimate (MDLEPA), the MDLs are updated to be the MDL estimated from the verification procedure.
Preparation of spiked ME samples
The EPA MDL procedure assumes the ability to create consistent, low-concentration reference materials, and as discussed in the introduction to perform this procedure in a reasonable amount of time, these reference materials need to contain multiple elements. There have been commercially available multielement reference materials, for example, standard reference material 2783 (SRM2783) by the National Institute of Standards and Technology (NIST). However, SRM2783 does not contain all the elements measured in CSN, and the elemental concentrations on SRM2783 are one to two order of magnitude higher than MDLLB, making it not suitable for MDL evaluation. Therefore, we decided to produce low-concentration multielement reference materials for this purpose. This is a major challenge for filter-based PM measurements like EDXRF and thermal optical analysis. UCD-AQRC has been working on generating reference materials (RMs) for EDXRF measurements for several years, and the generated multielement reference materials (ME-RMs) have been demonstrated to be stable when handled and stored properly (Sinan et al. Citation2018; Yatkin et al. Citation2020). This work is still in the development phase and creating ME-RMs with specified loadings is an exploratory iterative process. The AGS used to generate the ME-RMs consists of a constant output atomizer (TSI-3076, TSI Inc., USA), filtered air supply, diffusion dryer, mixing chamber, and sampler (Indresand et al. Citation2013; Yatkin et al. Citation2016). Briefly, a solution is aerosolized by the atomizer followed by drying, mixing with clean air and sampling using a MetOne SuperSASS (Metone Inc, USA), which collects four samples simultaneously. Sampling time is used to control the sample loadings on the filters (e.g., longer sampling time equates to heavier loading for the same solution). While these aerosolized solutions do not exactly mimic ambient aerosol samples in terms of composition or particle morphology, the sampling equipment and media mimic those used in the monitoring networks.
Two certified solutions (AccuStandard Inc., USA) containing Na, Mg, Al, Si, P, S, K, Ca, Ti, V, Cr, Mn, Fe, Co, Ni, Cu, Zn, As, Se, Rb, Sr, Zr, Ag, Cd, In, Sn, Sb, Ca, Ba, Ce and Pb were mixed and diluted with deionized water to generate ME-RMs with target loadings. These are all the elements measured in CSN except Cl and Br, which were not included since they are known to be volatile over time and under vacuum during EDXRF analysis (Hyslop et al. Citation2019; Citation2012). The concentrations in these solutions were specified in an attempt to achieve CME/MDLLB in the EPA recommended range.
The ME-RMs for this study were generated through an iterative process because the sampling times required to obtain target concentrations are not known. We generated ME-RMs, measured the ME-RM concentrations by EDXRF, then adjusted the collection times iteratively until we reached the target concentrations for most of the measured elements. Once the desired concentrations were achieved, we collected several ME-RM samples at that same collection time.
Consistency assessment of ME
Three iterations of the ME-RM generation process were required to achieve the desired concentrations (henceforth referred to as ME). The third set consists of 24 ME with target loadings for most elements in the range of 2–10 times MDLLB. The sampling time was 13 min.
Consistency of generated ME, namely having the same elemental loadings on each filter in the set, must be demonstrated to implement the EPA procedure. Consistency is a measure of the capability of the AGS. Assuming the elemental compositions of the ME deposits are identical, the variance of the EDXRF measurements on the ME samples collected with the same sampling time (Var(MEe)) for element e can be modeled as the sum of the variance of deposited masses (Var(depe)) and variance of the EDXRF measurements (Var(EDXRFe)) as shown in EquationEq. 3(3)
(3) .
assuming the Var(depe) and Var(EDXRFe) are two independent variables. Var(dep) is a measure of the AGS capacity to deposit equal amounts of mass on samples with equal sampling times and can be solved for with EquationEq. 4(4)
(4) . One EDXRF analysis result from each of the 24 ME was used to calculate Var(MEe). One ME was analyzed 10 times by EDXRF to determine Var(EDXRFe).
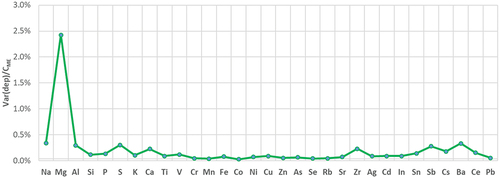
shows the Var(depe) normalized to average loadings for the ME set of 24 filters (CME) estimated using EquationEq. 4(4)
(4) . Var(dep) is below 1% for all elements except Magnesium (Mg). Var(dep)/CME for Mg is 2.5%, which is still a reasonable level of variation for these experiments. The low Var(dep) values show that the AGS is capable of generating consistent samples.
Figure 1. The variance of deposit normalized to average loadings (Var(dep)/CME) of selected elements on the ME set.
Results and discussion
MDLLB estimates
The MDLLB values were determined from EquationEquation 1(1)
(1) using analysis results from 16 new MTL PTFE filters (47 mm diameter, 2 μm pore size, Minneapolis, MN) on one of the EDXRF instruments used for routine analysis of CSN samples. This sample set has a t-value of 2.602. The filters were removed from their packaging and immediately inserted into the EDXRF instrument for analysis with as little handling as possible; sample media treated in this way are referred to as lab blanks. The MDLLB estimates are listed in . MDLLB for Sulfur (S) was zero based on the zero readings reported from EDXRF analyzer. Similarly, most of the Phosphorus (P) readings were very low. Thus, MDLLB is zero for both S and P.
Table 2. The comparison of MDLLB and MDLME along with current reported MDL (MDLFB, will be discussed later) and MDL estimated by 3-sigma-criterion from the literature (all MDL values have units of ng cm-2, n.a. refers to not available). Elements with asterisks (*) have CME/MDLLB outside of the recommended 2–10 × MDL range. Note MDLLB and MDLME were determined in 2018, while MDLFB was determined in 2020. The greater than (>) signs indicate elements where MDLLB exceeded MDLME.
ME loadings
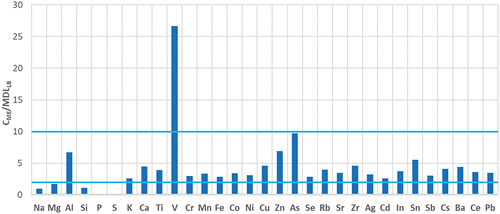
shows the average loading-to-MDLLB ratios for the set of 24 ME used to estimate the MDLME. The blue horizontal lines are the recommended limits (2–10 × MDLLB) for the EPA MDL procedure. No results are shown for P and S in because their MDLLB estimates were zero. It is challenging to generate samples with all elements in the targeted range given the complex chemistry of these reference solutions, particularly when they are mixed, and the difficulty of making these trace measurements. Loadings for 25 of the 31 measured elements were within the EPA recommended limits of 2 to 10 times MDLLB. The exceptions are either hard to measure by EDXRF at low levels (e.g., Na and Mg) or the concentrations on the ME did not meet the expectations based on the concentrations in the solutions due to interactions and possible reactions between elements in solutions (e.g., Si and V), or the MDLLB estimates were likely too low as a result of nondetects in the blank measurements (e.g., S and P). Despite the fact that the 2–10 times MDLLB criterion was not met for every element, we used these MEs to estimate MDLME for all the elements.
Figure 2. The average elemental loadings (CME) normalized to MDLLB ratios (CME/MDLLB) for the ME set. Note: P and S have MDLLB of 0, so their CME/MDLLB values are not shown. Horizontal lines are upper and lower limits recommended in the EPA procedure.
Elemental concentrations on the ME are solely based on EDXRF measurements. These reference materials have been evaluated through laboratory intercomparisons including comparisons with alternative measurement methods such as inductively coupled plasma mass spectrometry (ICPMS) (Hyslop et al. Citation2019; Sinan et al. Citation2018; Yatkin et al. Citation2020). While ICPMS analysis could have been used to verify the element loadings on the ME, it would have destroyed the samples. Given that the MDL estimates are based on standard deviations of the measurements, the accuracy of the loadings on the reference materials is not of the utmost importance. The prior intercomparisons of these reference materials provided enough confidence in the ME loadings to proceed with this experiment.
MDLEPA determination and periodic verification
Twenty-one out of the 24 generated MEs were selected for the MDLME estimation. These 21 ME were analyzed on a single EDXRF analyzer over 3 days. EquationEquation 2(2)
(2) was used to calculate MDLME along with a t-value for this sample set of 2.528. MDLLB along with MDLME values are listed in . MDLME values are higher than MDLLB for all elements except for Si, K, and Fe, which are all crustal elements; the filters likely pick up these crustal elements from the manufacturing process or the EDXRF hardware. The higher elemental concentrations added to the ME likely overwhelm the variability seen in the blank filters, thus reducing the standard deviations in the MDLME estimates. Thus, MDLEPA was set to MDLME except for those three crustal elements, which were set to MDLLB.
In 2021, the verification process was performed, which repeats the determination process in its entirety except new ME was not generated, but instead the ones created in 2018 were used. Note the MDLEPA(2021) is determined in 2021 by measuring 30 lab blank filters and 24 ME filters across all five EDXRF analyzers. Six of each sample type – blanks and ME – were analyzed on each EDXRF instrument. MDLLB and MDLME were calculated using EquationEq. 1(1)
(1) and Equation2
(2)
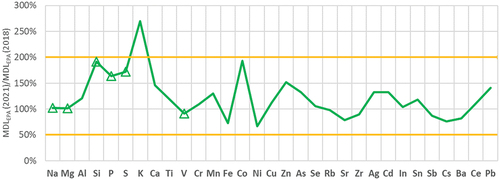
(2) again, and the maximum of these two was set as MDLEPA(2021). shows the ratios of the MDLEPA measured in 2021 for annual verification to those measured right after ME generation in 2018; all elements are within EPA limits of 50% to 200% of MDLEPA, except K, thus the MDLEPA of all elements but K were verified for the year 2021. The higher MDLEPA(2021) of K is a result of using multiple analyzers in 2021. Potassium is the most accurate element measured by EDXRF in the UCD AQRC (Sinan et al. Citation2018). The standard deviation of K measurement of a single instrument is low. Therefore, the MDL in 2018 was low when only one instrument was used. MDLEPA for K should be updated to the new estimate determined in 2021. Given that the 2021 verification used more instruments (five instead of one) and more ME samples (24 opposed to 21), the variability and MDLEPA(2021) estimates were expected to be higher. However, as shown in , the estimates were robust despite these added variables.
Figure 3. Ratios of MDLs acquired in 2021 for annual verifications to those acquired in 2018 right after generation. Elements marked with triangles have CME/MDLLB outside of 2–10.
It is useful to compare the MDL estimates based on the new EPA approach to estimates based on other approaches, including the approach currently used for the CSN EDXRF data. The MDL currently reported with the CSN EDXRF data are based on measurements of CSN network field blank samples. For the year 2020, at least 98 field blank samples were measured each month across the CSN network. For each month, the MDL was set as the 95th percentile minus the median field blank measurement value (denoted as MDLFB) for each element. The rationale is a balance of using the 99th percentile, as recommended by EPA, and the fact that there are common outliers in the field blank dataset. Field blanks are samples that are shipped out to the field sampling site along with the routine sample, installed in the instrument for the sampling period, removed from the sampler along with the routine sample, and shipped back to the analytical laboratory. Therefore, there is a potential for swapping the field blank with the routine sample, which generates outliers in the field blank data. To avoid those outliers and generate reasonable MDL estimates, the 95th percentile is used to estimate the MDL. compares the average reported MDLFB from all months in 2020 with the EPA estimate of MDL based on the 2021 annual verification. illustrates that all MDL estimates are generally higher for the low and high Z elements compared to mid-Z elements. MDLEPA are at least two to three times higher than the currently reported MDLFB values. MDLFB are similar to the MDLLB in for most elements, which shows the consistency between the lab and field blank approaches. The MDL estimates based on the lightly loaded ME take into account measurement interferences and likely provide more realistic estimates of MDL.
Figure 4. Comparison of MDLEPA(2021) and MDLFB(2020). Elements are in order of low to high atomic number (Z).
Another approach to estimate MDL found in the literature, is to determine the statistical variation of a single lab blank or lightly loaded sample analyzed multiple times. In this approach, the MDL estimate is a multiple of (e.g., three times) the standard deviation of multiple analyses of a single sample (Engelbrecht and Jayanty Citation2013; Gunchin et al. Citation2019; Yatkin, Gerboles, and Borowiak Citation2012; Zhang et al. Citation2012). Several such estimates are available in the literature and are compared to the estimates determined by the EPA procedure in . Since MDL depends on spectrometer hardware (e.g., X-ray tube, primary or secondary excitation, and detector) and on analytical application (e.g., analytical atmosphere: air or vacuum and secondary targets and exposure time selection) these studies were selected to be similar to analytical conditions utilized in this study. Most EDXRF laboratories do not report the high-Z elements as indicated by the n.a. values in .
These alternative approaches were also followed and compared to the MDLEPA estimates. EquationEq.2(2)
(2) was used to estimate MDL based on one lab blank repeatedly analyzed daily for 130 days on a single analyzer (MDLrep-blk(2019)) and one ME analyzed seven times on each of five analyzers for a total of 35 measurements (MDLrep-ME(2021)). The results are shown in . These estimates are sometimes referred to as an analytical MDL because they do not account for the variability in the sample media, which can be significant. Accordingly, for most elements, the MDLrep-blk estimates are much lower than the MDLEPA estimates. For most elements, MDLrep-ME(2021) was similar to MDLEPA with relative differences below 25%.
Figure 5. Comparison of three different approaches for estimating MDL: MDLEPA(2021), MDLrep-blk(2019) and MDLrep-ME(2021).
Conclusion
We successfully followed the new EPA procedure to estimate the MDL for EDXRF measurements of elemental concentrations in PM2.5 samples for CSN with some exceptions for this particular application. EDXRF measurements are performed directly on the sample filter membranes without any sample preparation and spiked sample filters at low concentrations are not readily available or easy to make. Therefore, the major challenge in performing this procedure was to generate multiple spiked samples with low and consistent loadings. In addition, the EPA procedure specifies performing the analyses under different calibrations, but EDXRF instruments are very stable and calibrations are only performed on an annual basis (or after major maintenance). Therefore, measurements for estimating MDLLB and MDLME were all performed under the same calibration. The AQRC aerosol generation system was used to meet this challenge and demonstrated to be capable of generating consistent ME samples with 31 elements. Loadings on the ME reference materials fell within the target range recommended by the EPA MDL estimation procedure for 25 out of the 31 elements. The spiked-samples approach in the EPA procedure (MDLME), yielded higher MDL values than the blank-samples approach (MDLLB). The MDLEPA estimates are consistently higher than the MDL estimates based on field blanks (MDLFB) currently reported for the CSN EDXRF measurements. Two additional MDL estimates were also developed for comparison. MDL estimates based on repeated analysis of a single blank were similar to MDLLB except for occasional contaminants, e.g., Si, K, and Ca. The MDL profile of this study is similar to those in the literature. The MDLEPA estimated as the maximum of blank- and spike-based approaches were verified after 2 years by repeating the procedure, and the MDL estimates were within the EPA bounds for all elements except K. The EPA MDL estimates are likely better than those based purely on blanks as estimates of real-world MDLs, given that blanks do not account for interferences that may occur on real, atmospheric samples.
This MDL investigation provides guidance for EDXRF users, particularly those using Malvern Panalytical Epsilon 5 instruments, to interpret low measurement values. According to MDL, the definition, values measured above MDL indicate strong confidence of analyte existence, but a value less than MDL does not provide much confidence that the analyte is not present. For a sample with real concentration at exactly MDL, there’s a 50% chance the measured value will be less than MDL; moreover, laboratory-based MDL estimates may not capture all real-world sample interferences (Hyslop and White Citation2008). The fact that 50%–200% changes in MDL values are considered “no substantial change” by EPA is indicative of the uncertainty in MDL values.
Acknowledgment
The authors acknowledge funding in cooperation with the U.S. EPA and the Interagency Monitoring of PROtected Visual Environments (IMPROVE) program (National Park Service cooperative agreement P18AC01222).
Data availability statement
The data that support the findings of this study are available from the corresponding author, NPH, upon reasonable request.
Disclosure statement
No potential conflict of interest was reported by the author(s).
Additional information
Funding
Notes on contributors
Nicole Pauly Hyslop
Nicole Pauly Hyslop is the Associate Director for Quality Research in the Air Quality Research Center at the University of California Davis. Dr. Hyslop conducts research to characterize data quality to gain a better understanding of the sources of error in the measurements and improve quality assurance protocols to identify and reduce errors.
Yifan Liu
Yifan Liu has been a post-doc in the Air Quality Research Center at the University of California Davis since 2019. Dr. Liu’s research focuses on gravimetric data analysis and reference material development. Dr. Liu received his PhD in Chemical and Biological Engineering from Johns Hopkins University where he specialized on nanomaterials.
Sinan Yatkin
Sinan Yatkin was an Assistant Project Scientist for the Air Quality Research Center at the University of California Davis when this work was performed. He was involved in the research of XRF method development and generation of reference materials.
Krystyna Trzepla
Krystyna Trzepla was the Laboratory Manager for the Air Quality Research Center at the University of California Davis until her retirement in 2020. Ms. Trzepla provided support for all research studies involving monitoring particles in the atmosphere, with special emphasis on the application of elastic lidar system for monitoring spatial distribution and elemental analyses by X-Ray Fluorescence and Proton Elastic Scattering.
References
- Code of Federal Regulations (CFR), 2017. Definition and procedure for the determination of the method detection limit - Revision 2, Title 40, Part 136, Appendix B., https://www.federalregister.gov/documents/2017/08/28/2017-17271/clean-water-act-methods-update-rule-for-the-analysis-of-effluent (accessed September 3, 2021).
- Currie, L. A. 1995. Nomenclature in evaluation of analytical methods including detection and quantification capabilities. Pure & Appl. Chem. 67 (10):1699–723.
- Engelbrecht, J. P., and R. K. M. Jayanty. 2013. Assessing sources of airborne mineral dust and other aerosols, in Iraq. Aeolian. Res. 9 (June):153–60. doi:https://doi.org/10.1016/j.aeolia.2013.02.003.
- EPA. 2016. “EPA 821-R-16-006.”
- EPA. 2017. “EPA–HQ–OW–2014–0797.”
- Gunchin, G., S. C., D. I., A. G. Germanos Karydas, K. Eleftheriadis, S. Lodoysamba, D. Shagjjamba, A. Migliori, R. Padilla-Alvarez, M. Manousakas, et al. 2019. Three-year long source apportionment study of airborne particles in Ulaanbaatar using x-ray fluorescence and positive matrix factorization. Aerosol Air Qual. Res. 19 (5):1056–67. doi:https://doi.org/10.4209/aaqr.2018.09.0351.
- Hyslop, N. P., K. Trzepla, and W. H. White. 2012. Reanalysis of archived IMPROVE PM2.5 samples previously analyzed over a 15-year period. Environ Sci & Tech. 48:10106–13.
- Hyslop, N. P., K. Trzepla, S. Yatkin, W. H. White, T. Ancelet, P. Davy, O. Butler, M. Gerboles, S. Kohl, A. McWilliams, et al. 2019. An inter-laboratory evaluation of new multi-element reference materials for atmospheric particulate matter measurements. Aerosol Sci. Technol. 53 (7):771–82. doi:https://doi.org/10.1080/02786826.2019.1606413.
- Hyslop, N. P., and W. H. White. 2008. An empirical approach to estimating detection limits using collocated data. Environ. Sci. Technol. 42 (14):5235–40. doi:https://doi.org/10.1021/es7025196.
- Indresand, H., W. H. White, K. Trzepla, and A. M. Dillner. 2013. Preparation of Sulfur reference materials that reproduce atmospheric particulate matter sample characteristics for XRF calibration. X-Ray Spectrom. 42 (5):359–67. doi:https://doi.org/10.1002/xrs.2456.
- Sinan, Y., K. Trzepla, W. H. White, and N. Pauly Hyslop. 2018. Generation of multi-element reference materials on PTFE filters mimicking ambient aerosol characteristics. Atmos. Environ. 189 (September):41–49. doi:https://doi.org/10.1016/j.atmosenv.2018.06.034.
- Yatkin, S., H. S. Amin, K. Trzepla, and A. M. Dillner. 2016. Preparation of Lead (Pb) X-Ray fluorescence reference materials for the EPA Pb monitoring program and the improve network using an aerosol deposition method. Aerosol Sci. Technol. 50 (4):309–20. doi:https://doi.org/10.1080/02786826.2016.1150956.
- Yatkin, S., M. Gerboles, and A. Borowiak. 2012. Evaluation of standardless EDXRF analysis for the determination of elements on PM10 loaded filters. Atmos. Environ. 54 (July):568–82. doi:https://doi.org/10.1016/j.atmosenv.2012.02.062.
- Yatkin, S., K. Trzepla, N. Pauly Hyslop, W. H. White, O. Butler, T. Ancelet, P. Davy, M. Gerboles, S. D. Kohl, A. McWilliams, et al. 2020. Comparison of a priori and interlaboratory-measurement-consensus approaches for value assignment of multi-element reference materials on PTFE filters. Microchem. J. 158 (November):105225. doi:https://doi.org/10.1016/j.microc.2020.105225.
- Zhang, N., J. Cao, H. Kinfai, and H. Yuanqing. 2012. Chemical characterization of aerosol collected at Mt. Yulong in Wintertime on the Southeastern Tibetan Plateau. Atmos. Res. 107 (April):76–85. doi:https://doi.org/10.1016/j.atmosres.2011.12.012.