
 ?Mathematical formulae have been encoded as MathML and are displayed in this HTML version using MathJax in order to improve their display. Uncheck the box to turn MathJax off. This feature requires Javascript. Click on a formula to zoom.
ABSTRACT
In order to achieve prevention and control of air pollution through energy consumption adjustment in advance, the paper proposes an Fuzzy Cognitive Map (FCM) of various energy resources affecting air quality, an incremental prediction algorithm of FCM and gradient descending method used to learn the FCM based on the small sample data on various energy consumptions and concentration of air pollutants. The FCM as an interpretable prediction method not only can predict future air quality more accurately, but also can analyze and interpret the affecting of various energy types on the future air quality. As the time delay of various energy consumptions affecting concentration of air pollutants, the quantitative time sequence influencing relationships (causality) in the FCM is mined directly from these data, and the air quality affected by various types of energy consumptions is predicted based on the FCM. Accordingly, the energy types affecting air pollution can be obtained for prior decision of energy consumption structure adjustment. The experimental results in Beijing-Tianjin-Hebei show that the FCM modeling is better than Support Vector Regression (SVR), Linear Regression (LR), Principal Component Analysis (PCA)-based forecasting, Convolutional Neural Networks (CNN) and Long-Short Term Memory (LSTM) methods in predicting air quality affected by energy resources, meanwhile according to the interpretable prediction results of the FCM, we obtain some interesting results and suggestions on energy consumption types in Beijing-Tianjin-Hebei regions in advance.
Implications: At present, China’s air pollution control has entered the deep-water area, and the biggest challenge is how to adjust the energy (consumption) structure. Therefore, this study completed the two important tasks: (1) driven by small sample data of energy consumptions, the paper provides an interpretable prediction model and method with better performance to achieve prevention and control of air pollution through energy consumption adjustment in advance; (2) according to the interpretable prediction results, the paper obtains some interesting results used to guide energy consumption adjustment in Beijing-Tianjin-Hebei regions. This study will provide beneficial suggestions and strategies for air pollution prevention and control in Beijing-Tianjin-Hebei, will help improve the air quality and energy consumption structure in Beijing-Tianjin-Hebei, and also can be extended to other regions.
Introduction
According to related investigation and research, the pollutants monitored in air quality have extremely adverse effects on life and health (Guo et al. Citation2020; Rovira, Domingo, and Schuhmacher Citation2020; Wu et al. Citation2020; Zhao et al. Citation2020). As the capital economic circle of China, Beijing-Tianjin-Hebei’s air quality problems have aroused widespread concern. Although progress has been made in recent years and the ambient air quality is significantly improved in China, but there are still many serious problems such as PM exceeding national standard. With the continuous discussion and discovery of the influencing factors of air quality, it has been known that the root cause of air quality deterioration is the consumptions of various types of energy in China (Li, Hong, and Wang Citation2020; Wang, Wang, and Zhang et al. Citation2019; Zhai et al. Citation2021). So the key of pollution control is the adjustment of energy consumptions (Chen et al. Citation2021). There are studies on analyzing the impact of energy consumptions on air quality. However, they tend to ignore the delayed impact of energy consumptions on air quality. How to measure the impact of energy consumptions on delayed or future air quality is lacking.
At the same time, we should note that the measurement of the impact of energy consumptions on delayed or future air quality is of great significance. According to this measure, the prevention of future air quality in advance can be achieved through the adjustment of energy consumptions, rather than the prevention afterward. In other words, if air quality can be effectively predicted and the influence relationships of various energy resources on future air quality predicted also can be obtained, the energy consumptions can be adjusted in advance and the prevention of air quality can be analyzed in advance, which will provide important decision support for the prevention and control of urban air quality in advance, provide directional guidance for the adjustment of energy consumption structure, and help to improve regional air quality.
So the focus of the work is how to predict delayed or future air quality according to energy consumptions and quantify the impact of energy consumptions on the air quality. The work is interpretable prediction, which can achieve effective prediction and explain the reasons for this prediction result. At present, the studies on theory and method on interpretable prediction has aroused widespread concern (Kraus and Feuerriegel Citation2019; Langone, Cuzzocrea, and Skantzos Citation2020; Liu et al. Citation2020; Vanberlo et al. Citation2021). At present, the studies on theory and method on interpretable prediction has aroused widespread concern (Kraus and Feuerriegel Citation2019; Langone, Cuzzocrea, and Skantzos Citation2020; Liu et al. Citation2020; Vanberlo et al. Citation2021). On the one hand, the “black box” deep learning model has made great progress in prediction, but lack of interpretability, on the other, the existing interpretable model lacks good prediction effect, such as regression model. Therefore, how to get more accurate air quality prediction and explain the causes of pollution from the perspective of energy has become a key problem of the study.
And the data of energy consumptions and air quality monitored provide a quantitative basis for the interpretable prediction. But there is granularity inconsistency between energy consumptions data and air quality data for a region. For example, the basic granularity of energy consumption is annual. It is difficult to obtain fine-grained various energy consumptions data to a region. While the basic granularity of air quality data is hour. To achieve the consistency of data granularity and the modeling of the relationship between them, annual data and modeling the relationship between the annual data are reasonable, which leads to a small sample size. Based on the small sample data of energy consumptions and air quality, how to realize this interpretable prediction has become the key of this study.
To this end, this paper puts forward and proves the effectiveness of an FCM model and its method based on small sample data to predict air quality and analyze the energy structure based on the air quality in Beijing-Tianjin-Hebei regions.
Literature review
At present, there are lots of studies on prediction of air quality and analysis of pollution sources, which are mainly reflected in aspects: numerical simulation of air quality, emission inventory of pollution sources, source apportionment of air pollutant, and machine learning methods on air quality and energy.
Numerical simulation of air quality
Numerical simulation is based on known basic theory of atmospheric physics and chemistry only for air quality prediction. It can predict or evaluate pollutants through physicochemical principle in the atmosphere. Beig et al. (Citation2021) introduced an air quality framework (SAFAR), which is designed based on WRF-Chem with a capability of three days advance forecast in four Indian megacities of distinct environment and topography. The model prediction results are reasonable through testing for the pilot year 2019–2020. Rafael et al. (Citation2021) proposed three numerical simulation methods, which are applied over two distinct European urban areas, the Aveiro region in Portugal and Bristol in the United Kingdom, for the simulation of NO2 and PM10 annual consumption. It is suitable for predicting the concentration of pollutants in air quality by simulating the temporal and spatial evolution of the pollutants.
Emission inventory of air pollution sources
Emission inventory is used to trace and analyze the sector pollution sources affecting air pollution. A reliable and latest source emission inventory is important. However, the establishment of source emission inventory is a time-consuming and labor-consuming work, which is hard to be updated in time. Cui, Lei, and Bo et al. (Citation2020) analyzed the main emission source types (fixed combustion source, traffic source, living source, etc.) affecting air quality in Hainan Province based on emission inventories. Hu et al. (Citation2021) established a high-resolution emission inventory of typical pollution sources including stationary source, mobile source, and oil and gas storage and transportation source. Bang et al. (Citation2018) conducted a detailed air pollution emission inventory, studied the formation of the air pollution plume over Can Tho city, and found that transportation and industrial activities are the two main emission sources responsible for air pollutants. So the emission inventories are mainly for industrial analysis and lack to establish a relationship with various energy consumptions.
Source apportionment of air pollutant based on receptor model
Source apportionment offers an efficient way to identify emission sources and the contributions to air pollutant. The common methods of source apportionment based on receptor model include chemical mass balance, positive matrix factor analysis and so on. Faisal et al. (Citation2021) used positive matrix decomposition to determine the pollution sources of eight harmful heavy metals in street dust of Zhengzhou City, China. The results yielded the main sources are vehicular exhaust, coal combustion, metal industry and anthropogenic activities respectively. Xu et al. (Citation2021) studied the fine particulate matter based on chemical mass balance, and found that the seven main sources of fine OC were industrial, residential coal, biomass combustion, gasoline vehicles, diesel vehicles, cooking and plant debris. Zhang et al. (Citation2021) combined chemical mass balance model and the Community Multiscale Air Quality modeling system (CMAQ) model for more elaborate emission sources categories. It can be seen that the source apportionment can be used to analyze energy source that pollutants come from, but do not for prediction.
Machine learning on air quality and energy
Machine learning methods based on linear regression models are often used to explore the impact of energy, social or other factors on air quality. He et al. (Citation2020) used static and dynamic panel regression to measure the effect of energy consumptions on air quality of 20 heavily polluted cities in the Yangtze River Delta of China. Guo, Ren, and Li (Citation2020) establishes a regression model for the long-term relationship between air pollutant emission, heating capacity, coal, and power consumption with the data in Beijing-Tianjin-Hebei during the heating season from 2004 to 2017. Wang, Li, and Zhou (Citation2019) established the threshold regression models between air quality and the factors that impact atmospheric pollutants. These factors are the energy consumption structure, energy intensity, economic growth, population, industrial structure, and FDI (Foreign Direct Investment) based panel data from 2000 to 2016 for all Chinese provinces. The methods can only be used to establish a relationship between one pollutant in air quality and energy resources at a time, lack to time sequence multivariate prediction, cannot show the influence on multiple pollutions monitored at next time and have low prediction performance.
Machine learning methods based on nonlinear mechanisms need to be based on a large amount data and good at prediction of air quality due to their ability and high efficiency in the modeling of complex relations. Shams et al. (Citation2021) compared the performance of Multi-Linear Regression (MLR) and Multi-Layer Perceptron (MLP) for predicting SO2 concentration in the air of the Tehran, the results show that ANN based on MLP has far better prediction performance than MLR, that the value of the one-day time delay, park indicator, season/year, and the total area parks were the main factors influencing SO2 concentration based on sensitivity analysis. Ebrahimi-Khusfi et al. (Citation2021) predicted the PM10, PM2.5, SO2, NO2, CO, and O3 of air quality in Isfahan metropolis, central Iran using the Support Vector Regression (SVR) model with and without applying wavelet transformation, and the results indicated that the Wavelet-SVR model resulted in improving the performance of prediction compared to the SVR model, used permutation feature importance method to explore the contribution of input features on the prediction accuracies, but did not establish the relationship of energy and air quality. Kaya and Öğüdücü (Citation2020) determined PM10 as the target pollutant and designed a new deep learning-based air quality forecasting model, namely DFS (Deep Flexible Sequential). Chang et al. (Citation2020) proposed an Aggregated Long Short-Term Memory (LSTM) model (ALSTM), which combined local air quality monitoring station, the station in nearby industrial areas, and the stations for external pollution sources to improve prediction accuracy. At present, the learning methods mainly aimed at big data of air quality and the method of permutation feature importance also is based on machine learning methods to measure the importance of features. So to the small samples of energy consumptions, the machine learning methods are so difficult to be applied that the feature importance measurement method based on them cannot get features interpretation.
The above researches are either from the perspective of physical and chemical principle or from the perspective of data. The existing research on the impact of energy on air quality is only to predict or analyze a single pollutant, and lacks the consideration of the temporal influence of energy on air quality.
FCM model and its application in air quality and energy
In 1986, on the basis of cognitive map of Kosko (Citation1986) proposed fuzzy cognitive map (FCM), in which three valued logical relationship between concepts is extended to the fuzzy relationship of interval [−1,1]. FCM topology is a directed graph, where node represents one concept, and the arcs between nodes are defined as causality between concepts. The causality means the time sequence influence relationships. Each node and arc has strong cognitive semantics, which is very intuitive to express problems.
The construction of FCM can be automatically completed by means of machine learning algorithms. And the comparisons of FCM are shown in . At present, the learning algorithms, such as multitasking multiobjective memetic algorithm, SigAFE algorithm, genetic algorithm and so on, are applied to the constructions of FCMs. These algorithms of FCM are mostly to solve large-scale tasks. Yang and Liu (Citation2019) combines multi-agent genetic algorithm with niche method to learn multiple FCMs at the same time. Shen, Liu, and Wu (Citation2020) introduced the evolutionary multitasking framework to learn different FCMs at one time by taking each FCM learning problem as a task. The result shows that the proposal can learn large-scale FCMs with low errors in a fast convergence speed. Wang et al. (Citation2021) used evolutionary multitasking framework to overcome the proposed multitasking FCM learning problem. Bud the improvements of FCM are rarely used for small sample data. Therefore, there is still much space for exploring FCM algorithms.
Table 1. Comparisons of FCM.
As a knowledge representation and system modeling method to express the causal relationship between system concepts, FCM model is suitable for interpretable and predictive modeling, and has been widely used in many fields such as transportation industry (Bağdatli and Dokuz Citation2021) construction industry (Kazerooni, Nguyen, and Fayek Citation2021), ceramics industry (Vidal et al. Citation2015) and so on. There are studies for air quality prediction based on FCM model. For example, the studies(Anezakis, Dermetzis, and Iliadis et al. Citation2016; Peng, Liu, and An Citation2020) established the model between air pollutants and weather conditions based on FCM, and got better prediction performance in consumption of pollutants and influences of air quality based on large data of air quality and weather conditions. Bakhtavar et al. (Citation2020) developed an approach based on a multi-layer artificial neural network and fuzzy cognitive map to simultaneously predict the vertical and horizontal distribution of blast-induced dust emissions. The result shows good predict performance and the quantitative effects on the dust distribution. In addition, there are studies for the relationships between some factors and energy. Pereira et al. (Citation2020) combined fuzzy cognitive mapping and the system dynamics approach to analyze energy-change effects on the sustainability of small and medium-sized enterprises. Tu et al. (Citation2021) construct an FCM framework that incorporates the urban residential expenditure and sectoral energy consumption to reveal how these indicators are influencing each other. De Salazar and Sanz-Calcedo (Citation2019) are aimed at performing a qualitative analysis of the effect of maintenance intensity on energy consumption, energy costs and emissions in healthcare centers. In conclusion, FCM model is rarely used to study the impact of energy on air quality. The possible reason is that the time granularity of energy and air quality data is very different. After integration, the available samples are very small, so it is difficult to do this research based on these data.
Summary
The fundamental reason that really affects air quality is energy consumption. How to reduce pollution by adjusting energy structure is a key and powerful way to improve air quality. There are two difficulties to study the impact of energy on air quality. One is the small sample of energy data, and the other is the impact of energy on air quality is lagging. Therefore, how to solve these two difficulties is an urgent problem to be solved in the study of the impact of energy on air quality.
The emission inventory and source allocation are traditional air quality analysis or prediction methods, but they cannot realize the analysis of future air quality. Machine learning method is usually used to predict the impact of various factors on air quality, but it is difficult to apply to the prediction of small samples. FCM model is now mature and applied in many fields. It can realize effective prediction and explain the reasons for this prediction results. FCM is still developing and there are still many problems to be improved. The comparisons of these methods are shown in .
Table 2. Comparisons of methods on air quality prediction and resources analysis.
Based on this, we establish the fuzzy cognitive relationship between energy consumption and future air quality, find the relationship between energy consumption and future air quality driving by data, effectively predict the air quality according to the relationships, and analysis the impact of energy on future air quality. And we improve the accuracy of prediction based on small sample data using gradient descent method and incremental learning algorithm of FCM. Then, suggestions on the existing energy structure and energy consumption are put forward to improve the air quality in the future.
Our target use case is to use various energy data to predict air quality and explain the prediction results. There are two main values of the contribution. One is to improve the accuracy of prediction based on small sample data using gradient descent method and incremental learning algorithm of FCM. The other is to help to adjust the energy structure and then improve the air quality according to the predicted air quality results.
The innovation of this paper is mainly reflected in three aspects.
(1) The FCM model of energy and future air quality is established based on the time series relationships between various energy resources and air pollutants.
(2) Based on gradient descent method and incremental learning algorithm of FCM, the accuracy of air quality prediction is improved based on small samples.
(3) The impact of energy on future air quality is mined. Based on this, the energy structure of Beijing, Tianjin and Hebei is analyzed and explained from the perspective of air quality.
Methods
Scheme of air quality interpretable prediction affected by energy resources
The research scheme is shown in , which mainly the following steps to achieve various energy resources analysis in advance based on air quality prediction.
Figure 1. The procedure of the research.
Firstly, the data of various energy consumptions and air quality (SO2, NO2, and PM2.5) are collected separately. Then these data are preprocessed to time series data with same granularity shown in Data and Data preprocessing. And the relationship of various energy consumptions at t-1 time corresponding to air pollutants at t time is established.
The next step is the most critical, which is to model FCM of energy resources influencing air quality shown in FCM model of energy resources affecting air quality. It includes construction and optimization of the FCM. The influence of energy resources on future air quality can be obtained by the FCM model for the interpretation in energy structure of Beijing-Tianjin-Hebei. The interpretation is shown in Interpretation of energy resources in Beijing-Tianjin-Hebei.
Finally, the FCM model can be used for prediction of air quality based on the data processed shown in FCM prediction of air quality affected by energy resources. And the method is applied to predict air quality of Beijing-Tianjin-Hebei, whose prediction results are shown in Prediction of air quality affected by energy resources in Beijing-Tianjin-Hebei.
FCM model of energy resources affecting air quality
The establishment of FCM model includes two important procedures that are FCM construction of energy resources affecting air quality and FCM optimization of energy resources affecting air quality. The former is to establish the structure of the FCM, and the latter is to optimize the weights of the FCM.
FCM construction of energy resources affecting air quality
The FCM construction includes the cognition of nodes and the solution of causality. The cognition of nodes is to identify the cause nodes and the result nodes in air quality and various energy resources. In the research, the cause nodes indicate various types of energy and the result nodes point to various pollutants in air quality. The causality expresses the time series impact of various energy consumptions affecting air quality. The air quality at t time is impacted by various energy consumptions and air quality at t-1 time.
As shown in , the nodes on the bottom are various types of energy, and their states are the annual average consumptions of the energy resources. The nodes on the above point to these pollutants in air quality, and their states are the average annual concentration of these pollutants.
Figure 2. FCM structure of various types of energy resources affecting air quality.
The FCM as EquationEq. (1)(1)
(1) represents the impact of energy consumptions at t-1 time to the air quality at t time.
Where is the prediction concentration state of air pollutant
at t time,
and
are the actual consumptions state of air pollutant
and energy
at t-1 time,
represents the causal relationship of energy
to air pollutant
,
is an activation function or state transformation function, which can be Sigmoid-type function in EquationEq.(2
(2)
(2) ), tanh function in EquationEq.(3)
(3)
(3) or Relu function in EquationEq.(4)
(4)
(4) . By the activation of the function, the state air quality transforms from the time t-1 to the time t.
The causality weights in FCM represent the interpretation of energy consumptions affecting air quality. The interpretation is the time sequence influence (causality) of energy on air quality.
represents that there is a positive relationship of energy
to air pollutant
, that is to say, the increase of
on behalf of the energy consumption state will cause the increase of
on behalf of concentration state of air pollutant.
represents that there is a negative relationship of energy
to air pollutant
, that is to say, the increase of
on behalf of the energy consumption state will cause the decrease of
on behalf of concentration state of air pollutant.
represents that there is no relationship of energy
to air pollutant
.
The states of all nodes form a time-series state space. The relationships among these nodes construct a matrix
. And the state space of FCM is automatically propagated by the initial condition vector
through the transformation function
. This propagation based on the FCM model is used to display and predict the dynamic behavior evolution of a complex system.
FCM optimization of energy resources affecting air quality
The section is to quantitatively optimize the causality based on the FCM driven by the data, which is the key for interpreting the influence and improving prediction performance of air quality. At present, the optimization method of FCM for the parameter
is mainly based on various learning algorithms. In the paper, driven by the small sample and multidimensional time series data of various energy consumptions and air pollution concentration, the optimization of weights in the FCM is obtained based on gradient descent method.
The goal of FCM optimization is to minimize the difference between the actual concentration value of air pollutant in air quality and the concentration
predicted as EquationEq.(1)
(1)
(1) . The actual value is standardized value of original data as EquationEq.(5)
(5)
(5) . The minimized goal is shown as EquationEq.(6)
(6)
(6) .
The optimization of weights can be deduced based on gradient descent method as EquationEq.(7)(7)
(7) and EquationEq.(8)
(8)
(8) in order to search the optimal solution according to the goal function as EquationEq.(6)
(6)
(6) . The variation of weight will be computed according to EquationEq.(7)
(7)
(7) and the weight will be constantly updated by adding the gradient value as EquationEq.(8
(8)
(8) ), where
is a step length. The optimal weight can make it reach the minimum goal as EquationEq.(6)
(6)
(6) .
The detail optimization procedure is shown in , which includes two main procedures. The first is the preparation for the optimization in line 1. The preparation is to randomly initialize the weights of the FCM construction.
Table
The second is to optimize the weights from line 2 to line 7. The optimization is to update the repeatedly based on the gradient descent method shown in EquationEq.(7)
(7)
(7) and EquationEq.(8)
(8)
(8) until reaching minimum value of the goal in a limited number of cycles. The optimal weights can be used to interpret the impact of various energy resources on air quality.
FCM prediction of air quality affected by energy resources
After the FCM model of energy resources affecting air quality is established, the prediction value of air quality can be inferred by EquationEq.(1)
(1)
(1) according to the weights optimized and data processed.
Because of the standardization of data shown as EquationEq.(5(5)
(5) ), the state predicted need to be de-standardized as EquationEq.(9)
(9)
(9) . We can get the corresponding original value
of the prediction state
.
The error of prediction can be computed by the root mean square error of as EquationEq.(10)
(10)
(10) .
We designed an incremental prediction algorithm of FCM shown as . The algorithm includes two sections. First section is to predict air pollution according to the existing data from line 1 to line 4. Second section is to add the predicted value to the dataset for the prediction at next time in line 5. Before the next prediction, the FCM model needs to be trained based on the incremental dataset from line 6 to line 7.
Table
Experiments and results
Data and data preprocessing
In order to achieve energy consumptions analysis in advance based on the prediction of air quality, the data of air quality and energy consumptions are collected and acquired separately, and then to be integrated as a whole. The data statistics are shown in .
Table 3. Data statistics.
In the process of data integration, we deal with three aspects, which are the difference of time granularity, the time delay problem, and the difference of data magnitude. To the difference of time granularity, considering the availability of energy data, we unify energy and air quality into the annual time granularity. The data of air quality is annual average concentration of various pollutants. To the time delay problem, the air quality at t time is corresponded to the energy consumptions at t-1 time. To the difference of these data magnitude, the time series data are standardized by Z-score, as shown in Eq.(5), where μ and σ are the mean value and standard deviation of the original data , and
represents the actual activated state of the standardized concept
at
.
Prediction of air quality affected by energy resources in Beijing-Tianjin-Hebei
Prediction of air quality based on the FCM in Beijing-Tianjin-Hebei
Based on the FCM of energy resources affecting air quality, the prediction of air quality from 2011 to 2017 is carried out, respectively. We tried different transformation functions of EquationEq.(2(2)
(2) ), EquationEq.(3)
(3)
(3) and EquationEq.(4)
(4)
(4) to be applied to the FCM for the prediction of air quality in Beijing-Tianjin-Hebei regions. The root mean square error (RMSE) is used to measure the errors between concentration predicted of air pollutants and actual air quality monitored, which are shown in .
Table 4. Air quality prediction errors (RMSE) of Beijing-Tianjin-Hebei regions based on FCM with different transformation function.
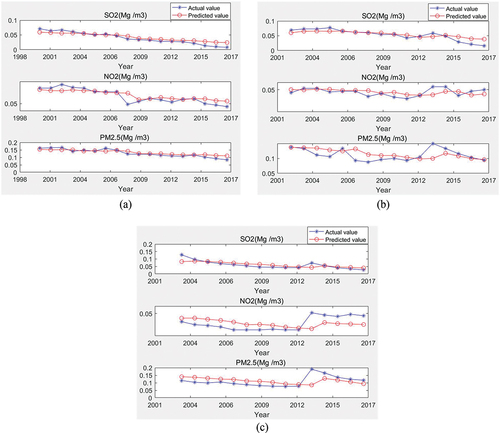
It can be seen that the tanh transformation function in the FCM has better prediction effect than sigmoid and relu functions on the whole. gives the comparisons of concentration predicted of air pollutants and actual value of air pollutants using tanh transformation function of the FCM in Beijing-Tianjin-Hebei from 2011 to 2017.
Figure 3. The predicted value and actual value of air pollutants in Beijing-Tianjin-Hebei.
Prediction comparisons of air quality affected by energy resources in Beijing-Tianjin-Hebei
In order to further verify the model and prediction effect of FCM, we compare the FCM and the following classical methods for interpretable prediction based on small sample data.
SVR (Support Vector Regression) method is suitable for small sample prediction. In SVR method, Gaussian function and RBF kernel function are used to optimize the parameters (c, gamma) of data sets to reduce the error for the best effect. The method is only used to predict not for interpretation.
LR (Linear Regression) method is suitable for interpretable prediction of one target, which are selected and compared with the time series interpretable prediction method (FCM) of multivariate targets in this study.
CNN (Convolutional Neural Networks) is one of the representative algorithms of deep learning, a kind of feed forward neural networks with depth structure including convolution calculation. It is suitable for large sample training and learning.
LSTM (Long-Short Term Memory) is a time recursive neural network, which is suitable to predict time series based on large data learning.
PCA (Principal Component Analysis) is used for dimensionality reduction of high-dimensional data. The PCA-based forecasting achieves prediction using LR method based on the converted low-dimensional features through PCA. PCA-based forecasting only establishes the relationships between one target predicted and features converted, not original features. So it is impossible to interpret the impact of various energy resources (original features) on air quality (target features predicted).
The comparisons of prediction results based on different methods including FCM with tanh function, SVR, LR, CNN, LSTM and PCA-based forecasting are shown in .
Table 5. Air quality prediction results of Beijing-Tianjin-Hebei regions based on different methods.
From the results, FCM has the following advantages:
Firstly, from FCM itself, different functions lead to different prediction errors, where the prediction effect of tanh transformation function is best.
Secondly, from the perspective of the methods, SVR, LR and PCA-based forecasting are only suitable for predicting one dimension at a time, and their multidimensional prediction results are got separately, while FCM, CNN and LSTM can achieve multi-dimensional prediction at a time.
Thirdly, from the perspective of prediction effect, generally the prediction error of FCM is less than that of SVR, LR, PCA-based forecasting, CNN and LSTM based on the small sample data, and the prediction effect is best.
Finally, from the perspective of interpretability, FCM, LR and PCA-based forecasting methods can analyze the impacts, but LR can only be used to explain the impact of various energy resources on one pollutant at a time, while PCA-based forecasting can only be used to explain the impact of features converted from original energy resources on one pollutant at a time. SVR, CNN and LSTM cannot.
Interpretation of energy resources in Beijing-Tianjin-Hebei
Interpretation of various energy consumptions trend in Beijing-Tianjin-Hebei
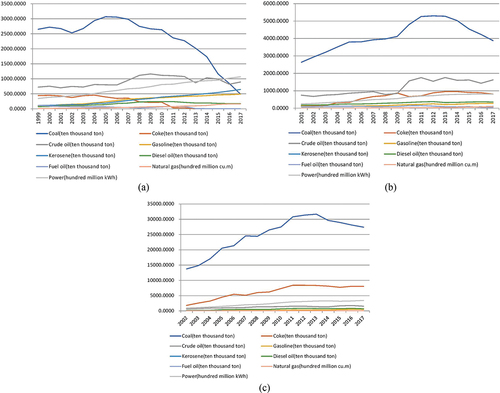
shows the energy consumptions of Beijing-Tianjin-Hebei in recent 20 years. It can be seen that coal is the main energy in Beijing-Tianjin-Hebei in recent years. From the perspective of evolution trend, the reduction of coal consumption in Beijing is far greater than that in Tianjin and Hebei. Since 2015, the main energy resources in Beijing are electricity, crude oil, kerosene and coal; The main energy resources of Tianjin area are coal, crude oil, coke and electric power from more to less; The main energy resources in Hebei region are coal, coke, electricity and crude oil.
Figure 4. Energy consumption trend of Beijing-Tianjin-Hebei.
Taking energy consumption in 2013 as an example, the energy consumption of Beijing-Tianjin-Hebei was 442.7 million tons of standard coal, accounting for 10.36% of the total national energy consumptions, which is the focus of China’s energy consumptions.
In terms of varieties, coal consumption was 389.61 million tons, accounting for 9.01% of the total coal consumptions in China; Oil consumption was 45.12 million tons, accounting for 8.85% of China’s total oil consumptions; Natural gas consumption was 18.7 billion cubic meters, accounting for 11.31% of the total national natural gas consumptions; Electricity consumption was 495.4 billion kilowatt hours, accounting for 9.21% of China’s total electricity consumptions.
From different regions, Hebei consumed 296.64 million tons of standard coal, accounting for 6.94% of the total national energy consumptions and 67.01% of the total energy consumptions in Beijing-Tianjin-Hebei regions. Energy consumption in Tianjin was 78.82 million tons of standard coal, accounting for 1.84% of the total national energy consumptions, and 17.80% of the total energy consumptions in Beijing -Tianjin-Hebei regions. Beijing’s energy consumption was 67.24 million tons of standard coal, accounting for 1.57% of the total national energy consumptions and 15.19% of the total energy consumptions in Beijing-Tianjin-Hebei regions.
In terms of varieties and regions, the coal consumption of Hebei was 316.63 million tons, accounting for 7.33% of the total coal consumptions of the whole country, and 81.27% of the total coal consumptions of Beijing-Tianjin-Hebei regions. The proportion of coal consumption was far higher than the national average level. Oil consumption was relatively uniform, with Beijing-Tianjin-Hebei regions accounting for about one-third of the total. Beijing’s natural gas consumptions was 9.9 billion cubic meters, accounting for 6.00% of the total national natural gas consumptions and 53.00% of the total natural gas consumptions in Beijing-Tianjin-Hebei regions, with a high proportion of clean energy. Hebei’s industrial structure was dominated by heavy chemical industries such as energy and raw materials. Affected by these industries, Hebei’s electricity consumption was 325.1 billion Kwh, accounting for 6.05% of the total electricity consumptions in China and 65.62% of the total electricity consumptions in Beijing-Tianjin-Hebei regions.
Interpretation of energy resources affecting air quality
FCM modeling method can quantitatively find the degree of causal impact of energy consumptions on air quality from the data. Based on the annual time series data of energy consumptions and air quality of Beijing-Tianjin-Hebei, this study selects the data from 1999 to 2010 as training samples and the data from 2011 to 2017 as testing samples, and obtains the causality matrix of Beijing-Tianjin-Hebei separately based on the mining method of FCM, as shown in .
Table 6. Affecting of energy resources on air quality in Beijing.
Table 7. Affecting of energy resources on air quality in Tianjin.
Table 8. Affecting of energy resources on air quality in Hebei.
Discussion of energy resources affecting air quality in Beijing-Tianjin-Hebei
Discussion of energy resources affecting air quality in Beijing
It can be seen from that in general the consumptions of coke and fuel oil in Beijing have a great positive impact on the concentration increase of pollutants in bold. However, the consumptions of natural gas and gasoline have a significant negative effect on the concentration increase of PM2.5 and SO2 separately in black italics of .
Energy consumption is a key factor affecting air quality in Beijing (Luo, Li, and Hu Citation2019). Although in Beijing the consumption of coke or fuel oil shows a downward trend year by year and very few as , from the causality of energy consumptions on air quality in Beijing, coke is the top positive effect on the concentration increase of air pollutants, especially SO2 and NO2. The consumptions of coke and fuel oil are mainly used in industries, and industrial pollution has a great impact on the winter haze in Beijing (Lin et al. Citation2016). Therefore, Beijing still needs to pay great attention to the impact of pollutants from industry.
And Beijing can decrease the concentration of PM2.5 or SO2 of air quality by using certain natural gas or gasoline instead of coke. In addition, the measures of increasing the preheating temperature of coke and using new clean coke can be used to reduce the emission of pollutants in Beijing. Increasing the preheating temperature of coke can promote the reduction of NOx and the burnout of carbon. The higher the preheating temperature, the greater the reduction of NOx (Xiong et al. Citation2021). The replacement of current residential coal with a new type of clean coke is a facile method for reducing gaseous pollutant emissions from household activities to protect the atmospheric environment (Liu et al. Citation2019).
Discussion of energy resources affecting air quality in Tianjin
In Tianjin, coal is the top influencing factor of energy resources on air quality, followed by natural gas in bold. While the consumptions of coke and kerosene have a negative effect on the concentration of pollutants in black italics of .
We can see that the consumption of coal in Tianjin is biggest in Beijing- Tianjin-Hebei region from . And the coal is also the most harmful to air quality, especially to the concentration of PM2.5 in Tianjin that can be seen in .
Tianjin should pay special attention to the control and replacement of coal for further improvement of air quality because residents’ coal combustion affects the air quality of Beijing, Tianjin and Hebei (Xiurui et al. Citation2018). And after the implementation of the coal ban policy, the emissions of SO2, NOx, Co, VOCs, PM10 and PM2.5 in Beijing, Tianjin and Hebei can be reduced by 20–40%, and various pollutants emitted by industrial boilers can be significantly reduced (Li et al. Citation2018).
Discussion of energy resources affecting air quality in Hebei
Kerosene is the top influencing factor of energy resources on air quality in Hebei, followed by coal in bold. But the consumption of natural gas has a negative effect on the consumption of the pollutants in black italics of .
Although in Hebei the consumption of Kerosene is relatively few and shows an upward trend year by year on the whole as , it can increase the pollution especially NO2. Although in Hebei the consumption of natural gas is an upward trend year by year, the use of natural gas can decrease the pollution in Hebei. Residents’ coal combustion affects the air quality of Beijing, Tianjin and Hebei (Xiurui et al. Citation2018), and reducing coal consumption can effectively reduce air pollution in Beijing, Tianjin and Hebei (Li et al. Citation2018).
Hebei should use a certain amount of natural gas instead of kerosene and coal. Replacing coal with gas sources other than coal-based synthetic natural gas (SNG) generally offers national air quality–carbon–water co-benefits (Qin et al. Citation2018), and natural gas and its infrastructure can reduce greenhouse gas emissions and improve regional air quality (Mac Kinnon, Brouwer, and Samuelsen Citation2018).
Conclusion
The advantage of the FCM model is that it can predict the unknown samples well and give an explanation to the prediction results based on small sample data. In energy analysis based on air quality multi-dimensional series prediction driven by small samples, FCM model is better than SVR, LR, CNN, LSTM and PCA-based forecasting. The results show that fuel oil, coal, coke and crude oil are closely related to the air quality in Beijing-Tianjin-Hebei, which are the main types of energy consumptions in the regions. According to the energy types, it can be concluded that the resources with the greatest impact on air quality in Beijing-Tianjin-Hebei is the pollution discharge of industrial enterprises. Specifically, Beijing can improve air quality by controlling the use of coke and fuel oil in the future, coal and natural gas are the key energy sources affecting the concentration of SO2 and NO2 in Tianjin, and a certain amount of natural gas can be used instead of kerosene and coal for Hebei Province.
In the future, we will study the interaction between different regions, further guide the adjustment of energy structure, strengthen joint prevention and control in advance, and achieve the goal of reducing air pollution. Air quality is affected by many factors, and other factors are expected to be added to the pollution forecast.
Data Availability Statement
Please refer to the National Bureau of statistics (https://data.stats.gov.cn/) for energy production and consumptions data; Beijing Municipal Ecology and Environment Bureau (sthjj.beijing.gov.cn/) for air pollution.
Disclosure statement
No potential conflict of interest was reported by the author(s).
Additional information
Funding
Notes on contributors
Zhen Peng
Zhen Peng received the Ph.D. degree in computer application technology from the University of Science and Technology. She is currently a Professor with Beijing Institute of Petrochemical Technology. Her current research interests include data mining and fuzzy cognitive maps, with special interests in air pollution analytics.
Caixiao Zhang
Caixiao Zhang’s main research direction is data analysis and data mining of air pollution.
Boyang Cao
Boyang Cao’s main research direction is data analysis and game anlaysis of air pollution.
Zitao Hong
Zitao Hong mainly studies the field of air pollution and is good at analyzing air pollution through machine learning or deep learning methods.
Xue Han
Xue Han graduated from research Center for Eco-Environmental Sciences, Chinese Academy of Sciences and is good at eco-environmental analysis and research.
References
- Anezakis, V. D., K. Dermetzis, L. Iliadis, and S. Spartalis 2016. Fuzzy cognitive maps for long-term prognosis of the evolution of atmospheric pollution, based on climate change scenarios: The case of Athens. Switzerland: Springer International Publishing.
- Bağdatli, M. E. C., and A. Ş. Dokuz. 2021. Modeling discretionary lane-changing decisions using an improved fuzzy cognitive map with association rule mining[J]. Transp. Lett. 13 (8):623–33. doi:10.1080/19427867.2021.1919469.
- Bakhtavar, E., S. Hosseini, K. Hewage, and R. Sadiq. 2020. Green blasting policy: Simultaneous forecast of vertical and horizontal distribution of dust emissions using artificial causality-weighted neural network. J. Clean. Prod. 283:124562. doi:10.1016/j.jclepro.2020.124562.
- Bang, H. Q., V. Khue, N. T. Tam, and K. Lasko. 2018. Air pollution emission inventory and air quality modeling for Can Tho City, Mekong Delta, Vietnam. Air Quality, Atmosphere & Health 11 (1):35–47. doi:10.1007/s11869-017-0512-x.
- Beig, G., S. K. Sahu, V. Anand, S. Bano, S. Maji, A. Rathod, N. Korhale, S. B. Sobhana, N. Parkhi, and P. Mangaraj. 2021. India’S Maiden AIR QUALITY forecasting framework for megacities of divergent environments: The safar-project. Environ. Model. Softw. 145:105204. doi:10.1016/j.envsoft.2021.105204.
- Chang, Y., H. Chiao, S. Abimannan, Y.-P. Huang, Y.-T. Tsai, and K.-M. Lin. 2020. An LSTM-based aggregated model for air pollution forecasting. Atmos Pollut Res 11 (8):1451–63. doi:10.1016/j.apr.2020.05.015.
- Chen, Y., C. W. Y. Wong, R. Yang, and X. Miao. 2021. Optimal structure adjustment strategy, emission reduction potential and utilization efficiency of fossil energies in China. Energy 237:121623. doi:10.1016/j.energy.2021.121623.
- Cui, J., T. Lei, X. Bo, P. Wu, J. Qu, S. Gao, Tian, F., and S. Li 2020. Studies on air pollutant emission inventory and environmental impact in Hainan Province. Environ. Pollut. Prevent 6:651–59. doi:10.15985/j.cnki.1001-3865.2020.06.001.
- De Salazar, E. M., and J. G. Sanz-Calcedo. 2019. Study on the influence of maintenance operations on energy consumption and emissions in healthcare centres by fuzzy cognitive maps. J. Build. Perform. Simul. 12 (4):420–32. doi:10.1080/19401493.2018.1543351.
- Ebrahimi-Khusfi, Z., R. Taghizadeh-Mehrjardi, M. Kazemie, and A. R. Nafarzadegan. 2021. Predicting the ground-level pollutants concentrations and identifying the influencing factors using machine learning, wavelet transformation, and remote sensing techniques. Atmos Pollut Res 12 (5):101064. doi:10.1016/j.apr.2021.101064.
- Faisal, M., Z. Wu, H. Wang, Z. Hussain, and C. Shen. 2021. Geochemical mapping, risk assessment, and source identification of heavy metals in road dust using Positive Matrix Factorization (PMF). Atmosphere 12 (5):614. doi:10.3390/atmos12050614.
- Guo, X., D. Ren, and C. Li. 2020. Study on clean heating based on air pollution and energy consumption. Environ. Sci. Pollut. Res. 27 (6):6549–59. doi:10.1007/s11356-019-07093-8.
- Guo, H., J. Wei, W. Li, H. C. Ho, Y. Song, J. Wu, and W. Li. 2020. Do socioeconomic factors modify the effects of PM1 and SO2 on lung cancer incidence in China? Sci. Total. Environ. 756:143998. doi:10.1016/j.scitotenv.2020.143998.
- He, L., F. Yin, D. Wang, X. Yang, and F. Xie. 2020. Research on the relationship between energy consumption and air quality in the Yangtze River Delta of China: An empirical analysis based on 20 sample cities. Environ. Sci. Pollut. Res. 2019. 27 (5):4786–98. doi:10.1007/s11356-019-06984-0.
- Hu, X., Q. Liu, Q. Fu, H. Xu, Y. Shen, D. Liu, Y. Wang, H. Jia, and J. Cheng. 2021. A high-resolution typical pollution source emission inventory and pollution source changes during the COVID-19 lockdown in a megacity, China. Environ. Sci. Pollut. Res. 28 (33):45344–52. doi:10.1007/s11356-020-11858-x.
- Kaya, K., and Ş. G. Öğüdücü. 2020. Deep flexible sequential (DFS) model for air pollution forecasting. Sci Rep 10 (1):3346. doi:10.1038/s41598-020-60102-6.
- Kazerooni, M., P. Nguyen, and A. R. Fayek. 2021. Prioritizing construction labor productivity improvement strategies using fuzzy multi-criteria decision making and fuzzy cognitive maps[J]. Algorithms 14 (9):254. doi:10.3390/A14090254.
- Kosko, B. 1986. Fuzzy cognitive maps. Int. J. Man Mach. Studies 24 (1):65–75. doi:10.1016/S0020-7373(86)80040-2.
- Kraus, M., and S. Feuerriegel. 2019. Forecasting remaining useful life: Interpretable deep learning approach via variational Bayesian inferences. Decis Support Syst 125:113100. doi:10.1016/j.dss.2019.113100.
- Langone, R., A. Cuzzocrea, and N. Skantzos. 2020. Interpretable anomaly prediction: Predicting anomalous behavior in industry 4.0 settings via regularized logistic regression tools. Data Knowl. Eng. 130 (3):101850. doi:10.1016/j.datak.2020.101850.
- Li, L., X. Hong, and J. Wang. 2020. Evaluating the impact of clean energy consumption and factor allocation on China’s air pollution: A spatial econometric approach. Energy 195:116842. doi:10.1016/j.energy.2019.116842.
- Li, X., J. Wu, M. Elser, T. Feng, J. Cao, I. El-Haddad, R. Huang, X. Tie, A. S. H. Prévôt, and L. Guohui. 2018. Contributions of residential coal combustion to the air quality inBeijing–Tianjin–Hebei (BTH), China: A case study[J]. Atmos. Chem. Phys. 18 (14). doi: 10.5194/acp-18-10675-2018.
- Lin, Y.-C., S.-C. Hsu, C. C.-K. Chou, R. Zhang, W. Yunfei, S.-J. Kao, L. Luo, C.-H. Huang, S.-H. Lin, and Y.-T. Huang. 2016. Wintertime haze deterioration in Beijing by industrial pollution deduced from trace metal fingerprints and enhanced health risk by heavy metals[J]. Environ. Pollut. 216:208. doi:10.1016/j.envpol.2015.07.044.
- Liu, S., J. Shangguan, S. Yang, W. Du, X. Yan, K. Zhang, and R. Rosa Plá. 2019. Producing effective and clean coke for household combustion activities to reduce gaseous pollutant emissions[J]. J. Chem. 2019. doi:10.1155/2019/7142804.
- Liu, D., L. Zhang, T. Luo, L. Tao, and Y. Wu. 2020. Towards interpretable and robust hand detection via pixel-wise prediction. Pattern Recognit 105:107202. doi:10.1016/j.patcog.2020.107202.
- Luo, M., J. Li, and S. Hu. 2019. Exploring regional air quality evolution by developing a driving force model: Case study of Beijing[J]. J. Environ. Manage. 248 (C):109333. doi:10.1016/j.jenvman.2019.109333.
- Mac Kinnon, M. A., J. Brouwer, and S. Samuelsen. 2018. The role of natural gas and its infrastructure in mitigating greenhouse gas emissions, improving regional air quality, and renewable resource integration[J]. Prog. Energy Combust. Sci. 64. doi:10.1016/j.pecs.2017.10.002.
- Peng, Z., W. Liu, and S. An. 2020. Haze pollution causality mining and prediction based on multi-dimensional time series with PS-FCM. Inf Sci (Ny) 523:307–17. doi:10.1016/j.ins.2020.03.012.
- Pereira, I. P. C., A. F. F. Ferreira, L. F. Pereira, K. Govindan, I. Meidutė-Kavaliauskienė, and R. J. C. Correia. 2020. A fuzzy cognitive mapping-system dynamics approach to energy-change impacts on the sustainability of small and medium-sized enterprises. J. Clean. Prod. 256:120154. doi:10.1016/j.jclepro.2020.120154.
- Qin, Y., L. Höglund-Isaksson, E. Byers, K. Feng, F. Wagner, W. Peng, and D. L. Mauzerall. 2018. Air quality–carbon–water synergies and trade-offs in China’s natural gas industry[J]. Nat. Sustain. 1 (4):505–11. doi:10.1038/s41893-018-0136-7.
- Rafael, S., V. Rodrigues, K. Oliveira, S. Coelho, and M. Lopes. 2021. How to compute long-term averages for air quality assessment at urban areas? Sci. Total. Environ. 795 (29):148603. doi:10.1016/j.scitotenv.2021.148603.
- Rovira, J., J. L. Domingo, and M. Schuhmacher. 2020. Air quality, health impacts and burden of disease due to air pollution (PM10, PM2.5, NO2 and O3): Application of AirQ+ model to the Camp de Tarragona County (Catalonia, Spain). Sci. Total Environ. 703:135538. doi:10.1016/j.scitotenv.2019.135538.
- Shams, S. R., A. Jahani, S. Kalantary, M. Moeinaddini, and N. Khorasani. 2021. The evaluation on artificial neural networks (ANN) and multiple linear regressions (MLR) models for predicting SO2 concentration. Urban Clim. 37:100837. doi:10.1016/j.uclim.2021.100837.
- Shen, F., J. Liu, and K. Wu. 2020. Evolutionary multitasking fuzzy cognitive map learning[J]. Knowledge-Based Systems 192 (C):105294. doi:10.1016/j.knosys.2019.105294.
- Tu, C., X. Mu, J. Chen, L. Kong, Z. Zhang, Y. Lu, and G. Hu. 2021. Study on the interactive relationship between urban residents’ expenditure and energy consumption of production sectors. Energy Policy 157:112502. doi:10.1016/j.enpol.2021.112502.
- Vanberlo, B., M. A. S. Ross, J. Rivard, and R. Booker. 2021. Interpretable machine learning approaches to prediction of chronic homelessness. Eng. Appl. Artif. Intell. 102:104243. doi:10.1016/j.engappai.2021.104243.
- Vidal, R., J. L. Salmeron, A. Mena, and V. Chulvi. 2015. Fuzzy cognitive map-based selection of TRIZ (Theory of inventive problem solving) trends for eco-innovation of ceramic industry products[J]. J. Clean. Prod. 107. doi:10.1016/j.jclepro.2015.04.131.
- Wang, S., C. Li, and Y. Zhou. 2019. Impact of China’s economic growth and energy consumption structure on atmospheric pollutants: Based on a panel threshold model. J. Clean. Prod. 236:117694. doi:10.1016/j.jclepro.2019.117694.
- Wang, C., J. Liu, K. Wu, and C. Ying. 2021. Learning large-scale fuzzy cognitive maps using an evolutionary many-task algorithm[J]. Appl Soft Comput 108. ( prepublish). doi:10.1016/J.ASOC.2021.107441.
- Wang, Y., J. Wang, and M. Zhang. 2019. Spatial correlation analysis of energy consumption and air pollution in Beijing-Tianjin-Hebei region. Energy Procedia 158:4280–85. doi:10.1016/j.egypro.2019.01.797.
- Wu, Y., R. Li, L. Cui, Y. Meng, H. Cheng, and H. Fu. 2020. The high-resolution estimation of sulfur dioxide (SO2) concentration, health effect and monetary costs in Beijing. Chemosphere 241:125031. doi:10.1016/j.chemosphere.2019.125031.
- Xiong, X., L. Zhaomin, Y. Shilin, H. Tan, and H. Baixiang Xiang. 2021. Coke preheating combustion study on NOx and SO2 emission[J]. J. Energy Inst. ( prepublish). doi:10.1016/J.JOEI.2021.04.007.
- Xiurui, G., Z. Lijuan, C. Dongsheng, J. Yuhuan, N. Zhao, L. Wenwen, and C. Shuiyuan. 2018. Air quality improvement and health benefit of PM2.5 reduction from the coal cap policy in the Beijing-Tianjin-Hebei (BTH) region, China. Environ. Sci. Pollut. Res. 25 (32). doi: 10.1007/s11356-018-3014-y.
- Xu, J. S., D. Liu, X. F. Wu, T. V. Vu, Y. Zhang, P. Fu, Y. Sun, W. Xu, B. Zheng, and R. M. Harrison. 2021. Source apportionment of fine organic carbon at an urban site of Beijing using a chemical mass balance model. Atmos. Chem. Phys. 21 (9):7321–41. doi:10.5194/acp-21-7321-2021.
- Yang, Z., and J. Liu. 2019. Learning of fuzzy cognitive maps using a niching-based multi-modal multi-agent genetic algorithm. Appl Soft Comput 74:356–67. doi:10.1016/j.asoc.2018.10.038.
- Zhai, M., G. Huang, L. Liu, B. Zheng, and Y. Li. 2021. Economic modeling of national energy, water and air pollution nexus in China under changing climate conditions. Renew. Energy 170:375–86. doi:10.1016/j.renene.2021.01.011.
- Zhang, C., D. J. Jing, C. Z. Wu, S. Li, N. Cheng, W. Li, G. Wang, B. Chen, Q. Wang, and J. Hu. 2021. Integrating chemical mass balance and the community multiscale air quality models for source identification and apportionment of PM2.5. Process Saf. Environ. Prot. 149:665–75. doi:10.1016/j.psep.2021.03.033.
- Zhao, S., S. Liu, Y. Sun, Y. Liu, R. Beazley, and X. Hou. 2020. Assessing NO2-related health effects by non-linear and linear methods on a national level. Sci. Total. Environ. 744:140909. doi:10.1016/j.scitotenv.2020.140909.