
ABSTRACT
Co-composting of fecal sludge (FS) and solid waste (SW) allows recycling of essential nutrients into agriculture thereby closing the nutrient circle. In this study, temperature variation, the mass balance of forced and passive aeration in the composting process, and the extent of degradation with different stages were investigated. The extent of degradation was determined through the different composting process in the first, second, and third stages with different mix proportion of fecal sludge. Four sets of the initial waste mixture were prepared using SW and FS. SW and FS were mixed at four different ratios for four sets namely 90:10, 85:15, 80:20, and 75:25 (SW:FS). Forced aeration and passive aeration composting tests were done using a series of reactors according to a planned experimental program. The results show that (i) the mean maximum temperature of the first and second stage were 65°C and 56°C of passive, 67°C and 60°C of forced aeration, respectively which raised within seven days. (ii) According to the mass balance, total mass, moisture content, and volatile solids always decreased at every stage for passive and forced aeration processes, the degradation of the volatile solid in the composting process using forced aeration was more than in the passive aeration process. (iii) For the passive and forced aeration processes, the total BVS degradation of ranged between 82% and 89%, and 73% and 91%, respectively after 60 days. Therefore, it can be concluded that the percentage of BVS degradation in forced and passive aeration was not significantly different.
Implications: The extent of degradation was determined through different composting processes in the three stages with different mixture proportion of fecal sludge and organic solid waste. The study showed that maximum temperature in composting ranged from 57°C to 67°C within one week. Co-composting process with passively and forced aeration process of peak temperature were almost same. Reduction of volatile solids at first stage was greater than second and third stages. Biodegradable volatile solids reduction in passive and forced aeration processes were not significantly different. The final product of composting was used in agricultural land.
Introduction
The growth of the world’s population, rising living standards, urbanization, and technological developments are responsible for increased generation of different types of wastes. Cities and towns of many countries, especially in Bangladesh, have problems managing municipal solid waste and fecal sludge from on-site sanitation facilities. Among many opportunities of managing the organic part of municipal solid wastes, biological degradation is one of the best applied processes. Biological degradation process offers a cost-effective sustainable solution for biodegradable organic wastes. Composting is a very effective process for recovering waste materials and minimizing environmental emissions by stabilizing the organic wastes in the shortest period of time. In practice, the main biological process applied for solid wastes is composting (Bari Citation1999; Haug Citation1993). In previous reports various aeration techniques for the composting process, including passive and forced aeration, have been widely investigated (Cayuela, Sánchez-Monedero, and Roig Citation2006; Getahun et al. Citation2012; Ogunwande and Osunade Citation2011; Rasapoor, Adl, and Pourazizi Citation2016; Sánchez-Monedero et al. Citation2001). Passively aerated composting is the same as natural aeration, except that perforated pipes are used to facilitate air delivery to the material. However, this process to compost seafood wastes and manure slurries productively. Furthermore, forced aeration (FA) of the composting process acts faster than the passive aeration (PA) process in maturation of compost (Stentiford Citation1996). However, FA has been identified as a suitable method for reducing nitrogen losses by volatilization (Sánchez-Monedero et al. Citation2001). Nevertheless, the FA with the better control of the aeration system is possibly the main advantage of this method over other methods of aeration. Nevertheless, where organic solid waste (OSW) mixed with fecal sludge (FS) is used for the composting process it could be a better option to manage both. Usually, this process is called co-composting.
Co-composting is a resource recovery technique resulting in production of soil conditioner from the combined OSW and FS. Other organic materials, which can be used or subjected to co-composting, comprise animal manure, sawdust, wood chips, bark, slaughter, sludges, and solid residues from food and beverage industries. Co-composting of fecal sludge and organic solid waste is advantageous as these two materials complement each other. Jönsson et al. (Citation2005) reported that human excreta that contains valuable nutrients such as nitrogen, phosphorus, and potassium was estimated 4.5 kg/p/a, 0.6 kg/p/a and 1.2 kg/p/a respectively. However organic solid waste that contains plant nutrients such as carbon, nitrogen, phosphorus, and potassium approximated 19 kg/p/a, 0.8 kg/p/a, 0.3 kg/p/a and 0.5 kg/p/a respectively (Cofie et al. Citation2009). Both materials can be converted into a useful product by co-composting. High temperatures attained in the composting process are effective in inactivating excreted pathogens contained in the FS and will convert both wastes into a hygienically safe soil conditioner-cum-fertilizer (Strauss, Heinss, and Montangero Citation2000). However, effective use of such compost in agriculture depends among other factors on its quality. Quality is affected by the type of initial material, the process of composting and the maturity of the final product. Many authors have recommended methods such as carbon dioxide evolution by luciferin-luciferase, pH by 1:10 w/v extract pH probe, C/N ratio by TOC and Kjeldahl digestion method, temperature by thermometer, and moisture by 105°C at 24 hr to determine compost maturity (Bernai et al. Citation1998; Lasaridi et al. Citation2006; Sharma et al. Citation1997; Tiquia and Tam Citation2000; Tiquia, Tam, and Hodgkiss Citation1996; Zucconi et al. Citation1981). Turning of compost affects the temperature, NH4–N, NO3–N, mass loss, nutrient losses (Tiquia, Richard, and Honeyman Citation2002) and the eventual quality. Turning also reduces particle size (Bari Citation1999) and increases biodegradation rates (Hamelers Citation1993; Tiquia, Tam, and Hodgkiss Citation1997).
Temperature is an important controlling parameter for proper composting operation (Sundberg, Smårs, and Jönsson Citation2004). The final goal of composting of organic solid waste is to use the compost as a soil conditioner and also as a fertilizer in the agricultural field; it is important to observe the values of different nutrients. The various composting phases are dominated by different communities of microorganisms. Initial decomposition is carried out by mesophilic microorganisms, which rapidly break down the soluble, readily degradable compounds. Furthermore, some studies reported that during the initial stage of the composting process microorganisms were found, but in the final stage they decreased and were stable within one to two months (Kutsanedzie, Rockson, and Achio Citation2012; Saludes et al. Citation2008; Tiquia Citation2005; Tiquia, Richard, and Honeyman Citation2002; Tiquia and Tam Citation2000). However, the forced aeration process total coliform decreased more rapidly than in the passive aeration process (Kutsanedzie, Rockson, and Achio Citation2012).
In the passively aerated composting process the temperature was observed for the longest duration of thermophilic range (58–55°C for 12 days) (Ogunwande and Osunade Citation2011). Rasapoor, Adl, and Pourazizi (Citation2016) reported that the composting process temperature of around 70°C was reached within a few days except for natural ventilation static pile. However, Wong et al. (Citation2001) reported a temperature of 50–60°C for efficient composting process. Temperature, dryness and UV light are the main factors influencing die-off. The key factors affecting the composting processes was carbon to nitrogen ratio, moisture content, oxygen supply, aeration, particle size, pH, temperature, turning frequency, microorganisms and invertebrates, control of pathogens, degree of decomposition, and nitrogen conservation (Strauss, Heinss, and Montangero Citation2000; Diaz et al. Citation2002). Consequential products of biological metabolism are compost, carbon dioxide, water and heat (Bari and Koenig Citation2001). Composting of MSW with FS reduced maturation time, higher pH, reduce moisture content and N2O emissions in cooling (Bian et al. Citation2017). The key products of biochemical decomposition reaction after any effective (either open or closed) composting process oxygen degraded volatile solids, which produced carbon dioxide, water and NH3-N while releasing the heat energy (Bari and Koenig Citation2001). Howeveri it was previously reported that where moisture content is above 65%, water begins to fill the interstices between the particles of the wastes, dropping the interstitial oxygen and causing anaerobic conditions (Goyal, Dhull, and Kapoor Citation2005; Moqsud, Bushra, and Rahman Citation2011). Nevertheless, moisture content below 40%, bacterial activity and composting processes become decreased (Goyal, Dhull, and Kapoor Citation2005; Rahman Citation2004). The compost produced from kitchen garbage in different seasons in Bangladesh has very good nutrient values and also very good microbial quality and can effectively be used as soil conditioner (Moqsud and Rahman Citation2004). In wet and dry seasons the maximum temperature of passive aeration inside reactors were almost same. In both seasons the moisture content always decreased after the final stage of the composting process. Forced aerated composting has higher composting matrix than passive aeration in composting mass (Alamin et al. Citation2017a). The volatile solid always decreases after the composting process (Alamin, Bari, and Alamgir Citation2017b). A comparison of the areas under the temperature curves for different composting layers and their respective self-heating tests confirm the biological degradation results obtained by the multilayer analysis (Bari and Koenig Citation2000). The goal of this study is to observe the temperature variation during composting and extent of degradation of organic wastes in three stages.
Materials and methods
Bench-scale tests were conducted using a numbers vacuum flask of one liter volume as a reactor. Initial composting mixture consisted of two types of waste namely (i) organic solid waste mixture (OSW) and (ii) fecal sludge (FS).
Preparation of initial composting mixture
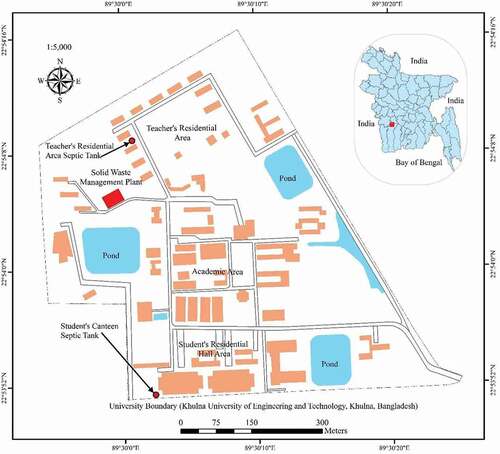
The composting was performed with different mixture proportions for both the passive and forced aeration processes. OSW was prepared according to waste proportion vegetable wastes:food wastes:waste paper:sawdust as 40:35:10:15. Suitable vegetable and food wastes were collected from student residential hall areas (). Vegetable wastes mainly used were potato, radish, turnip, onion, garlic, rotten vegetables, peel, shells, and scraped portions of vegetables or slurries, and chili pepper, etc. The food wastes mainly consisted of rice, noodles, bread, eggshells, meat, and fish residue, etc. Waste paper was collected from offices and sawdust was collected from a local sawmill. Sawdust was used as a bulking agent. FS was collected from a septic tank of a residential area and dried on a prefabricated drying bed to obtain the desired moisture content for the process. Finally OSW mixture and FS were prepared according to the above description were mixed at four different ratios. These ratios were 90:10, 85:15, 80:20, and 75:25 (OSW:FS). Then forced aeration and passive aeration composting tests were done using a series of reactors according to a planned experimatal program.
Figure 1. Location of university area and septic tank.
Bench scale reactor
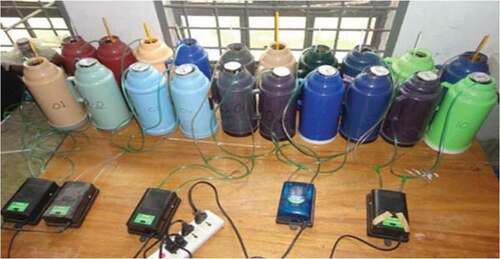
Bench-scale tests were conducted using vacuum flasks of one liter volume (Shimizu Brand, Japan) as a bench-scale reactor. In this research the number of reactors used in first, second, and third stage bench-scale tests were 16, 12, and 8 respectively with total 36 numbers for passive aeration process. However, in the forced aeration process a similar number of rectors were used. In this study 72 reactors were used. About 400 g of waste mixture is necessary to fill each of the bench-scale reactors initially. The waste inside the reactor was compacted loosely to provide proper porosity for natural and forced aeration. After putting the waste mixture into the reactor, the inlet was covered by cork to prevent excessive heat loss and the thermometers were inserted into the flask for taking readings periodically until the temperature reached ±5°C of the ambient temperature. The reactors were filled with waste mixture according to . The temperature of the waste mixture was continuously monitored. After final decline in temperature close to ambient, the tests were discontinued. The experimental setup was shown in .
Table 1. An experimental program of co-composting.
Figure 2. Experimental set-up in passive and forced aeration.
Experimental program of composting
The study was conducted by means of different mixture proportions in the bench-scale reactor in according to specifically designed program as shown in and description of reactors Table S1. Four, three, and two sets of bench-scale composting tests according to the mix proportion were done in three stages, respectively for considering turning frequency as full scale composting process. The organic solid waste and fecal sludge were weighed separately before mixing and then mixed uniformly. The moisture content of the initial waste mixtures was adjusted to about 50–60% for optimum consistency and porosity by adding sawdust (Goyal, Dhull, and Kapoor Citation2005; Moqsud, Bushra, and Rahman Citation2011). The fresh compost produced by the first stage composting tests were used as a initial feed material for subsequent second-stage composting tests. After first-stage composting the product was re-mixed manually using a shovel and adjusted with water, if necessary for the second composting. Compost released from the second-stage reactor was mixed properly and used as feedstock for third-stage composting. The range of biodegradable volatile solids (BVS) degradation from all three stages is estimated and described in the following sections of the paper.
Experimental results and discussions
Temperature variations in different experiment
All the reactors with different mix ratios for the first stage were run for 31 days as the temperatures falls near to ambient temperature. However, in passive and forced aeration temperatures were raised maximum from 57°C to 67°C within five days and 52°C to 61°C within three days and followed a similar fashion during their rise and fall phase. Nevertheless, all reactors’ temperatures were almost similar, which are very close to ambient temperature after 24 days. PF1 (85:15) means passive aeration first stage reactor number 1 with waste mixture proportion OSW: FS = 85:15 for this stage. Temperature variation in passively aeration and forced aeration first stage are present in .
Figure 3. Temperature variation in (a) passive aeration and (b) forced aeration (first stage) [PF(90:10)a = passive aeration first stage (OSW:FS) reactor a, FF(90:10)a = forced aeration first stage (OSW:FS) reactor a].
![Figure 3. Temperature variation in (a) passive aeration and (b) forced aeration (first stage) [PF(90:10)a = passive aeration first stage (OSW:FS) reactor a, FF(90:10)a = forced aeration first stage (OSW:FS) reactor a].](/cms/asset/51cc29d0-dc63-4b2b-a82e-32c10bd1d710/uawm_a_2064936_f0003_oc.jpg)
Thus, the fresh compost released from the first stage reactors were adjusted properly with moisture (around 60% moisture content) and used as a feedstock in second-stage composting. Nonetheless, in the second stage all reactors were run for 15 days as the temperatures came close to ambient temperature after that time. In passively and forced aerated reactors temperatures were raised maximum from 45°C to 56°C within three days and 54°C to 60°C within two days respectively, followed in a similar fashion during their rise and fall phase. However, after 10 days all reactor temperatures were almost similar, which are much closer to ambient temperature. Temperature variation in passive aeration and forced aeration second stage are presented in .
Figure 4. Temperature variation in (a) passive aeration and (b) forced aeration (second stage) [PS(90:10)a = passive aeration second stage (OSW:FS) reactor a, FS(90:10)a = forced aeration second stage (OSW:FS) reactor a].
![Figure 4. Temperature variation in (a) passive aeration and (b) forced aeration (second stage) [PS(90:10)a = passive aeration second stage (OSW:FS) reactor a, FS(90:10)a = forced aeration second stage (OSW:FS) reactor a].](/cms/asset/647827fe-cbd4-4c40-aa89-3db66e06bb88/uawm_a_2064936_f0004_oc.jpg)
Likewise, compost released from the second-stage reactor was adjusted properly with moisture and used as feedstock for third-stage composting. In the third stage all reactors were run for 17 days as temperature falls toward ambient during that period. In passively and forced aerated reactors temperatures were raised to maximum from 33°C to 36°C within three days and 33°C to 38°C within four days. All reactor temperatures were the same, which is very close to ambient temperature after seven days Temperature variation in passive aeration and forced aeration third stage are presented in . During first stage and second stage the temperature was increased to high thermophilic level up to 55°C to 60°C within one week and in third stage there was no remarkable increase in temperature compared to ambient temperature, which indicates that the produced compost after second stage had reached toward stability.
Figure 5. Temperature variation in (a) passive aeration and (b) forced aeration (third stage) [PT(90:10)a = passive aeration third stage (OSW:FS) reactor a, FT(90:10)a = forced aeration third stage (OSW:FS) reactor a].
![Figure 5. Temperature variation in (a) passive aeration and (b) forced aeration (third stage) [PT(90:10)a = passive aeration third stage (OSW:FS) reactor a, FT(90:10)a = forced aeration third stage (OSW:FS) reactor a].](/cms/asset/e395ab9a-8720-44ff-9045-f0cfb05cc625/uawm_a_2064936_f0005_b.gif)
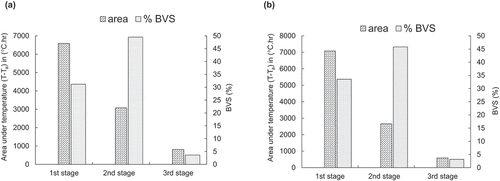
After comparing , it is observed that the area under temperature curves are decreased from first to third stages as explained in . Therefore, it can be concluded that the much BVS is degraded in the first stage, then second and third stages. There was very little BVS left after the second stage. This study has several limitations (i) determine the vertical distribution of temperature and microorganisms under different stages of aeration during first, second, and third stage composting and (ii) heavy metal and pathogenic bacteria are to be tested initially and during different stages of composting.
Figure 6. Average area under temperature curves and corresponding BVS(%) reduction (a) passive aeration and (b) forced aeration.
Initial and final physicochemical characteristics of compost
Moisture content, volatile solids of individual waste samples used in different experiments are presented in Table S2. Initial and final physicochemical parameters of waste and compost for bench-scale tests of passive and forced aeration composting process are presented in . In the passive and forced aeration composting process, at final condition the pH value of the finished compost is ranged between 7.7 and 7.9. It indicate that when fecal sludge volume increased then the pH values is increased. The conductivity value of the final compost after completion of every stage of each run always increased from its starting value probably due to accumulation of mineral salt in the remaining compost through VS reduction. The TKN of initial four mixing ratios in the passive and forced aeration composting processes was observed to be 1.78%, 1.72%, 2.56% and 2.81% of dry solids, respectively. Due to the loss of volatile solids, the percentage of TKN in the final samples was always found 0.12–0.24% higher than that in the initial samples. In the passive aeration composting process, at final condition TKN value of finished compost is ranged between 1.9 and 3.1% of dry sample. In the forced aeration co-composting process TKN value of finished compost is ranged between 1.8 and 3.1% of dry sample. From it can also be seen that all ratios of OSW and FS mixer in passive and forced aeration processes the range of initial C/N ratios was 11 to 22. In the final stage for all ratios of waste mixture the C/N ratio reduces and were varied from 10 to 15. Therefore, C/N ratios decreased as composting proceeded.
Table 2. Initial and final physicochemical parameters of waste and compost in bench-scale tests of passive and forced aeration composting.
Mass balances for different stage
The change in total mass (TM), moisture content (MC) volatile solids (VS), and organic carbon (OC) during bench scale co-composting tests of first stage, second stage, and third stage is shown in , respectively. The MC reported on a wet basis and VS, fixed solids on a dry basis. Initial moisture content of the waste mixtures varied between 55 and 70%. In the passively aerated co-composting process, the mean percent reduction of total mass, moisture content, volatile solids and organic carbon of the first stage (average of four) were 33.1%, 35.95%, 29.2%, and 22.7%, respectively. In the second stage (average of three) mean percent reduction of total mass, moisture content, volatile solids, and organic carbon were 15.7%, 25.6%, 7.4%, and 3.0%, respectively. In the third stage (average of two) mean percent reduction of total mass, moisture content, volatile solids, and organic carbon were 8%, 29.2%, 5%, and 1.7%, respectively. In the forced aerated co-composting process, the mean percent reduction of total mass, moisture content, volatile solids, and organic carbon of first stage were 34.2%, 38.3%, 34%, and 21.6%, respectively. In the second stage mean percent reduction of total mass, moisture content, volatile solids and organic carbon were 18.4%, 29.3%, 7.72%, and 3.5%, respectively. In the third stage mean percent reduction of total mass, moisture content, volatile solids, and organic carbon were 9.2%, 41.8%, 5.4%, and 1.8%, respectively.
Table 3. Change in total mass, moisture content, volatile solid, and organic carbon of first, second, and third stage passive and forced aeration composting.
Estimation of initial biodegradable volatile solids
The determination of the biodegradable fraction of VS or biodegradable volatile solids (BVS) would give a better understanding of the waste degradability and final product stability (Fernandes and Sartaj Citation1997). The term biodegradable volatile solids (BVS) are generally used when referring to the degradation rates or oxygen consumption rates (Haug Citation1993). The total initial biodegradable volatile solids (BVS) for different proportion mixture solid waste bench-scale tests were estimated from the summation of volatile solids degraded in the first, second, and third stages. According to Bari (Citation1999), it was estimated that the remaining BVS in the compost, after 63 days of effective degradation in the first stage, second stage and third stage would not be more than 10%. Therefore, the sum of VS degraded in three stages is increased by 10% to have a suitable estimation of initial BVS. The calculation procedure and the estimated initial amounts of BVS for different sets are presented in .
Table 4. Estimation of initial biodegradable volatile solids (BVS) by performing three stage bench-scale tests. The BVS were estimated by multiplying 1.1 times the sum of VS degraded in three stages, the first stage (ST1), second stage (ST2), and third stage (ST3).
Extent of degradation
The amount of biodegradable volatile solids (BVS) as estimated from is used to determine the BVS degraded in first, second, and third stages and their overall sum with percentage degradation are presented in . For explanation: BVS = biodegradable volatile solids; i1 = initial BVS in stage 1; Δ = amount of BVS degraded in gm; ΔT = total BVS degraded in three stage (in row 1 for 90:10, ΔT = 21.24 + 61.57 + 1.41 = 84.39%. The total biodegradable volatile solids reduction of passive aeration was 82% to 89% after 60 days. The range of reduction is very narrow with standard deviation 3.78. Therefore, it can be concluded that all four sets of waste contain almost the same percentage of BVS depending on their VS content. Forced aeration composting process total BVS percentage reduction was 73% to 91% after 60 days and standard deviation is 7.47. The waste mixture proportion (90:10) of BVS was greater than other mix proportion and was 91%. The percentage of BVS degradation in forced and passively aeration was not significantly different (p = 0.39).
Table 5. Biodegradable volatile solids (BVS) degraded (Δ) in first stage, second stage, and third stage with overall sum.
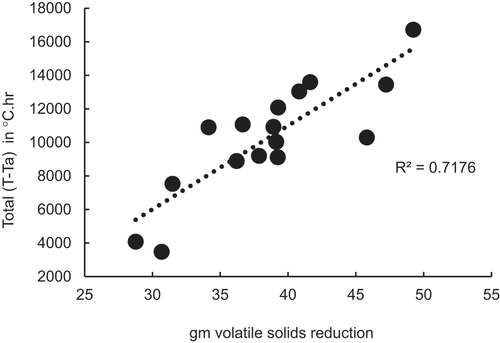
Relationship between gm VS reduction and area under temperature curve
An attempt have been made so far to establish some relationships among the area under the temperature curves, and VS reduction according to Bari (Citation1999) using data of more than 72 reactors, which were applied for similar type waste mixture of compost.
For the passive aeration composting process, the correlation between Atotal-ambient (area under net temperature increase curve) in °C.hr and gm volatile solids reduction is presented . The correlation coefficient was R2 = 0.7309 which followed a linear relation. In forced aeration co-composting process, the correlation co-efficient between Atotal-ambient (area under net temperature increase curve) in °C.hr and gm volatile solids reduction was R2 = 0.7176 as shown in . It is clearly shown that higher Atotal-ambient indicate higher VS degradation. However, volatile solid degradation was found no significant differ between passive and forced aeration in composting process (p-value of ANOVA test p = 0.678). Nevertheless, forced aeration process of volatile solid degradation was more stable than passive aeration process. Nonetheless, Atotal-ambient was not significantly different with passive and forced aeration processes (p-value of ANOVA test p = 0.897). In contrast, forced aeration composting volatile solid reduction area under temperature curve was more stable passive aeration.
Figure 7. Correlation between Atotal-ambient (area under temperature curve after completion) in °C.hr and gm volatile solids reduction in the passive aeration co-composting process.
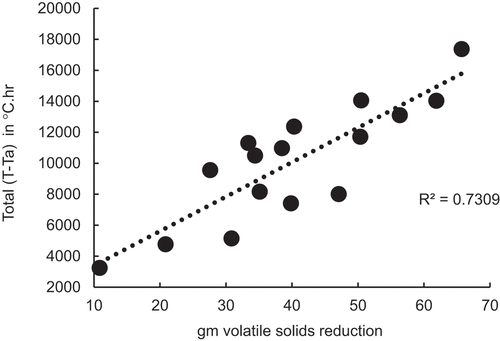
Figure 8. Correlation between Atotal-ambient (area under temperature curve after completion) in °C.hr and gm volatile solids reduction in forced aeration co-composting process.
Conclusion
Based on the results of this study the following conclusions are drawn:
The mean maximum temperature of the first stage, second stage, and third stage passively aerated composting processes were 65°C, 56°C, and 36°C, respectively. The mean maximum temperature of the first stage, second stage, and third stage forced aerated composting processes were 67°C, 60°C, and 38°C, respectively. The peak temperatures of all the passively and forced aerated composting tests were almost the same. In forced aeration the peak temperature was increased more quickly than in the passive aeration process.
According to the mass balance, in passive and forced aeration composting process total solids, moisture content, and volatile solids was always decreased at every stage. In first stage volatile solids reduction was greater than second and third stages. The volatile solid degradation in the forced aeration process was more than in the passive aeration process.
The extent of degradation in co-composting process can be determined more exactly from the correlation between Atotal-ambient in °C.hr and gm VS reduction with different stage.
In the passive aeration co-composting process, absolute total volatile solids degradation was 42% and total BVS reduction was 82% to 89% after 60 days. The range of reduction is very narrow with standard deviation 3.78. In the forced aeration process absolute total volatile solids degradation was 47% and total BVS percentage reduction was 73% to 91%. Therefore, it can be concluded that passive and forced aeration of waste contain almost the same percentage of BVS depending on similar VS content.
In both passive and forced processes the range of C/N ratios were decreased from 11 to 22 to 10 to 15. Therefore, C/N ratios decreased as composting proceeded.
Supplementary_material.docx
Download MS Word (22.5 KB)Disclosure statement
No potential conflict of interest was reported by the authors.
Data availability statement
Due to the nature of this research, participants of this study did not agree for their data to be shared publicly, so supporting data is not available.
Supplementary material
Supplemental data for this paper can be accessed on the publisher’s website.
Additional information
Notes on contributors
Md. Alamin
Md. Alamin is a Ph.D. student at the Graduate School of Natural Science and Technology, Kanazawa University, Kanazawa, Japan.
Quazi Hamidul Bari
Quazi Hamidul Bari is a Professor at the Department of Civil Engineering Khulna University of Engineering and Technology (KUET), Khulna-9203, Bangladesh.
References
- Alamin, M., Q. H. Bari, and A. A. Alamgir. 2017b. Seasonal variation on extent of stabilization of faecal sludge co- composting in Khulna City of Italy. 16th International Waste Management and Landfill Symposium, Margherita Di Pula, Cagliari, Italy, October 2–6.
- Alamin, M., Q. H. Bari, M. S. Islam, and K. M. Hassan. 2017a. Safe disposal of faecal sludge using co-composting. WasteSafe 2017, 5th International Conference on Solid Waste Management in South Asian Countries, 25–27 February, Khulna, Bangladesh.
- Bari, Q. H. 1999. Effect of different modes of aeration on composting of solid waste in a closed system. Ph.D. Thesis, Deparment of Civil Engineering, The University of Hong Kong.
- Bari, Q. H., and A. Koenig. 2000. Kinetic analysis of forced aeration composting-II. Application of multilayer analysis for the prediction of biological degradation. Waste Manage. Res. 18 (4):313–19. doi:https://doi.org/10.1177/0734242x0001800403.
- Bari, Q. H., and A. Koenig. 2001. Effect of air recirculation and reuse on composting of organic solid waste. Resour. Conserv. Recycl. 33 (2):93–111. doi:https://doi.org/10.1016/S0921-3449(01)00076-3.
- Bernai, M. P., C. Paredes, M. A. Sánchez-Monedero, and J. Cegarra. 1998. Maturity and stability parameters of composts prepared with a wide range of organic wastes. Bioresour. Technol. 63 (1):91–99. doi:https://doi.org/10.1016/S0960-8524(97)00084-9.
- Bian, R., Y. Sun, W. Li, Q. Ma, and X. Chai. 2017. Co-composting of municipal solid waste mixed with matured sewage sludge: The relationship between N2O emissions and denitrifying gene abundance. Chemosphere 189:581–89. doi:https://doi.org/10.1016/j.chemosphere.2017.09.070.
- Cayuela, M. L., M. A. Sánchez-Monedero, and A. Roig. 2006. Evaluation of two different aeration systems for composting two-phase olive mill wastes. Process Biochem. 41 (3):616–23. doi:https://doi.org/10.1016/j.procbio.2005.08.007.
- Cofie, O., D. Kone, S. Rothenberger, D. Moser, and C. Zubruegg. 2009. Co-composting of faecal sludge and organic solid waste for agriculture: Process dynamics. Water Res. 43 (18):4665–75. doi:https://doi.org/10.1016/j.watres.2009.07.021.
- Diaz, M. J., E. Madejón, F. López, R. López, and F. Cabrera. 2002. Optimization of the rate vinasse/grape marc for co-composting process. Process Biochem. 37 (10):1143–50. doi:https://doi.org/10.1016/S0032-9592(01)00327-2.
- Fernandes, L., and M. Sartaj. 1997. Comparative study of static pile composting using natural, forced and passive aeration methods. Compost Sci. Util. 5 (4):65–77. doi:https://doi.org/10.1080/1065657X.1997.10701899.
- Getahun, T., A. Nigusie, T. Entele, T. Van Gerven, and B. Van Der Bruggen. 2012. Effect of turning frequencies on composting biodegradable municipal solid waste quality. Resour. Conserv. Recycl. 65:79–84. doi:https://doi.org/10.1016/j.resconrec.2012.05.007.
- Goyal, S., S. K. Dhull, and K. K. Kapoor. 2005. Chemical and biological changes during composting of different organic waste and assessment of compost maturity. Bioresour. Technol. 96:1584–91. doi:https://doi.org/10.1016/j.biortech.2004.12.012.
- Hamelers, H. V. M. 1993. A theoretical model of composting kinetics. In Science and Engineering of composting: Design, Environmental, Microbiological and Utilization Aspects, ed. A. J. Hoitink and H. M. Keener, 36–58. Worthington, Ohio: Renaissance Publications.
- Haug, R. T. 1993. The practical handbook of composting engineering. BocaRaton, USA: Lewis Publishers.
- Jönsson, H., A. Baky, U. Jeppsoon, D. Hellström, and E. Kärrman. 2005. Composition of urine, faeces, greywater and biowaste for utilization in the URWARE model. Urban Water Report of the MISTRA Programme, Report 2005:6, Chalmers University of Technology, Gothenburg, Sweden. http://www.urbanwater.com
- Kutsanedzie, F., G. Rockson, and S. Achio. 2012. Comparison of compost maturity, microbial survival and health hazards in two composting systems. J. Microbiol. Biotechnol. Food Sci. 2 (1):175–93.
- Lasaridi, K., I. Protopapa, M. Kotsou, G. Pilidis, T. Manios, and A. Kyriacou. 2006. Quality assessment of composts in the Greek market: The need for standards and quality assurance. J. Environ. Manage. 80 (1):58–65. doi:https://doi.org/10.1016/j.jenvman.2005.08.011.
- Moqsud, M. A., Q. S. Bushra, and M. H. Rahman. 2011. Composting barrel for sustainable organic waste management in Bangladesh. Waste Manage. Res. 29 (12):1286–93. doi:https://doi.org/10.1177/0734242X10383621.
- Moqsud, M. A., and M. H. Rahman. 2004. Biochemical properties of compost from kitchen garbage in Bangladesh. Conference: Proceedings of the 20th international conference on Solid Waste Technology and Management, 440–47. Philadelphia, USA, April 3–6.
- Ogunwande, G. A., and J. A. Osunade. 2011. Passive aeration composting of chicken litter: Effects of aeration pipe orientation and perforation size on losses of compost elements. J. Environ. Manage. 92 (1):85–91. doi:https://doi.org/10.1016/j.jenvman.2010.08.026.
- Rahman, M. H. 2004. Composting of solid waste in Bangladesh. Proceedings of the 19th international conference on Solid Waste Technology and Management, 45–49. Philadelphia, Philadelphia, USA.
- Rasapoor, M., M. Adl, and B. Pourazizi. 2016. Comparative evaluation of aeration methods for municipal solid waste composting from the perspective of resource management: A practical case study in Tehran, Iran. J. Environ. Manage. 184:528–34. doi:https://doi.org/10.1016/j.jenvman.2016.10.029.
- Saludes, R. B., K. Iwabuchi, F. Miyatake, Y. Abe, and Y. Honda. 2008. Characterization of dairy cattle manure/wallboard paper compost mixture. Bioresour. Technol. 99 (15):7285–90. doi:https://doi.org/10.1016/j.biortech.2007.12.080.
- Sánchez-Monedero, M. A., A. Roig, C. Paredes, and M. P. Bernal. 2001. Nitrogen transformation during organic waste composting by the Rutgers system and its effects on pH, EC and maturity of the composting mixtures. Bioresour. Technol. 78 (3):301–08. doi:https://doi.org/10.1016/S0960-8524(01)00031-1.
- Sharma, V. K., M. Canditelli, F. Fortuna, and G. Cornacchia. 1997. Processing of urban and agro-industrial residues by aerobic composting: Review. Energy Convers. Manage. 38 (5):453–78. doi:https://doi.org/10.1016/S0196-8904(96)00068-4.
- Stentiford, E. 1996. Composting control: Principles and practice. In The science of composting, ed. M. DeBertoldi, P. Sequi, B. Y. Lemmes, and T. Papi, 49–58. UK: Blackie Academic & Professional.
- Strauss, M., U. Heinss, and A. Montangero. 2000. On-site sanitation: When the pits are full–planning for resource protection in faecal sludge management. Schriftenr. Ver. Wasser Boden Lufthyg. 105:353–60. PMID: 10842838.
- Sundberg, C., S. Smårs, and H. Jönsson. 2004. Low pH as an inhibiting factor in the transition from mesophilic to thermophilic phase in composting. Bioresour. Technol. 95 (2):145–50. doi:https://doi.org/10.1016/j.biortech.2004.01.016.
- Tiquia, S. M. 2005. Microbiological parameters as indicators of compost maturity. J. Appl. Microbiol. 99 (4):816–28. doi:https://doi.org/10.1111/j.1365-2672.2005.02673.
- Tiquia, S. M., T. L. Richard, and M. S. Honeyman. 2002. Carbon, nutrient, and mass loss during composting. Nutr. Cycl. Agroecosyst. 62 (1):15–24. doi:https://doi.org/10.1023/A:1015137922816.
- Tiquia, S. M., and N. F. Y. Tam. 2000. Co-composting of spent pig litter and sludge with forced-aeration. Bioresour. Technol. 72 (1):1–7. doi:https://doi.org/10.1016/S0960-8524(99)90092-5.
- Tiquia, S. M., N. F. Y. Tam, and I. J. Hodgkiss. 1996. Microbial activities during composting of spent pig-manure sawdust litter at different moisture contents. Bioresour. Technol. 55 (3):201–06. doi:https://doi.org/10.1016/0960-8524(95)00195-6.
- Tiquia, S. M., N. F. Y. Tam, and I. J. Hodgkiss. 1997. Effects of turning frequency on composting of spent pig-manure sawdust litter. Bioresour. Technol. 62 (1–2):37–42. doi:https://doi.org/10.1016/S0960-8524(97)00080-1.
- Wong, J. W. C., K. F. Mak, N. W. Chan, A. Lam, M. Fang, L. X. Zhou, Q. T. Wu, and X. D. Liao. 2001. Co-composting of soybean residues and leaves in Hong Kong. Bioresour. Technol. 76 (2):99–106. doi:https://doi.org/10.1016/S0960-8524(00)00103-6.
- Zucconi, F., M. Forte, A. Monac, and M. de Bertoldi. 1981. Biological evaluation of compost maturity. Biocycle 22:27–29.