
ABSTRACT
Many believe that certification testing of residential wood heat appliances should provide data indicative of installed performance. Operationally, test methods typically only assess steady-state emissions and fail to include other typical conditions for batch appliances such as start-up. From a fueling perspective, protocols should ensure a consistent approach reflecting common use practices. Ensuring representative conditions and accurate quantification of emissions requires assessing the impact of different start-up conditions and whether or not start-up conditions affect appliance operation during start-up and beyond. This study evaluated the impact of modifying fuel piece sizes and configurations using a “smart” wood-fired hydronic heater (WHH) cordwood appliance. The appliance represents technologies using software and oxygen sensors to improve performance. Since the study used a “smart” appliance, the results likely reflect the least amount of variability found in a WHH cordwood appliance. The analysis consisted of a series of tests that involved changing one fuel variable per series, including: (1) kindling fuel arrangement in the firebox; (2) fuel piece size; and (3) the amount of kindling and starter fuel used. A goal of the study was to determine how each variable affects emissions performance during start-up and the following steady state load. Testing used a dual-stage combustion cordwood WHH equipped with external thermal storage. Particulate matter (PM), carbon monoxide (CO), and delivered heating efficiency were measured, and visible emissions from the stack and secondary combustion chamber were observed. Replicate tests were conducted for each protocol series to evaluate WHH performance reproducibility. These tests found that for a low-mass staged combustion WHH with external thermal storage, the use of different fueling protocols can substantially affect PM and CO emissions.
Implications: As test methods move to incorporate measurements beyond steady-state emissions, fueling protocols must be assessed to determine (1) if they reflect typical field procedures and (2) the impact of start-up procedures on the complete test run. This paper assessed how changing start-up conditions affected run variability and PM emission impacts.
Introduction
Wood is an important fuel for primary and supplemental heating in the United States. The industrial sector consumes 1,376 trillion British thermal units (TBtu) of energy from wood combustion annually, while the residential sector uses 458 TBtu per year (EIA, Citation2021a). In 2020, 11% of US households (approximately 12.5 million homes) used solid-fuel wood-fired heating appliances as an energy source (EIA (U.S. Energy Information Administration) Citation2021b). In 2015, of the households burning wood for heating purposes, 28% used wood as their primary fuel, while 72% used wood as a supplemental fuel source (EIA Citation2019). Wood-fired heating represented 18% of all renewable residential energy consumption in the US in 2020 (EIA Citation2021). New York State (NYS) is the nation’s second-largest consumer of wood for heating, with approximately 140,000 homes using wood for primary heat and 500,000 homes for supplemental heat (NYSERDA Citation2016).
Residential wood burning is the largest or one of the largest sources of primary PM emissions in many states, can pose a significant public health risk, and is a primary cause of PM nonattainment in some areas. Wood smoke constituents, including fine particulate matter (PM2.5), carbon monoxide (CO), and nitrogen oxides (NOx), are associated with adverse respiratory and cardiac health effects and increased mortality (Chen et al. Citation2021; Di et al. Citation2017; He et al. Citation2020).
US EPA’s Residential Wood Heater (RWH) New Source Performance Standard (NSPS) sets PM emission standards for wood-fired heating appliances (US EPA Citation2015). Compliance with the NSPS limitations is demonstrated by testing a prototype appliance using certification test methods specified in the rule or an EPA-approved alternative test method. In 2015, the EPA revised the NSPS for Residential Wood Heaters, establishing two tiers of particulate matter (PM) emission limits; Step 1 standards, which were in effect from May 2015 to May 2020, and more stringent Step 2 standards, which became effective in May 2020. Under Step 2 requirements, a hydronic heater tested with cordwood must meet an emission standard of 0.15 lb/MMBtu total PM in all test runs (US EPA Citation2015). EPA’s Residential Wood Heater NSPS defined central heating systems as ones “in which a heat source supplies energy to a liquid heat exchange media such as water that is circulated to a heating load and returned to the heat source through pipes.” The 2015 NSPS Step 2 emission standards for certification testing require using one of the following methods: EPA Method 28 Wood-fired Hydronic Heater (EPA Method 28WHH) (US EPA Citation2019a), EPA Method 28WHH–Partial Thermal Storage (PTS) (US EPA Citation2019b) with an adjustment for crib wood versus cordwood, or ASTM E2618–13 (ASTM Citation2013) with additional EPA requirements.
Certification test methods
provides an overview of all the central heater test methods cited in the NSPS that can be used to certify to Step 2 emission standards. As shown in this table, the methods are similar. All current test methods assess performance under steady-state conditions. Only Method 28WHH–PTS includes start-up conditions. These methods are discussed further below.
Table 1. Comparison of test methods for wood-fired central heaters used in U.S. regulations.
Method 28WHH
ethod 28WHH (US EPA Citation2019a) can be used on a broad range of wood-fired central heating appliances, including those fueled with cordwood, pellets, or chips. This method measures total PM emissions at four prescribed steady-state loads. For cordwood WHH appliances, the method requires red or yellow oak dimensional lumber (crib wood) with a moisture content of 19–25% (dry basis). The method also allows omitting testing at the lowest load category (Category 1 – heat load <15% of maximum) if the test report contains evidence that the appliance does not operate at that load. Efficiency calculations are based on thermal efficiency. However, M28WHH also includes requirements to complete efficiency calculations using the Canadian Standards Association (CSA) B415.1 (CSA Citation2015) stack loss method as a quality assurance check.
Method 28WHH-PTS
Partial thermal storage cordwood appliances can use Method 28WHH-PTS (US EPA, Citation2019b) to certify compliance with the NSPS for residential wood heaters. Method 28WHH-PTS relies on T 4 of the CSA B415 test method to inform cordwood fuel piece sizes. Method 28WHH-PTS uses the operational, fueling, and PM measurement protocols in Method 28WHH but requires emissions and efficiency calculations to include measurements taken in the start-up, steady-state, and burnout phases. Emission calculations are based on the data from the phased approach and only require testing in low load (Category 1, <15% maximum load) and maximum load (Category 4, 100% heat output). Efficiency calculations are an extension of Method 28WHH. With partial thermal storage, the average tank temperature at the start and end of the test must be measured to determine the amount of energy in the storage vessel, which is considered part of the output of the boiler.
ASTM E2618-13
ASTM E2618-13 (ASTM Citation2013) is a proprietary test method owned by ASTM. It relies heavily on EPA M28WHH, having similar requirements for fueling, PM measurement method, and weighting requirements. The primary difference is that EPA M28WHH only allows the use of dimensional lumber while ASTM E2618 allows the use of cordwood fuel, defined as any cordwood species with a specific gravity between 0.60 and 0.73. ASTM E2618-13 also differs from EPA M28WHH in that it lacks fueling protocol details, such as specifications for minimum fuel length, fuel load density, and fuel loading configuration. This test method also allows broad discretion in modifying appliance setpoints and heat output settings when testing.
Certification testing
When operated in a home or business, units respond to calls for heat from a thermostat (Ahmadi et al. Citation2020). Therefore, typical appliance operation is characterized by variable calls for heat over the course of a day, sometimes with an on/off cycle or with a combination of turndown ratios and on/off cycles, and often spend long periods at low or no heat demand. As listed above, current US federal certification protocols for WHHs are highly inconsistent with in-use practices. These certification tests assess appliance performance under a single fuel load configuration with consistent spacing and piece size. Testing that includes operational patterns such as start-up emissions is likely to improve the representativeness of lab testing. Research has found that during the start-up phase and low burn rate periods, the combustion performance degrades, causing increased emissions of both organics and soot (Kocbach Bølling et al. Citation2009). Homeowner wood fuel quality, load patterns, fuel loading, and kindling habits are highly variable and are all critical factors that can result in WHH performance and emissions differences when comparing lab testing to in-situ performance. While M28WHH-PTS accounts for start-up emissions, the most commonly used federally approved certification tests (Method 28WHH and ASTM E2618) fail to account for start-up and refueling emissions.
The crib wood fuel burned in tests using ASTM E2618 and US EPA M28WHH is dimensional oak lumber (4” x 4”) of uniform size arranged symmetrically within the firebox. Those requirements are designed to reduce variability in test results due to fueling conditions but are not representative of in-use fueling practices. In the 2015 NSPS, the EPA took a first step toward improving the representativeness of certification tests by allowing manufacturers to use approved cordwood certification tests in 40 CFR Subpart QQQQ – Standards of Performance for New Residential Hydronic Heaters and Forced-Air Furnaces (US EPA Citation2015). However, for a cordwood test to be both reproducible as well as representative, it must include appropriate fueling constraints, including limitations on acceptable species, the moisture content of the fuel, the size of the wood, the configuration of the fuel, the coal bed conditions, and the amount of fuel loaded into the firebox. Current test methods fail to address key fueling protocols to ensure test consistency.
Unlike EPA M28WHH and M28WHH-PTS, which specify fuel loading configurations for crib fuels, ASTM E2618 and CSA B415 allow the manufacturer to designate the fuel load configuration used for certification testing, including overall fuel configuration and individual piece spacing. This flexibility creates the opportunity for the manufacturer or test laboratory to optimize fuel placement for certification tests. The failure to require consistent fuel placement procedures introduces variability that affects the reproducibility of test results and the comparability of the tests, providing opportunities for optimizing emissions that may not reflect in-field performance. A 2018 study found that the geometric shape of the fuel has a significant impact on the power and emission parameters of the heat source (Holubcik, Jandacka, and Kantová Citation2018b). Tissari (Citation2008) found “(f)uel loading had a clear influence on emissions. The use of too large fuel batches or small logs (i.e., total area of wood logs) in relation to the size of the heater air intakes causes incomplete combustion. With a large batch size (dry fuel), the gasification rate of the fuel increases, and the supply of air becomes insufficient.”
ASTM E2618, EPA M28WHH-PTS, and CSA B415 also do not specify cordwood shape. This failure to provide a definition allows the manufacturer to shape pieces, which has resulted in some certification testing using wood that is more akin to dimensional lumber than cordwood (NESCAUM Citation2021). A 2010 study found “unsplit wood generates higher emissions than split wood. Compared to split wood, the emission factors of unsplit wood increase by more than 60%. Higher emissions from unsplit wood may be due to a higher proportion of bark, knots or resin on the wood surface, which would have different burning properties than the wood inside.” (Xie, Mahon, and Petersen Citation2010, Holubcik et al. Citation2018a).
In 2016, US EPA released a document detailing EPA’s intent to adopt new test methods for residential wood heating that included a list of key criteria for consideration, explicitly calling out questions regarding cordwood fueling practices, including questions about start-up conditions and fueling practices. In that document, EPA stated, “(t)he most significant problem with the certification test methods not reflecting the range of in-home fueling and operation is that manufacturers design and adjust their wood heaters to the test method in order to pass the applicable certification test; but emissions may be higher when placed in operation (US EPA Citation2016).” This study seeks to provide data to inform US EPA’s efforts.
Study background
Current test methods typically do not include start-up emissions. Failure to include this operational parameter in certification testing could underestimate in-use PM emissions. Previous studies show that wood-fired heating appliances have higher organic emissions during start-up and burnout phases (Heringa et al. Citation2012; Win, Persson, and Bales Citation2012) because combustion efficiency is lower during these phases (Bignal, Langridge, and Zhou Citation2008; Ohlemiller Citation1986).
Orasche et al. (Citation2012) found, ‘(h)igh value PM were found, especially for log-wood-fired systems during cold-start conditions” but that “the cold-start inflaming process of the log wood boiler is improvable.” Current test procedures typically allow manufacturers and testing labs broad discretion regarding fuel piece size and loading protocols by allowing testing conditions to be determined by manufacturer instructions rather than adhering to consistent formulas to guide testing. For cordwood stoves and WHHs, the loading protocols may significantly impact start-up emissions and the entire test period. Without assessing the impact of fueling protocols for cordwood appliances, it is difficult to ascertain whether the outcomes of emission certification tests reasonably reflect the variable use patterns of wood-burning appliances and thus PM emissions in the field.
This study assessed the impact of fueling protocols on the level and replicability of PM and CO emissions. As test methods move to incorporate measurements beyond steady-state emissions, fueling protocols must be assessed to determine (1) if they are reflective of common field procedures, (2) the impact of fueling and start-up procedures on emission outcomes over an entire test run, often as allowed under current test methods, and (3) the value of replicate testing for wood heater certification programs.
Methodology
Test procedure
This study gathered data using operational procedures specified in US M28WHH-PTS since the appliance used for testing used partial thermal storage as part of the system design. M28WHH-PTS, like other test methods used for certification under EPA’s RWH NSPS, relies on T 4 of CSA B415 to determine the piece size used in the certification test. ASTM E2618 also references Ta 4 of CSA B415. Like ASTM E2618, Method 28WHH-PTS specifies testing at two to four defined heat loads. Category 4, a required test run, requires testing at the maximum settings to establish the maximum heat output. Category 3, an optional test run, requires a heat load of twenty-five to fifty percent of maximum heat output. Category 2, an optional test run, requires testing at a heat load greater than fifteen percent to twenty-four percent of maximum heat output. Category 1 requires testing at a heat load fifteen percent or less than the maximum heat output, and with Method 28WHH-PTS, this test run also requires the appliance to begin testing in a cold start condition. “Cold start” conditions are defined as appliance starting water temperatures to 125°F to 130°F (51.7°C to 54.4°C) when fuel is loaded into the appliance. Testing begins when the fire is lit.
The tests conducted for this study used the operational procedures for a Category 1 test run because it is the only test run to require a cold start per Method 28WHH-PTS. The results of this run may be used in place of Category 2 and 3 testing, making the results of Category 1 significant in determining overall WHH performance in a certification test. Data from the study also assessed how various start-up conditions could affect appliance performance reproducibility and thus identify how certification testing might be improved to better reflect the real-world performance of a WHH.
Testing was conducted at ClearStak, an EPA-approved, ISO-17025 accredited emissions testing laboratory in Putnam, Connecticut. With one major exception, laboratory instrumentation specifications and organization for the testing in this study were per ASTM E2515:11 and the methods referenced in those emission certification protocols. Instead of using ASTM E2515 filter trains for an integrated gravimetric PM measurement, the study used a Tapered Element Oscillating Microbalance (Thermo Scientific model 1400AB TEOM™, Franklin MA) to measure PM in the dilution tunnel continuously throughout the test period. Continuous PM measurements provide 1-minute emission profiles that can be used in conjunction with temperature and other real-time measurements to evaluate the impact of operating conditions on emissions and identify operating conditions that may affect the replicability of results. Time-resolved measurements also enable the characterization of peak PM emissions for shorter duration periods and obtain the PM emission rate (ER) for the first hour of operation from a cold start. Details about the use of the TEOM and a comparison of TEOM and gravimetric PM measurements are found in a companion article in this issue (Allen et al. Citation2022). As documented in that paper, ERs measured with integrated gravimetric and TEOM methods are numerically similar and highly correlated.
Burn cycle phases under the EPA M28WHH-PTS method include: (1) “start-up phase” – defined as the period from the start of the test until 15% of the test fuel charge is consumed; (2) “steady-state” – the period from the end of the start-up phase to a point at which 80% of the test fuel charge is consumed; and (3) “end phase” – the time from the conclusion of the steady-state period to the end of the test. For this study, the start-up period is defined as the first hour of testing (minute 0 through 59) and the steady-state period from minute 60 of testing to the end of the test run, which the test method defines as burning 100% of the fuel charge.
Appliance technology
Tests were conducted on a 2015 NSPS Step 2 compliant indoor cordwood WHH rated at 70,000 Btu/hr, employing downdraft dual-stage technology for combustion optimization and emissions control. The system is installed with a 400-gallon external thermal storage tank. Researchers used a unit with air staging because it effectively reduces gaseous and organic emissions from batch combustion appliances (Nuutinen et al. Citation2014). This appliance burns cordwood in the primary chamber, and the combustion products are redirected to a secondary chamber where they are combined with more air. The WHH has onboard computer controls and a flue gas oxygen (O2) sensor to optimize combustion conditions. However, the O2 sensor does not help control emissions during start-up, which is a transient process that takes place before the sensor is functional on this device.
is an example schematic of a dual-stage, downdraft combustion WHH with external storage similar to the tested unit. All combustion processes require a vaporized or “gas” fuel source for combustion to proceed. The distinguishing characteristic of multi-stage combustors is that the generation of combustible fuel vapors is physically and procedurally separated from the dominant heat-release of the vapor combustion step. The fuel vaporization process is not separated spatially from the flame front in conventional combustion. In staged combustion, a flame forces the creation of the combustible vapor from the solid fuel. A separate fuel-vapor combustion step follows this stage. Compared to open combustion, where wood is vaporized and burned in one step, multi-stage WHHs such as the one used for this research allow for designs that control the flame properties to lower emissions and increase thermal efficiency (Gibbs and Butcher Citation2010). High-efficiency combustion of wood requires optimal time, temperature, and turbulence conditions. Sufficient time at the right conditions is needed for chemical reactions to be completed. High-temperature conditions allow efficient combustion to start faster and remain stable for longer periods since combustion chemical reactions complete faster in a high-temperature environment. In addition, the turbulence of the oxygen-rich air and gaseous organic material produced by the wood fuel makes the combustion more efficient and stable (Nussbaumer Citation2003). Multi-stage combustion technology can incorporate design features that provide longer duration, higher temperature, and better turbulence for the wood fire during steady-state operation.
Figure 1. Schematic of wood gasification boiler with thermal storage (Siegenthaler Citation2017).
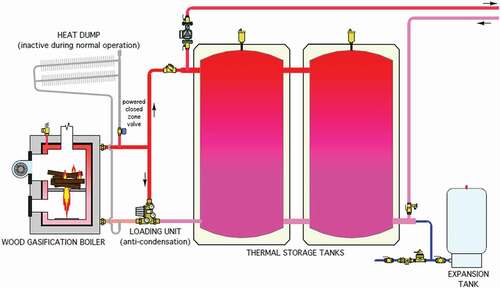
Gasifier WHHs work at their highest efficiency and lowest emission when equipped with a full-size thermal storage system – defined as capturing all the heat from the fuel load. The boiler burns an entire load of cordwood during a single on-cycle, resulting in boiler output exceeding the heating load, and therefore thermal storage is required.
Emissions and efficiency measurement
CO, carbon dioxide (CO2), and O2 measurements followed CSA B415 requirements and were measured with a Siemens Ultramat 23, a nondispersive infrared (NDIR) gas analyzer in the stack. Delivered efficiency was measured by determining the fuel energy input and appliance output. Heat output was determined by measuring the flow rate and temperature change of water circulated through a heat exchanger external to the appliance and the increase in energy of the external storage. Heat input was determined from the mass of dry wood fuel and its higher heating value. Delivered efficiency does not attempt to account for pipeline loss.
Dilution tunnel PM was measured at one-minute intervals using a Thermo Scientific Model 1400AB Tapered Element Oscillating Microbalance (TEOMTM) sampling at 0.50 liters/minute from an 8-inch diameter dilution tunnel with an approximate flow rate of 340 ft3 per minute (cfm). This study’s continuous TEOM measurement approach represents a significant step forward compared to current filter-based methods in accurately characterizing changes in PM emission performance with high temporal resolution during a test run (Allen et al. Citation2022). The TEOM was run at 86°F (30°C), did not have a size-fractionating inlet, and had timing parameters set for fast response and rapid filter changes. The TEOM was used in place of the filter and dry gas meter PM collection apparatus described in ASTM E2515 to provide real-time PM data at one-minute intervals. This approach provided a higher time resolution than the PM data collected with ASTM E2515, an integrated filter sample that typically runs for 8 to 72 hours during EPA M28WHH testing. The time-resolved PM data allowed for identifying changes in the PM emission rate at any given time and the associated good or poor combustion conditions during different burn events such as start-up, steady, burnout phases, or failed combustion.
Visual observations of flame
Unlike a wood-fired room heater, central heating hydronic heaters may or may not have a window on the firebox to observe combustion conditions. The WHH used in this study has a rotating metal disk covering a 1-inch diameter sight opening that allowed the testers to view and assess secondary combustion. The manual states that this sight opening may be used to inspect the combustion flame. Discussions with the manufacturer indicated that a swirling flame in the secondary chamber indicates strong secondary combustion. The visual observations provided insights regarding WHH operation during the various test scenarios and how the visual quality of the flame correlated with PM and CO emissions.
Fueling protocol
The test fuel used in this research consisted of red oak cordwood seasoned for 6 to 8 months indoors in a temperature-controlled facility. Each fuel charge was greater than or equal to 50 pounds. The cordwood piece count, individual weights, and cross-sectional diameters were determined using the fuel specification for cordwood detailed in CSA B415. As described below, some of these specifications were modified for this study.
Moisture content was measured using the method developed by the State University of New York, College of Environmental Science and Forestry (Smith, Neil, and Honghao Citation2014). This procedure for determining overall moisture content requires using a pin-type moisture meter to measure the electrical resistance between two electrodes at four different locations, with two measured in the shell and two measured in the core at the center and end of the wood piece. The average moisture content of the fuel pieces ranged from 18 to 25%, as specified in US EPA 28WHH-PTS. In some test runs, fuel with a moisture content of 15 to 18% was used to assess the impact of using drier fuel.
According to Method 28WHH-PTS, cordwood length shall be 80% of the firebox depth rounded down to the nearest 1-inch increment. For example, with a firebox depth of 46 inches, the piece length would be 36 inches (46 inches x 0.8 = 36.8 inches, rounded down to 36 inches). Fuel pieces are placed in the firebox parallel to the longest firebox dimension. The loading of the test fuel and kindling should follow the manufacturer’s recommendations, subject to the following constraints: up to 10% of the fuel mass may be kindling and paper, which is in addition to the fuel load. Further, up to 10% of the fuel load (i.e., included in the 10 lb/ft3) may be smaller than the main fuel. This “start-up fuel” shall be larger than 2 inches in diameter.
The study assessed five different fueling elements: (1) configuration of kindling fuel; (2) the impact of kindling amount used; (3) impact of fuel piece size; (4) the impact of density and small piece size; and (5) adding an intermediate fuel piece size. The impact of kindling fuel configuration assessed three different kindling approaches. The study completed four to six replicate runs for each configuration. The individual test series were defined by the change in fuel specification per fueling protocol. The tests series are labeled: (1) Kindling Loading Configurations, (2) Reduced Fuel Piece Size, (3) Increased Kindling, (4) Minimal Allowable Piece Size, and (5) Additional Startup Fuel. Within Test Series 1, three different kindling configurations were evaluated without changing any other element of the test run. For all tests, fuel and kindling were loaded in the firebox as one batch and ignited with a commercially available butane lighter with a focus on the starter material (paper) located below the test fuel charge. The full fuel charge consisted of the start-up fuel. Once start up fuel had been ignited, a fuel charge based on a loading volume of five pounds per cubic foot of firebox volume was added to complete the full run. summarizes the study testing plan.
Table 2. Summary of research plan.
Test series 1: Impact of kindling loading configurations
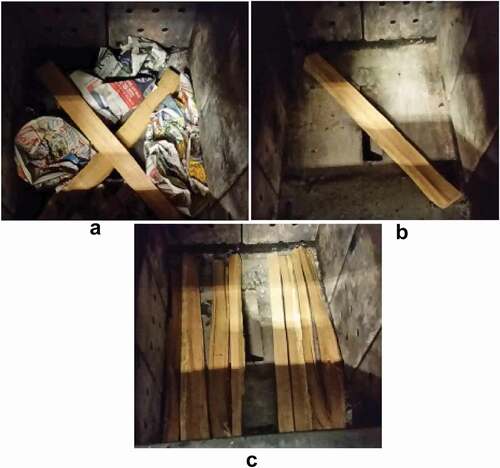
Series 1 evaluated the impacts of three different fueling configurations for starting the fire. Researchers used information from previous Brookhaven National Lab (BNL) research and manufacturer materials to guide appliance start-up procedures. show the different start-up fuel configurations before adding to the main fuel load. Five test runs were completed on each fuel load configuration. For each start-up fuel configuration, at least 5 pounds of kindling and paper were used, up to 10% of the total test fuel charge weight. The main fuel charge followed CSA B415 T 4 requirements per Method 28WHH-PTS to calculate the size and number of pieces. Per CSA B415, for a firebox within the 4 to 10 ft3 (0.11 to 0.28 m3) size range, the fuel charge can be made up of 5 to 10 pieces ranging in cross-sectional diameter from 2.5 to 8.0 inches (64 to 203 mm) with an individual fuel piece weight range from 4.4 to 17.6 pounds (2–8 kg). The appliance used in the study had a firebox size slightly larger than 4 ft3.
Figure 2. Kindling configuration #1, #2, and #3.
Configuration #1
BNL developed this kindling configuration as part of the development of the EPA M28WHH-PTS test method. Loading included two larger pieces of kindling, 2-inches in diameter, placed in an X-formation at the bottom of the firebox and then surrounded by crumpled paper, followed by a thin piece of cardboard on top with a layer of 1-inch diameter kindling pieces. The fuel charge was loaded smallest to largest in piece size.
Configuration #2
Configuration #2 followed instructions in the original operator’s manual (“version 1”) for the test appliance. It is similar to Configuration #1, but rather than using an X-formation for the first layer, a single 2-inch diameter piece was placed diagonally, and then the crumpled paper was placed alongside the loading door. The fuel charge was loaded smallest to largest in piece size.
Configuration # 3
Configuration #3 used instructions from a revised operator’s manual (“version 2”). This configuration laid the pieces in a single direction, leaving a gap in the middle of the firebox. The smallest diameter kindling pieces were placed at the bottom of the firebox, parallel to the down-draft secondary combustion air entrance, followed by a thin piece of cardboard and larger 2-inch diameter starter pieces. Consistent with Configurations #1 and #2, the fuel charge was loaded smallest to largest in piece size.
Test series 2 – Reduced test fuel piece size
Test Series 2 assessed the impact of using the same fuel loading volume but reducing fuel piece sizes in the main fuel charge. The series defined smaller piece sizes using the CSA B415 protocol for firebox volumes less than 4 ft3. This protocol reduced the piece weight range from 4.4 to 17.6 pounds (2–8 kg) to 2.2 to 13.2 pounds (1–6 kg). The piece diameter was also reduced to 2 to 6 inches (51 to 152 mm). Using this approach for Test Series 2, the number of fuel pieces increased by 50% to nine pieces with an average weight of 5.6 pounds. Test Series 2 ran five replicates.
Test series 3 – Increased kindling
Test Series 3 assessed the impact of using different amounts of kindling to start the appliance. This test series used the same parameters as Test Series 1, Kindling Configuration 3. The only change in fueling configuration was doubling the amount of kindling from 10% (1 lb/ft3) to 20% (2 lb/ft3). The main fuel load followed CSA B415 requirements for fireboxes sized 4–10 ft3. Test Series 3 ran five replicates.
Test series 4 – Minimum size allowable fuel piece
Test Series 4 assessed the impact of using smaller pieces that exhibited a greater fuel density than those in Test Series 2 using the CSA B415 directions for fireboxes 4–10 ft3 in size. Fuel selection for this test series focused on pieces that had higher density. The test fuel charge consisted of seven pieces weighing 6.7 pounds each and one fuel piece weighing 4.4 pounds. Pieces were shaved to target fuel weights. Test Series 4 ran six replicates.
Test series 5 – Additional start-up fuel
Test Series 5 assessed the impact of introducing an intermediate fuel size to the start-up procedure. Under this test series, researchers defined kindling as small pieces of wood, with 8–10 pieces per pound. The start-up fuel configuration used slightly larger pieces of fuel, typically weighing 1 to 3 pounds per piece. This fueling approach increased the number of fuel pieces in the start-up fuel charge by 10%. Test Series 5 ran four replicates.
Results
The 2020 Step 2 standards detailed in EPA’s Residential Wood Heater NSPS for Hydronic Heaters (40 CFR § 60.5474) requires each certification test run to obtain emission results at or below 0.15 lb/MMBtu output. The appliance used for this study was certified as Step 2 compliant. While the testing conducted for this study did not include an entire federal test procedure, the 0.15 lb/MMBtu value provides a useful reference for gauging the WHH’s performance with the various start-up procedures since the EPA regulation requires each test run to meet the emission standard. CO concentrations in parts per million (ppm) were recorded at one-minute intervals. PM is reported as a rate in grams per hour (g/hr) at 1-minute intervals. EPA does not have a performance standard for CO, so CO emissions are discussed in relation to PM emissions.
Test series 1 – Assessment of three kindling load configurations
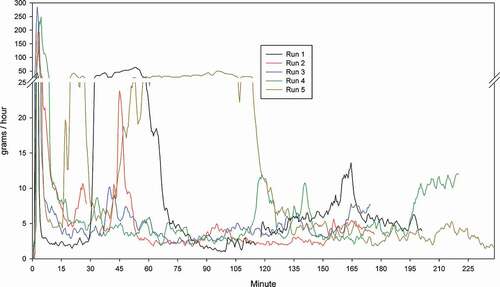
As detailed in , the mean PM emissions for the Category 1 test run using the three different kindling configurations for startup were 0.32 lb/MMBtu for Configuration #3, 0.44 lb/MMBtu for Configuration #2, and 0.51 lb/MMBtu for Configuration #1. During start-up configuration #3, the first fuel layer left the middle of the firebox empty (), possibly providing better airflow through the firebox.
Table 3. Results from test series #1.
The five test runs using Configuration #1 emission rates ranged from 0.25 to 0.77 lb/MMBtu with a mean of 0.51 lb/MMBtu. Configuration #2, which came from the original owner’s manual (version 1), emission rates ranged from 0.20 to 0.92 lb/MMBtu with a mean of 0.44 lb/MMBtu. Configuration #2 had the highest standard deviation (0.28 lb/MMBtu) and the highest individual test run results (Replicate 5 = 0.92 lb/MMBtu). Configuration #3 emission rates ranged from 0.17 to 0.60 lb/MMBtu with a mean of 0.32 lb/MMBtu. Configuration #3 had the smallest range in PM emissions across the five replicate tests of 0.43 lb/MMBtu and the lowest standard deviation of 0.16 lb/MMBtu. Comparing the results of the individual test runs with EPA’s emission standard for cordwood boilers found that none of the individual test runs met the EPA Step 2 emissions standards. The lowest PM emissions for an individual test run of 0.17 lb/MMBtu were observed for Configuration #3.
The three different start-up configurations assessed in Test Series 1 obtained results indicating significant variability in appliance operations. However, there was no correlation between repeatability during start-up with performance repeatability in the steady-state phase. The first fuel Configuration #1 had a start-up coefficient of variation (CV) of 52% and a steady-state CV of 39%. Configuration #2 had a start-up CV of 66% and a steady-state CV of 93%. Configuration #3 had a start-up CV of 29% and a steady-state CV of 66%. While the CV% was similar for Configuration #1 and #2, the CV for steady-state varied widely, indicating that start-up procedures might impact steady-state performance. Configuration #3 had the lowest variability in the start-up phase but did not have the lowest variability in the steady-state phase, indicating the repeatable start-up procedures may not result in repeatable steady-state performance.
As shown in , PM results for the three configurations in Test Series 1 were highly variable. The variability is likely due to how quickly the fuel charge lit off the main fuel charge. However, Configuration #3 yielded the lowest PM emission level using a lb/MMBtu metric and CO by percent metric. The testing conducted for low heat demand (Category 1) indicated that start-up conditions impact emission outcomes well after the start-up period for this appliance since the overall CV was greater for steady-state conditions (CV = 66%) than start-up conditions (CV = 27%). Visual assessments of the fire indicated that the appliance had difficulty maintaining secondary combustion regardless of the start-up configuration.
Figure 3. Real-time PM Emissions Series #1-configuration 1.
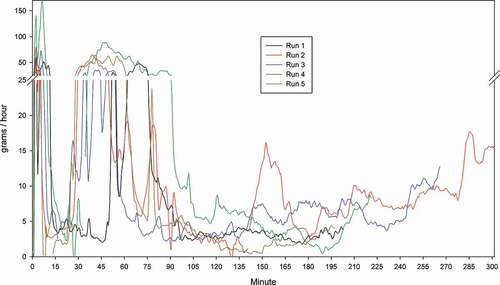
Figure 4. Real-time PM Emissions Series #1-configuration 2.
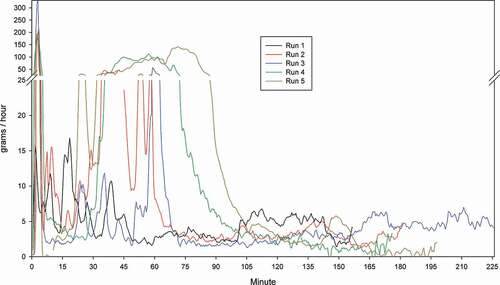
Figure 5. Real-time PM Emissions Series #1-configuration 3.
Test series 2 – Results from reduced test fuel piece size
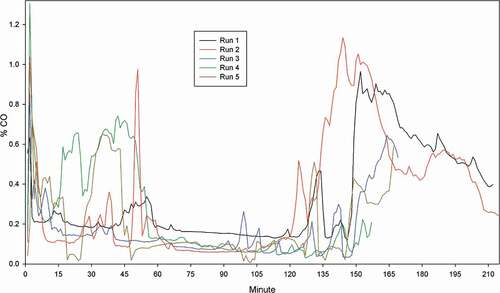
This test series evaluated the emissions and efficiency impacts using smaller fuel piece sizes. As shown in , WHH PM performance using smaller fuel piece sizes ranged from 0.08 to 0.11 lb/MMBtu, with an average of 0.10 lb/MMBtu of PM. This test series yielded the lowest PM emissions and best overall performance out of all five with the least variability (13%), indicating that small fuel pieces improve appliance performance and reduce test run variability, as shown in , the real-time PM emission plot. As shown in , CO concentrations indicate consistent performance when compared to the other test series. Both PM and CO emissions were elevated during the start of the test run. However, PM emissions decreased substantially within the first 15 minutes of the test run, while CO emissions remained elevated in runs 1, 4, and 5 for the first sixty minutes. In runs 2 and 3, CO emissions in the initial stages of the test run were similar. At the end of the test run, CO emissions increased while PM emissions remained at lower levels.
Figure 6. Real-time PM emissions test series #2.
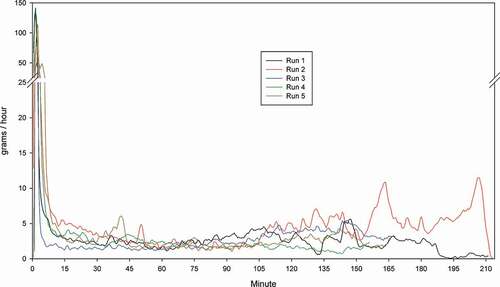
Figure 7. CO profile Test Series #2.
Using small pieces may decrease test run variability but may not reflect typical homeowner use patterns. An EPA goal for new test methods is to create methods more reflective of homeowner use (US EPA Citation2016).
Test series 3 – Increased kindling volume
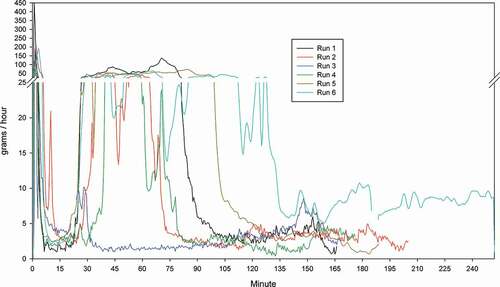
provides the summary results for Test Series 3. Increasing the amount of kindling used for start-up from 10% to 20% of the total test fuel decreased PM emissions across the replicate tests. PM emissions by test ranged from 0.09 to 0.16 lb./MMBtu, with a mean value of 0.11 lb./MMBtu. Using the larger kindling volume, the mean PM emission value decreased from 0.32 lb./MMBtu to 0.11 lb./MMBtu. The standard deviation for PM emissions decreased from 0.16 to 0.03 lb./MMBtu, and the coefficient of variation also decreased from 56% to 26%. The PM ER for four of the five runs fell below EPA’s Step 2 PM emission standard of 0.15 lb./MMBtu. shows the real-time PM emissions for the five replicate runs. The PM performance is similar. However, replicate test runs 1, 3, and 4 experienced a PM emission peak 45 minutes into the steady-state phase that was not observed in runs 2 and 5. The second peak may have resulted from fuel shifting that ignited additional fuel pieces. CO emissions were highly variable and did not track with PM emissions, as highlighted in .
Figure 8. Real-time PM emissions test series 3.
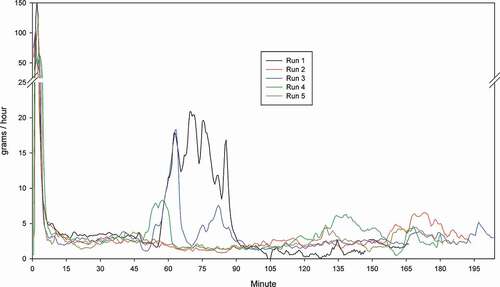
Figure 9. CO profile test series #3.
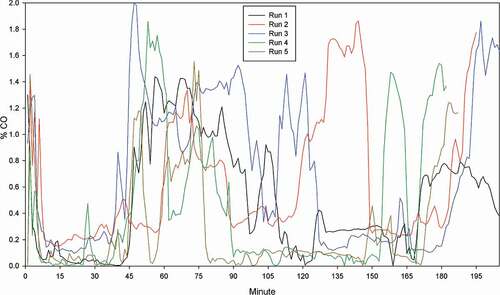
Table 4. Results from Test Series 2.
Table 5. Results from test series 3.
Test series 4 – Increasing fuel density while minimizing fuel pieces sizes
Test series 4 involved using piece sizes with higher fuel density but at the low end of the allowable size range under the existing CSA B415 fuel guidelines for fireboxes sized 4 to 10 ft3. The test series consisted of six replicate runs. summarizes the results from Test series 4. Unlike Test series 3, which had the least variability of all the test series, Test series 4 had the most variability between runs, as seen in , ranging from 0.11–1.13 lb/MMBtu, a 1.02 lb/MMBtu difference. The median PM of 0.60 lb/MMBtu was significantly higher than that measured for any other test series.
Table 6. Results for test series #4.
Figure 10. Real-time PM emissions from Test Series 4.
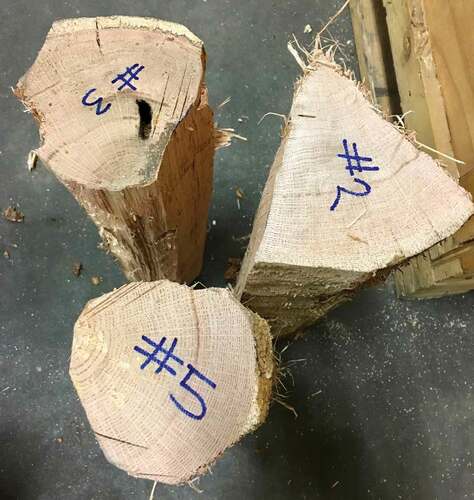
For this test series, fuel pieces were shaved to the proper size and weight to obtain the proper fuel configuration, resulting in a round fuel shape instead of a more typical triangular wedge, as shown in . This change in shape resulted in different surface area to air volume ratios. The fuel piece labeled #3 and #5 are representative of the fuel shaping effort. The fuel piece labeled #2 reflects a typical shape for cordwood. Comparing PM emissions between test series 3 and 4 suggests that fuel geometry, piece size, or density changes can significantly impact PM emission results.
Figure 11. Comparison of fuel shapes.
Test Series 5 – Adding intermediate fuel piece sizes
Test series 5 evaluated the impact of adding additional intermediate-size fuel, referred to as starter fuel. summarizes the data from this test series, and shows the real-time PM values. Four replicate tests were conducted for this series. The average emissions across the four tests were 0.12 lb/MMBtu, ranging from 0.07 to 0.22 lb/MMBtu. These results were comparable to Series 2 and 3, which had the lowest average PM values, and three out of four test runs would meet the EPA Step 2 standard. However, the range of PM emission performance among replicates was 0.15 lb/MMBtu, with a CV of 56%. CO emissions were also consistently low among the replicate tests, with an average of 0.29%, making it the second-lowest of all test series, behind test series 3. Run 4 experienced a second emission peak approximately 50 minutes into the test run. This peak could be due to fuel that fell or shifted during the test run, resulting in the ignition or re-ignition of fuel.
Figure 12. Real-time PM emissions from Test Series 5.
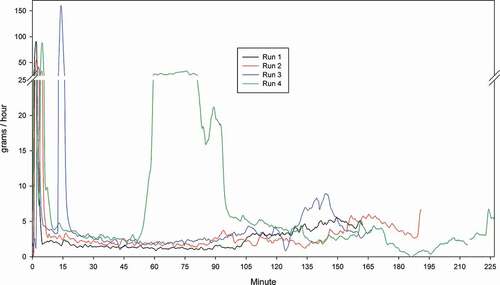
Table 7. Results for Test Series #5.
Discussion
To put these results in perspective, the US EPA NSPS Step 2 emission standard for central heating appliances tested with cordwood is 0.15 lb/MMBtu heat output for each test run. The appliance used in this study represents “smart” technology, meaning it uses an oxygen sensor to adjust airflow into the combustion chamber to optimize burn conditions and likely represents a best-in-class appliance across all residential wood heating technologies. This appliance was certified under the residential wood heater NSPS at 0.12 lb/MMBtu using ASTM E2618 test method. This research indicates that the number of fuel pieces, size of fuel pieces, and the amount of kindling used significantly impact overall WHH PM emissions even when computerized combustion control technology is used. Further study is warranted to determine if these conditions are replicated with other technologies.
The study found that the same protocol run with the different fueling configuration could have a 70% variation in emission results (test series 1 – configuration #1) versus a 26% variation while meeting Step 2 emissions standards when the quantity of kindling doubled, as shown in .
Figure 13. Test series summary – average PM rates per replicate.
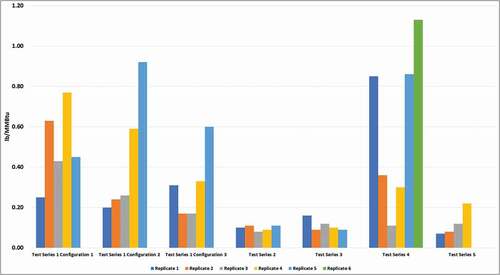
As indicated by the cluster of blue boxes circled in , Test Series 2 and 3 were the only series to consistently obtain reproducible PM emission and CO concentration results. The data also suggest that reducing emission rate repeatability also tracks with the lowest emission performance. This data suggests that using more kindling to start the appliance and loading smaller fuel pieces results in repeatable low emissions performance. However, if the appliance uses less kindling or larger fuel pieces, appliance performance degrades. The use of only small fuel pieces may produce low emissions and consistent results in the laboratory but may not reflect in-field operations where piece sizes can vary greatly. When comparing the five different test series, the results suggest that fuel piece size and shape influence emission outcomes. Since regulations cannot dictate homeowner use, the certification test should include different fuel configurations to assure the appliance operates well in the field regardless of the homeowner’s fuel loading practices.
Figure 14. CO and PM comparison among test series.
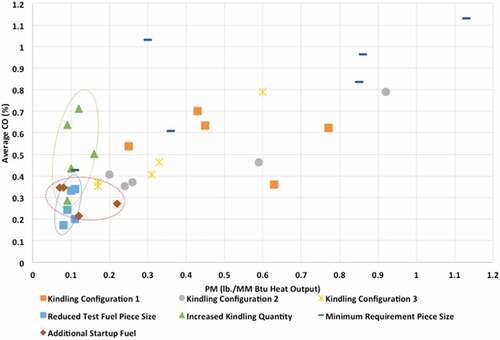
Series 4, the Minimum Allowable Piece Size, produced PM test results that were highly variable with a 66% coefficient of variation. PM emission results ranged from 0.11 lb/MMBtu to 1.13lb/MMBtu. As shown in , using more kindling or smaller and additional fuel pieces improves appliance performance during certification-type testing. These scenarios (test series 2, 3, and 5) delivered the best PM emission performance for the variables evaluated in this study.
Table 8. Summary of test series results: PM, CO, and variability.
Using smaller individual pieces and increasing the amount of kindling used had the greatest impact on reducing variability and emissions. The allowance to modify these elements could significantly impact certification testing outcomes. This conclusion is drawn from comparing the results from Test Series 1, Configuration #3 with Test Series 2 and Test Series 3. The same kindling configuration and main body loading configuration was used in all three test series. Test Series 2 changed one variable, reducing the piece size from 6.7 pounds to 4.6 pounds, reducing the variability between test runs from 0.42 lb/MMBtu (Test Series 1-configuration #3) to 0.03 lb/MMBtu (Test Series 2). Not only did variability decrease, but overall emissions were also reduced. The maximum emission rate during Test Series 2 was 0.11 lb/MMBtu, compared with 0.60 lb/MMBtu during Test Series 1 configuration #3. Comparing the average emissions performance between Test Series 1 configuration #3 and Test Series 2 found that using smaller pieces of wood resulted in a 69% decrease in emission rates. A similar outcome was found when comparing Test Series 1-configuration #3 with Test Series 3.
The only variable changed in Test Series 3 compared to Test Series 1-configuration #3 was doubling the amount of kindling used. This change alone resulted in a 66% reduction in average emissions, from an average of 0.32 lb/MMBtu across five replicates to 0.11 lb/MMBtu. Variation in emissions from run to run also decreased, from 0.43 to 0.07 lb/MMBtu when doubling the amount of kindling. Test Series 5, which compared to Test Series 1-configuration #3, introduced one new variable, adding an intermediate size of fuel. Test Series 1-configuration #3 used all large pieces based on CSA B415 requirements. Test series 2 used small pieces for the main load fuel charge. Test Series 5 used the same main fuel weight but used small, medium, and large pieces. Test Series 5 reduced average emissions from 0.32 to 0.12 lb/MMBtu or 63%. Variability was reduced from 0.43 lb/MMBtu to 0.15 lb/MMBtu.
Many fueling approaches may provide favorable lab results but may not reflect typical real-world operations. Since it is impossible to regulate how a homeowner fuels an appliance in a home, and an appliance is likely to see highly variable fueling practices, the test procedure should include variability in fuel loading configurations. The impact of fuel piece size, as demonstrated in Test Series 2 and 5, suggests that testing should assess performance with different fuel piece sizes and fuel configurations – testing with all small pieces, testing with all large pieces, and testing with mixed fuel size pieces – to assess how an appliance performs under different fueling configurations.
Conclusion
The study demonstrated that modifying fuel piece size, fuel shapes, fuel density, or fuel amounts can impact PM emission performance of an appliance not only on start-up but for several hours after the appliance started operation. Allowing broad discretion in start-up procedures and fuel piece and placement size can significantly impact PM emissions. However, fueling protocols that decrease emissions variability may not reflect common homeowner use patterns. In the future, regulatory agencies should address an inherent tension between reflecting reality and reducing testing variability for future test method development.
This study also highlighted the need to move away from current certification test constructs that only assess performance with one test run under well-controlled steady-state conditions. Currently, none of the US regulatory test methods require any replicate test runs. The replicate analysis reported here demonstrates that under certain conditions, test protocols for biomass combustion appliances can have good reproducibility for down-draft cordwood WHHs with computerized optimization of combustion through control of primary and secondary airflow. Under optimum conditions (Test Series 2), appliance performance ranged from 0.08–0.11 lb/MMBtu and had a 13% coefficient of variation. Test series 2, 3, and 5 produced relatively low and sometimes reproducible PM emission results that fell below the EPA Step 2 emissions standard of 0.15 lb/MMBtu. However, under different conditions (Test Series 4), the same appliance had a performance range of 0.11–1.13 lb/MMBtu and a 66% coefficient of variation. Data from this study suggests that reducing the fuel piece size, adding more kindling, and using starter fuel may improve the combustion performance and lower PM emissions. However, other scenarios evaluated in this study demonstrated that wood heating appliances experience considerable performance variability when responding to different fueling scenarios. Variability of fueling configurations are not assessed under current US regulatory test methods.
This study highlights the challenge and opportunities of developing new certification test procedures. Homeowner performance of cordwood appliances is expected to vary considerably due to the wood species used, piece size, moisture content, the quality and quantity of kindling and starter fuel, and operator practices. Currently, testing procedures only include steady-state operation when the appliance has reached a state of thermal equilibrium. Some test methods have begun to introduce the measurement of start-up periods, such as US EPA’s Partial Thermal Storage. However, those test methods allow the manufacturer to provide instructions that direct many critical elements of the test method that impact the emission outcome of the certification testing, specifically the fuel parameters, which introduces additional variability in emission outcomes. Procedures that direct testing to use practices that result in optimal emissions performance and reduced variability may lead to certification values that are not reflective of in-use operational values. Fueling protocols must be clearly defined to improve future test methods and ensure a common assessment approach.
Impact_of_Fueling_Protocols_on_Emission_Outcomes_for_Certification_Testing_of_Residential_Wood_Heaters_figures_list_3_22_2022.docx
Download MS Word (41 KB)Acknowledgment
The authors thank Dr. Thomas Butcher and Rebecca Trojanowski of Brookhaven National Lab for their assistance in developing protocols for appliance assessment. The research was supported by the New York State Energy Research and Development Authority (NYSERDA) under Agreement Numbers 63025 and 63017. Any opinions expressed in this article do not necessarily reflect those of NYSERDA or the State of New York, and reference to any specific product, service, process, or method does not constitute an implied or expressed recommendation or endorsement of it.
Data availability statement
The data that support the findings of this study are available from NESCAUM upon reasonable request to NESCAUM’s Executive Director.
Disclosure statement
No potential conflict of interest was reported by the author(s).
Supplementary material
Supplemental data for this paper can be accessed on the publisher’s website
Additional information
Funding
Notes on contributors
Kelli O’Brien
Kelli O’Brien is the laboratory manager at ClearStak, an EPA-approved laboratory for residential wood heaters
Lisa Rector
Lisa Rector is a Policy and Program Director at NESCAUM.
Arthur Marin
Arthur Marin is the former Executive Director of NESCAUM.
George Allen
George Allen is the Chief Scientist at NESCAUM.
References
- Ahmadi, M., J. Minot, G. Allen, and L. Rector. 2020. Investigation of real-life operating patterns of wood-burning appliances using stack temperature data. J. Air Waste Manage. Assoc. 70 (4):393–409. doi:10.1080/10962247.2020.1726838.
- Allen, G., B. Morin, M. Ahmadi, and L. Rector. 2022. Online measurement of PM from residential wood heaters in a dilution tunnel. J. Air Waste Manage. Assoc. this issue.doi:10.1080/10962247.2022.2049927.
- ASTM. 2013. Standard test method for measurement of particulate emissions and heating efficiency of solid fuel-fired hydronic heating appliances. Accessed March 19, 2022. https://www.astm.org/e2618-13r19.html
- Bignal, K., S. Langridge, and J. Zhou. 2008. Release of polyaromatic hydrocarbons, carbon monoxide and particulate matter from biomass combustion in a wood-fired boiler under varying boiler conditions. Atmos. Environ. 42:8863–71. doi:10.1016/j.atmosenv.2008.09.013.
- Chen, K., S. Breitner, K. Wolf, M. Stafoggia, F. Sera, A. Vicedo-Cabrera, Y. Guo, S. Tong, E. Lavigne, P. Matus, et al. 2021. Ambient carbon monoxide and daily mortality: A global time-series study in 337 cities. Lancet Planet. Health 5(4):e191–e199. doi:10.1016/S2542-5196(21)00026-7.
- CSA. 2015. CSA B415.1-2010 (R2015). Performance testing of solid-fuel-burning heating appliances. Accessed March 19, 2022. https://webstore.ansi.org/Standards/CSA/CSAB4152010R2015?gclid=Cj0KCQiAoY-PBhCNARIsABcz772s3i8ofz3pkzGBIOgtAH3tKFuz3CQsAMs8-rbnzM_PoFhUSqeilKMaAsZtEALw_wcB
- Di, Q., Y. Wang, A. Zanobetti, Y. Wang, P. Koutrakis, C. Choirat, and J. D. Schwartz. 2017. Air pollution and mortality in the Medicare population. N. Engl. J. Med. 376 (26):2513–22. doi:10.1056/NEJMoa1702747.
- EIA. 2021a. Biomass explained wood and wood waste. Accessed March 19, 2022. https://www.eia.gov/energyexplained/biomass/wood-and-wood-waste.php/
- EIA. 2021b. U.S. Energy facts explained. Accessed October 5, 2021. https://www.eia.gov/energyexplained/us-energy-facts/
- EIA (U.S. Energy Information Administration). 2019. Biomass: Wood and wood waste. Accessed October 5, 2021. https://www.eia.gov/energyexplained/index.php?page=biomass_wood
- EN. 2012. CEN-EN 303-5 Heating boilers – Part 5 Heating boilers for solid fuels, manually and automatically stoked, nominal heat output of up to 500kW – Terminology, requirements, testing and marking. Accessed March 19, 2022. https://standards.cencenelec.eu/dyn/www/f?p=CEN:110:0::::FSP_PROJECT,FSP_ORG_ID:62475,6041&cs=1B39C9E1B3A10A70F319FF4E5711C1F49
- Gibbs, R., and T. Butcher. 2010. Staged combustion biomass boiler: Linking high-efficiency combustion technology to regulatory test methods. Report 10-19, New York State Energy Research and Development Authority. Accessed March 19, 2022. https://www.nyserda.ny.gov/-/media/Files/Publications/Research/Biomass-Solar-Wind/staged-combustion-biomass-boilers.ashx
- He, M., P. Kinney, T. Chen, Q. Sun, J. Ban, J. Wang, S. Liu, J. Goldsmith, and M. Kioumourtzoglou. 2020. Short-and intermediate-term exposure to NO2 and mortality: A multi-county analysis in China. Environ. Pollut. 261:114165. doi:10.1016/j.envpol.2020.114165.
- Heringa, M. F., P. DeCarlo, R. Chirico, A. Lauber, J. Good, J. Good, T. Nussbaumer, A. Keller, H. Burtscher, A. Richard, et al. 2012. Time-resolved characterization of primary emission from residential wood combustion appliances. Environ. Sci. Technol. 46:11418–25. doi:10.1021/es301654w.
- Holubcik, M., J. Jandacka, R. Nosek, and J. Baranski. 2018a. Particulate matter production of small heat source depending on the bark content in wood pellets. Emission Contr. Sci. Technol. 4 (1):33–39. doi:10.1007/s40825-018-0081-y.
- Holubcik, M., J. Jandacka, and N. Kantová. 2018b. Impact of the wood geometric parameters on the particulate matter production in small heat source. AIP Conference Proceedings 2000. 37th meeting of departments of fluid mechanics and thermodynamics, 27–30 June 2018. Sturovo, Slovakia, 0200007. Accessed March 19, 2022. https://doi.org/10.1063/1.5049914.
- Kocbach Bølling, A., J. Pagels, K. E. Yttri, L. Barregard, G. Sallsten, P. E. Schwarze, C. Boman. 2009. Health effects of residential wood smoke particles: The importance of combustion conditions and physicochemical particle properties. Part Fibre Toxicol. 6:29. doi:10.1186/1743-8977-6-29.
- NESCAUM. 2021. Assessment of EPA’s residential wood heater certification program. Accessed March 19, 2022. https://www.nescaum.org/topics/wood-biomass-combustion
- Nussbaumer, T. 2003. Combustion and co-combustion of biomass: Fundamentals, technologies and primary measures for emission reduction. Energy Fuels. 17:1510–21. doi:10.1021/ef030031q.
- Nuutinen, K., J. Jokiniemi, O. Sippula, H. Lamberg, J. Sutinen, P. Horttanainen, and J. Tissari. 2014. Effect of air staging on fine particle, dust and gaseous emissions from masonry heaters. Biomass Bioenergy. 67:167–78. doi:10.1016/j.biombioe.2014.04.033.
- NYSERDA. 2016. New York state energy research & development authority, No. 15-26, New York State wood heat report: An energy, environmental, and market assessment, S-1 (Apr. 2016). Accessed March 19, 2022. https://www.nyserda.ny.gov/-/media/Files/Publications/Research/Biomass-Solar-Wind/15-26-NYS-Wood-Heat-Report.ashx
- Ohlemiller, T. 1986. Smoldering combustion. Berkley CA: Center for Fire Research.
- Orasche, J., T. Seidel, H. Hartmann, J. Schnelle-Kreis, J. Chow, and H. Ruppert. 2012. Comparison of Emissions from wood combustion, Part 1: Emission factors and characterization from different small-scale residential heating appliances considering particulate matter and polycyclic aromatic hydrocarbons (PAH)-related toxicological potential of particle-bound organic species. Energy Fuels. 26:6695–704.
- Siegenthaler, J. 2017. Hydronics for high-efficiency biomass boilers. Renewable Heat New York: Hydronics Training.
- Smith, W. B., K. Neil, and S. H. Honghao. 2014. Evaluation of wood fuel moisture measurement accuracy for cordwood-fired advanced WHHs. Albany: New York State Energy Research and Development Authority (NYSERDA). Accessed March 19, 2022. https://www.nyserda.ny.gov/-/media/Files/Publications/Research/Biomass-Solar-Wind/wood-fuel-moisture-accuracy.pdf
- Tissari, J. 2008. Fine particle emissions from residential wood combustion Doctoral Thesis, Kuopio, Finland: University of Kuopio. Accessed March 19, 2022. https://erepo.uef.fi/bitstream/handle/123456789/9003/urn_isbn_978-951-27-1090-4.pdf
- US EPA. 2015. Standards of performance for new residential wood heater, new residential hydronic heaters and forced-air furnaces. 80FR 13715, March 16. Accessed March 19, 2022. https://www.federalregister.gov/documents/2015/03/16/2015-03733/standards-of-performance-for-new-residential-wood-heaters-new-residential-hydronic-heaters-and
- US EPA. 2016. Process for developing improved cordwood test methods for wood heaters. Accessed March 19, 2022. https://www.epa.gov/burnwise/process-developing-improved-cordwood-test-methods-wood-heaters
- US EPA. 2019a. Test method 28WHH for measurement of particulate emissions and heating efficiency of wood-fired hydronic heating appliances. Accessed March 19, 2022. https://www.epa.gov/sites/default/files/2019-08/documents/method_28_whh_0.pdf
- US EPA. 2019b. Method 28WHH-PTS – A test method for certification of cord wood-fired hydronic heating appliances with partial thermal storage: Measurement of particulate matter (PM) and Carbon Monoxide (CO) Emissions and heating efficiency of wood-fired hydronic heating appliances with partial thermal storage. Accessed March 19, 2022. https://www.epa.gov/emc/method-28-whh-pts-test-method-certification-cord-wood-fired-hydronic-heating-appliances-partial
- Win, K., T. Persson, and C. Bales. 2012. Particles and gaseous emissions from realistic operation of residential wood pellet heating systems. Atmos. Environ. 59:320–27. doi:10.1016/j.atmosenv.2012.05.016.
- Xie, S., K. Mahon, and J. Petersen. 2010. Effects of fuel and operation on particulate emissions from woodburners. Auckland Regional Council technical report TR 2010/061, Accessed March 19, 2022. https://knowledgeauckland.org.nz/media/1795/tr2010-061-effects-of-fuel-and-operation-on-particulate-emissions-from-woodburners.pdf