
 ?Mathematical formulae have been encoded as MathML and are displayed in this HTML version using MathJax in order to improve their display. Uncheck the box to turn MathJax off. This feature requires Javascript. Click on a formula to zoom.
ABSTRACT
Landfill gas composition comprises mainly of methane and carbon dioxide emissions and other Nonmethane Organic Carbons (NMOCs). Methane gas has a global warming potential that is estimated to be 25–36 over 100 years. Interestingly, methane generated from landfills is a renewable source of energy that has been used over the years as a source of electricity generation especially in developed and in some developing countries. However, methane from landfills has been underutilized in South Africa. Due to the recent unreliable electricity disruptions (load shedding) in South Africa, which is caused by a variety of factors. Prioritizing methane produced from landfills for use as a fuel for electricity generation is critical. This will assist to minimize the over-reliance on coal and, reduce the ongoing landfill gas generation. Therefore, the purpose of this study is to estimate the amount of methane emitted from Weltervenden landfill site using the LandGEM version 3.02 and Afvalzorg models and to evaluate the potential utilization of the gases emitted. The study was also aimed at determining the cost and benefits related to the implementation of a landfill gas utilization technology. The findings of this study show that methane emissions from the landfill will peak in the year 2023 with values of 4613 Mg/year and 3128 Mg/year for LandGem and Afvalzorg models, respectively. Also, the total methane emissions from the year 1999 to 2050, are 111,799.25 Mg/year and 27,898.93 Mg/year for both LandGEM and Afvalzorg models, respectively. The LFGcost web model simulations showed that the implementation of a LFG utilization project using Microturbine and CHP microturbine engines are economically feasible. This is considering the sales of electricity to the people. However, considering the sales of electricity generated and Certified Emission Reductions (CER) (carbon credits) to the global market all engines used in this study will be economically feasible.
Implications: The methane emitted from the Polokwane landfill estimated from LandGEM and Afvalzorg models will peak in year 2023 at 4613 Mg/year and 3128 Mg/year, respectively. Also, the total methane emissions from the year 1999 to 2050, are 111,799.25 Mg/year and 27,898.93 Mg/year for both LandGEM and Afvalzorg models, respectively. The LFGcost web model simulations showed that the implementation of a LFG utilization project using Microturbine and CHP microturbine engines are economically feasible. This is considering the sales of electricity to the people. Therefore, implementation of LFG utilization is economically feasible from sales of electricity generated and Certified Emission Reductions
Introduction
The global generation of municipal solid waste (MSW) is currently around 1.3 billion tonnes per year, with forecasts of 2.2 billion tonnes per year by 2025. (Hoornweg, and Bhada-tata Citation2012). The importance of properly managing MSW cannot be emphasized. Some African cities and regions generate MSW at a rate of around 5 × 10⁻⁴ tonnes per person per day, with extreme cases reaching 8 × 10⁻⁴ tonnes per person per day (EGSSAA Citation2009). In advanced countries, however, MSW generation is predicted to range between 10 × 10−4 and 2 × 10⁻³ tonnes per person per day (EGSSAA Citation2009). Africa is unable to collect the majority of its MSW due to inadequate administration, fiscal irresponsibility, a lack of understanding, and inadequacies in maintaining the waste management system. Approximately 90% of the South African’s waste is managed and deposited in landfills (DEA, Citation2011). South Africa produces about 100 million tonnes of general solid waste every year. Approximately, 8 × 10⁻⁴ tonnes of waste per day (3 × 10⁻⁴ tonnes in low-income households and 13 × 10−3 in high-income households) is produced by an average person in South Africa (Njoku, Edokpayi, and Odiyo Citation2020). This is almost the average amount of waste per person produced in developed countries (Njoku, Edokpayi, and Odiyo Citation2020).
The continuous increase in population, urbanization, income and some underlying factors can lead to the continuous increase in MSW (Ferronato and Torretta Citation2019). The increase in waste generated poses greater challenges for Municipalities and other stakeholders to control. When these wastes are deposited in a landfill, several reactions occur within the landfill thereby, emitting greenhouse gases into the atmosphere. This affects both humans and the environmental media (Njoku et al. Citation2018). MSW can also be viewed as a resource particularly when recycled for gainful use.
The management of MSW consists of the systematic functions of waste collection, transfer, resource recovery, recycling and treatment. With the main objective to protect human health, improve environmental quality, develop sustainability and provide support for economic productivity (Henry, Yongsheng, and Jun Citation2006).
When MSW is deposited in a landfill, the organic materials present in the waste undergo decomposition, chemical reaction and volatilization. During these processes in the landfill, gases are emitted from the landfill which are referred to as landfill gases (LFG). According to Williams (Citation2001), LFG are primarily composed of methane (45–60%), Carbon dioxide (40–60%), Nitrogen (2–5%), Oxygen (0.1–1%), hydrogen (0–0.2%), carbon monoxide (0–0.2%), ammonia (0.1–1%), and Non-Methane Organic Compounds (NMOCs). Mismanagement of a landfill can result in uncontrolled emissions of LFG, which contribute significantly to climate change; strong odors, litter, and dust in the surrounding area; and seepage of waste leachate into groundwater and surface water (Capaccioni et al., Citation2011). Greenhouse gases (GHGs) such as CH4 and CO2 pose a major threat to various aspects of the environment, including unprecedented types of flooding, sea-level rise, rainfall pattern distortion, unpredictable and intense hurricanes, massive heat waves, and glacier loss, to name a few (Woudhuysen and Kaplinsky, Citation2009). According to Rogerson (Citation2016) South Africa is one of the world’s most vulnerable regions in terms of climate change. South Africa has been reported to be around 2% hotter and at least 6% drier throughout the 10-year period from 1997 to Citation2006 than it was in the 1970s due to global warming (Blignauta et al., Citation2009). If climate change continues to worsen by 2050, South Africa’s GDP could plummet by 1.5%, which is roughly the amount of yearly foreign investment in the country (Turpie and Visser, Citation2012). Williams (Citation2001) shows that LFG emission is predominately composed of methane and carbon dioxide.
Furthermore, there is no LFG collection and utilization technology installed in the Weltervenden landfill and most South African landfills. Both developed and developing countries are now looking at any locally available, renewable and alternative energy options in order to address the issues of climate change and the provision of cleaner energy and security. However, LFG has been underutilized in South Africa (Couth et al., Citation2011).
Proper LFG utilization is one of the most common approaches to manage the continual emissions of LFG into the environment. LFG can be used in a variety of ways, including direct usage in landfills, electrical power generation, automobile fuel, and bio-methane production (Dudek et al., Citation2010). Therefore, proper strategic methods as mentioned earlier needs to be implemented, so as to, reduce the emissions and proffer a better health and cleaner environment. Therefore, this study seeks to estimate the amount of LFG emitted from Polokwane landfill and the potential use of the LFG for electricity generation.
Literature overview
Several studies have been conducted to estimate the emissions from landfills using different models. However, this study uses the LandGEM and Afvalzorg models to estimate the LFG generated from the landfill sites. shows some studies conducted using models to estimate LFG generation around the world.
Table 1. Studies conducted using different models to estimate the LFG emissions.
TNO, Afvalzorg, GasSim, LandGEM, EPER France model, and EPER Germany models were utilized by Scharff and Jacobs (Citation2006) to simulate LFG generation from three Dutch landfills. The results revealed that the differences in model results were too great (from the highest estimation to the lowest). The results for one landfill were higher than a factor of 20. According to Scharff and Jacobs (Citation2006), it suggests that the models are different and contain a lot of ambiguities among them. However, comparing the differences between all models will result in an improved LFG simulation outcome, data transparency and consistency.
Larsson (Citation2014) used the LandGem, IPCC, and Afvalzorg models to calculate total LFG generation from a Swedish landfill from 1950 to 2050. When the models were compared, it was discovered that CH4 production peaked between 1974 to 1980. However, between 1950 and 2050, the total estimated CH4 emission potential for the LandGEM, IPCC, and Afvalzorg models was 109,331 tons, 35,289 tons, and 26,255 tons, respectively. When comparing LandGEM to the IPCC and Afvalzorg models, the results showed a considerable discrepancy. Similarly, Mou, Scheutz, and Kjeldsen (Citation2015) estimated LFG from a Danish waste disposal site with low organic waste content using the Afvalzorg, LandGem, and IPCC models. The findings revealed that the LandGem model forecasts the greatest quantity of CH4 emitted from the landfill, while the IPCC model estimates 25% to 33% of the LandGEM values. The Afvalzorg model predicted 10% of the LandGEM’s outcomes. Because of its multi-phase category abilities, the Afvalzorg model was shown to be more convenient in estimating LFG from landfills with minimal organic waste. Nonetheless, the Afvalzorg model necessitates a large amount of data, which is readily available from most landfill operators in wealthy countries (Mou, Scheutz, and Kjeldsen Citation2015).
The LandGEM and Afvalzorg models are suitable for LFG simulations, while the IPCC and TNO models are also suitable. Based on several studies on estimation of LFG the Afvalzorg and LandGEM models have shown reasonable results as compared to other models (Di Bella, Di Trapani, and Viviani Citation2011; Farzadkia et al. Citation2015; Larsson Citation2014; Mou, Scheutz, and Kjeldsen Citation2015). The versatility of the Afvalzorg model to simulate waste from many sources, as well as its high ability to underestimate LFG models, are its greatest assets (Oonk, Citation2010). The LandGEM’s strength is its simplicity, as well as its ability to emulate all the LFG’s components. However, because the IPCC model is developed to estimate national LFG emissions and not individual landfills, this study did not use it. It was observed that several LFG model’s results vary among each other; however, the combination of the results gives a better result.
Scarlat et al. (Citation2015) investigated the potential energy from the use of LFG and the burning of MSW in African cities (with efficiency of 20% and 30% for incineration and LFG plants efficiency, respectively). According to the findings, the energy obtained in 2012 was roughly 1125 PJ and is expected to be 2198 PJ in 2025. (assuming all waste generated is collected). The Center for People and Environment (CPE) conducted a study on four different landfills in Nigeria to evaluate the potential electricity generated from the collected LFG. The results demonstrate that using LFG in the four distinct landfills was cost-effective, with an average electricity cost of $0.2 KW/h. As a result, if most of the LFG from landfills and dumpsites is used, some of the country’s economic issues in terms of energy generation can be mitigated. Furthermore, research from Scarlat et al. (Citation2015) in Africa suggests that if MSW generated and collected in African cities is correctly utilized, there will be reduced energy problems in the continent. gives a breakdown of Scarlat et al. (Citation2015) view of waste utilization in the African continent.
Table 2. 2012 Potential energy recoveries from LFG recovery (TJ/year) in urban areas of Africa (Scarlat et al., Citation2015).
The Cost and Benefit implications of an LFG Energy Project demonstrate how utilizing LFG generated from a landfill will benefit both people and the environment. According to Couth et al. (Citation2011), LFG utilization technology is not usually a financially viable endeavor. The LFG utilization is usually in deficit due to the capital cost of implementation and the rate of returns on electricity sales. However, for the LFG utilization project to be considered, selling carbon credits on the international market could be viable. For example, component one (Mariannhill and La Mercy dump sites) of the Durban LFG utilization project sold a 700,000 Certified Emission Reduction (CER) in 2005 for 14 years to the World Bank’s Prototype Carbon funds for $3.95 per tonne of CO2 (Couth et al., Citation2011). Component two (Bisasar landfill) produced 3.1 million CER, and the eThekwini Municipality signed a deal with Trading Emission PLC to sell these to the international market until 2012. In 2009, the international carbon market increased the price of CO2 emissions, which ranged from $11 to $16.3 per tonne of CO2 equivalent (CO2 e), however the price is set by the highest bidder (Couth et al., Citation2011).
The LFG cost model is used in this study to examine the cost and benefit analysis of the predicted amount of LFG from landfills. Internal combustion (reciprocating) engines, gas turbines, micro turbines, and combined heat and power systems are among the several electricity generation alternatives (Jangikhatoonabad, Citation2015). The LFG cost model was used by Jangikhatoonabad (Citation2015) to assess the economic feasibility, environmental, and social consequences of an LFG utilization project in Ghana’s Tema and Tamale landfills. The study found that the Tamale landfill was not environmentally feasible for an LFG utilization project installation, based on the LFG cost model. The Tema landfill, on the other hand, would only be economically viable if a microturbine engine was added. The Tema LFG project would generate 13.2 million kWh of electricity on a yearly basis, with a three-year payback period after construction. Boodhan (Citation2014) utilized the LFG cost model to evaluate the economic feasibility of implementing a landfill gas to energy project in Trinidad and Tobago in the study. The landfills in Beethan, Forres Park, and Guanapo were all used for the study. The analysis concluded that implementing an LFG utilization project in these landfills would be cost-effective. The report from the study served as a benchmark for the government of Trinidad and Tobago’s instrumental policies and recommendations on LFG emissions, collection, and use. Likewise, Cooley et al. (Citation2013) used the LFG cost model to simulate LFG collection costs, which were based on landfill area and electricity generated by landfills. The analysis used a ten percent discount rate and a 15-year project duration. If low-end pipeline costs are employed for the study, the results reveal that some landfills are economically feasible for the execution of an LFG utilization project. However, none of the landfills were economically viable when using high-end pipeline costs.
The gaseous emissions from landfills especially methane gas has been shown to be a very useful source of fuel for electricity, heating, vehicle fuel, etc., commonly in developed nations. However, in developing countries like South Africa, LFG emissions have mostly been left to flow into the atmosphere and thereby contribute to cause air pollution as greenhouse gases. However, a few LFG utilization projects have made some successes in South Africa like the eThekwini Municipality LFG project (in Durban); New England LFG energy project; Environserv Chloorkop LFG recovery project (registered 27th April 2012); Alton LFG project (registered 24th August 2009) and Ekurhuleni LFG project (Njoku et al. Citation2018).
In a study on the estimation of LFGs and their utilization in rural areas of Limpopo, South Africa, the results showed that the methane emissions from the landfill can be utilized for electricity and was economically feasible if managed properly. Therefore, this study is a follow-up study which evaluates a Landfill that manages MSW generated from a location in Polokwane city, which is an urban area in South Africa. The proposed study site, Weltervenden landfill, Polokwane, has not implemented any form of LFG recovery or utilization system. Therefore, this study seeks to calculate the emission of LFG from Weltervenden landfill and evaluate the cost-benefit analysis of implementing an LFG utilization plant in the landfill.
Methodology
Study area
The landfill is located in Polokwane Municipality (). The site started off as a quarry before it was licensed in the year 1998 by the then Department of Water Affairs and Forestry (DWAF). The landfill occupies 35 ha of land with the current slope of 56% from the base. The height of the landfill above the ground is 14 m (28% slopes) western side and 11 m high southern side. The landfill has an eligible notice board displayed in front of the landfill. The landfill is fenced round to avoid unauthorized entry into the landfill site; however, waste inspections are done by the security guard and the transporter who confirm the type of waste it is carrying before they are allowed into the landfill. There is a water tanker spray system which sprays the ground with water often to avoid dust percolation in the landfill area. The landfill currently allows reclaimers on site and most of the reclaimers have their protective clothes on to avoid health and safety hazards in the landfill. Also, there is a weighbridge at the entrance of the landfill, this weigh bridge helps give an accurate result on the amount of waste disposed into the landfill. Weltervenden landfill is the main landfill that manages MSW in Polokwane Municipality. Polokwane Municipality is under the jurisdiction of Capricorn District in Limpopo Province. The Weltervenden landfill is located on longitudes 23° 57` 00.75``S and latitude 29° 29` 48.21``E (Polokwane Municipality Citation2011).
Figure 1. Study area map for Weltervenden landfill.
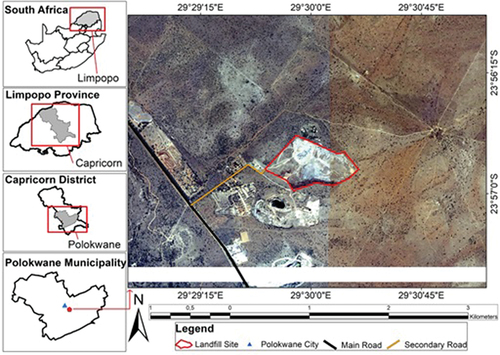
Polokwane Municipality has an estimated population of 508,967 which makes up 10% of the total population living in Limpopo Province (Polokwane Municipality Citation2011). Polokwane Municipality experiences 3.27% annual population growth rate, while the internal migration to cities increases annually at 1.7% (Polokwane Municipality Citation2011). About 71% of the spatial composition of Polokwane Municipality is considered to be rural, while 23% is said to be urban, the remaining 6% is characterized to be demarcated into small buildings, recreational centers and industrial site (Polokwane Municipality Citation2011). Polokwane lies in the summer rainfall region with warm climate, with maximum temperature during December and January in the range of 28.1°C–36.8°C (Polokwane Municipality Citation2011). Polokwane receives approximately 389 mm of rainfall every year, with the greatest amount of rainfall occurring during summer (Saexplorer Citation2017).
Landfill emissions estimation models
Landfill Gas Emission Models LandGEM (Version 3.02
Landfill Gas Emission Models LandGEM (Version 3.02) was developed by the U.S Environmental Protection Agency (EPA) in September 1998. It is a programmed tool for the calculation of emissions of total LFG, CO2, CH4, NMOCs and other air pollutants emitted from a landfill. The model is based on first-order decomposition reaction rate for the estimation of LFG. The formula is shown in Equation 1.
QCH4 = estimate annual methane generation in the year of the calculation (Mg/year); i is the increment in one-year time; n is (year of the calculation) – (initial year of waste acceptance); j is increment in 0.1 year time; k is methane generation rate (/year); Lo is the potential methane generation capacity (m3/Mg); Mi is the mass of waste accepted in the ith year (Mg); tij is the age of the jth section of waste mass Mi accepted in the ith year.
Multi-phase Afvalzorg model
The model was developed by R. Gronert and H.Scharff (NV Afvalzorg Holdings) with the support of the Dutch Environmental Agency. The model is based on a first-order decay. The model simulates the total LFG and CH4 recovery and emission from landfills for which limited data of waste composition is available (Jacobs and Scharff Citation2001). The model formula is represented by equation 2;
αt is the estimated annual landfill gas formation (Mg/year); ζ is the dissemination factor; i is the waste fraction with degradation waste k1,i (kgi/kgwaste); A is the amount of waste in place (tons); C0 is the amount of organic carbon in waste (kg.tonnewaste−1); k1,i is the degradation rate constant of fraction i (/year); t is the time elapsed during deposition (year) (Kamalan, Sabour and Shariatmadari, Citation2011).
As mentioned earlier, the LandGEM and Afvalzorg models were used to estimate the annual LFG generated from Weltervenden landfill site. For this purpose, first a recognizance survey was carried out to understand the mode of operation of the landfill and verify the viability of generating enough LFG for potential use. After this, general information of the landfill was collected from the Local Municipality and South African Waste Information Center (SAWIC) like the total amount of MSW deposited in the landfill annually; the year the landfill commenced operations; the design potential full capacity of the landfill; and waste composition of the landfill (). Also, other relevant parameters were estimated using the countries specific values and the IPCC default values like Degradable Organic Carbon (DOC) (), potential methane generation capacity (L0), Methane Correction Factor (MCF) (managed anaerobic landfill), and degradation constant. Afterward, the data was inputted into the LandGEM and Afvalzorg models, so as to, calculate the emissions from the landfill. The LFGcost model was used to calculate the cost-benefit analysis of implementing a landfill gas utilization technology in the landfill.
Figure 2. Pie chart showing the average annual composition of waste present in the Weltervenden landfill.
Table 3. Values of DOC in Southern African region.
The input data for both the models are shown in .
Table 4. Input data for the simulation of LFG to run the LandGEM and Afvalzorg models.
The total amount of waste deposited in the landfill was derived from the SAWIC website. The methodology used in Njoku, Edokpayi, and Odiyo (Citation2020) to calculate the missing data was adopted in this study.
LFGcost web model (version 3.02)
The LFGcost Model is a spread sheet tool developed for EPA’s Landfill Methane Outreach Programme (LMOP) to simulate the costs of LFG energy project. The Model is useful in obtaining an initial economic feasibility analysis for a specific type of LFG energy project. LFG projects include electricity generation, direct use, boiler retrofit, combined heat and power, leachate evaporation, Compressed Natural Gas (CNG) and high Btu production (US EPA, LFGcost Web model, Version 3.1, 2016). The model was used to determine economic analysis and the feasibility of implementing the LFG utilization technology for the landfill. Four types of electricity-generating technologies were adopted by the model for comparison, which include internal combustion engines (15-year lifetime), gas turbines (15-year lifetime), microturbines (10-year lifetime) and small engine. The main tools for determining the feasibility of the LFG to energy project are the net present value (NPV) and the internal rate of return (IRR), which are the main criterion used for either accepting or rejecting projects in cost–benefit analysis. The NPV is the present value of net cash flow and the project is executed if the NPV is equal to zero or greater than zero and rejected if the NPV is less than zero. Also, IRR value can also be used to determine the viability of an LFG utilization project. If the IRR is greater than the discount rate the project is viable. The input data to run the model is highlighted below.
Landfills open and closure years – refer to
Area of Landfill wellfield to supply project (acres) – 20 or 40
The total amount of the MSW deposited in the landfill annually – Derived from SAWIC website and Municipality
Landfill energy project type – this study looks at five LFG project types including standard turbine, standard engine, microturbine, combined heat and power system (CHP) turbine and CHP microturbine. To evaluate the most appropriate engine type for the project.
Year LFG project begins operation – 2021
Methane generation rate constant k (year−1) – 0.05
Potential methane generation capacity L0 (m3/Mg) – 100
Methane content of LFG in % – 50%
Average depth of landfill (ft) – 65 ft
LFG collection efficiency – 85%
Expected LFG energy project time (years) – 15 years but 10 years for micro-turbine engines
Loan lifetime (years) – 10
Interest rate (%) – 6.75%
Inflation rate (%) – 4.5
Marginal tax rate (%) – assuming a 35%
Discount rate (%) – 1%
Down payment for the project – 50% and 100% for decreasing the amount of years to pay back for the project.
Electricity purchase price for projects not generating electricity (R/kWh) – $0.08 kWh at a rate of $16.60 to 1 rand.
Annual electricity purchase price escalation rate (%) – 2.2%
Results and discussion
LandGem simulations
The results obtained from the LandGem simulations are shown in . The total LFG, CH4, CO2 and NMOC from the landfill site was emitted until 2139. The emissions of CH4 and CO2 will peak in the year 2023 with values of 4.613 × 10³ Mg/year and 1.266 × 10⁴ Mg/year, respectively. The peak emissions of the LFG were as a result of the closure of the landfill in 2022. The year 2022 is the proposed year the landfill will stop receiving MSW, hence, the reduction in LFG emissions. These results generally agree with Aydi (Citation2012); Bhailall et al. (Citation2010) and Njoku, Edokpayi, and Odiyo (Citation2020). These studies also observed a peak in CH4 and CO2 emissions after the first year of the proposed closure year of the landfill.
Figure 3. Graphical representation showing the CH4 and CO2 emissions using the LandGEM.
From the results, the CO2 emissions were recorded to be greater than the CH4 emissions. This has also been observed in previous studies, that the total rate of emission of CO2 is usually higher than CH4 from a landfill (Gardner et al., Citation1993; Liphoto Citation2001; Njoku, Edokpayi, and Odiyo Citation2020). This could be as a result of several factors; however, those studies suggest that the large amount of microbial oxidation of CH4 to CO2 within the landfill cover before reaching the atmosphere was responsible for the lower CH4 emission. Also, the difference in masses between CH4 and CO2, could also lead to higher identification of CO2 than CH4 (Njoku, Edokpayi, and Odiyo Citation2020).
Although strategic plans have been put in place to expand the landfill to accommodate more MSW, the LFG simulated is recorded to decline over a period of 115 years with the LFG emissions becoming very insignificant from 2081 to 2139. The decline in LFG emission is due to the insufficient MSW deposition in the landfill.
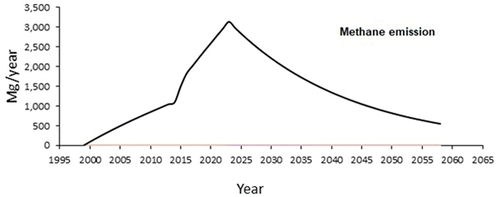
Afvalzorg model simulations
shows that as the waste deposition increased in the landfill, the increase in CH4 emission occurred and it will peak in the year 2023. The peak year simulated by the Afvalzorg model is similar to the results derived from the LandGEM simulation. The maximum emitted values of CH4 from the Weltervenden landfill is 3128 Mg/year. The results show a rapid reduction after the estimated closure of the landfill site until the CH4 emission becomes insignificant. The reduction of the LFG emission as stated earlier is as a result of reduction in the deposition of MSW in the landfill, therefore there is limited amount of waste to generate the LFG. Therefore, the amount of waste deposition is a very fundamental characteristic for LFG emission from a landfill site and the development of both models.
Figure 4. Simulation of CH4 emission from the Weltervenden landfill site using the Afvalzorg model.
Comparison of results simulated from both models
The comparison of results from both models was based on the CH4 emissions from the opening year of the landfill to the year 2040. , simulations from both models show that the CH4 emission will peak in the year 2023 with the CH4 peak emission of the LandGEM reaching a value of 4061 Mg/year and Afvalzorg model reaching a value of 3128 Mg/year. The total potential emission of CH4 from 1999–2040 recorded by the LandGEM and the Afvalzorg models are 85,120.92 Mg/year and 65,556.86 Mg/year, respectively.
Figure 5. Comparison of the simulation of CH4 using the Afvalzorg and LandGEM models for the Weltervenden landfill site.
The results from this study were compared to the results derived from Njoku, Edokpayi, and Odiyo (Citation2020). Njoku, Edokpayi, and Odiyo (Citation2020), conducted a similar study on the estimation of LFG using similar models to this study, for a rural landfill in Thohoyandou, Limpopo South Africa. The Thohoyandou landfill is a smaller landfill and receives lesser MSW on a daily basis when compared to the Weltervenden landfill. The Thohoyandou landfill operates under similar climatic conditions and located in the Limpopo province as the Weltervenden landfill. This study, therefore, seeks to compare the results derived Njoku, Edokpayi, and Odiyo (Citation2020) and this current study. Results derived from Njoku, Edokpayi, and Odiyo (Citation2020), shows that the LandGEM simulations of the peak CH4 emissions was 3517 Mg/year. However, results derived from this study for LandGEM estimations for peak CH4 emissions was 4613 Mg/year. This comparison shows that CH4 peak emissions for this study was higher than the results derived from the Thohoyandou landfill site. This could be that the Weltervenden landfill is bigger and has been accepting waste longer than the Thohoyandou landfill site.
Also, Njoku, Edokpayi, and Odiyo (Citation2020) stipulated those simulations from the Afvalzorg’s model CH4 peak emissions for Thohoyandou landfill was 3336 Mg/year. Surprisingly, this result from Njoku et al. was more than the simulated results derived from Weltervenden landfill (3128 Mg/year). This result could be that the Afvalzorg model gives room to impute the different waste composition deposited in the landfills. Therefore, the result from the Afvalzorg simulations is as a result of the different waste composition of the two landfills. Njoku et al. shows that the waste composition from the Thohoyandou landfill was 81% MSW which has a DOC of 0.2 (High possibility of degrading faster). However, the Weltervenden landfill waste composition comprised of a lower percentage of MSW (43%). With a high waste composition of construction and demolition waste at 31%. The DOC for construction and demolition waste is 0.043, that is, a lower probability of producing LFG quickly). Therefore, the higher result observed from Njoku et al. from Afvalzorg’s model simulations was highly influenced by the waste composition of both landfill sites.
Cost and benefits analysis
, assuming the area of LFG wellfield to supply project is 20 acres and a 50% down payment for the project, the IRR for the project shows a negative value for most of the LFG utilization engines. However, the microturbine shows a positive value of 11 million Rands for the NPV and 5% for the IRR, while the CHP microturbine engine shows a positive NPV (5 million Rands), the IRR value of 16% and a payback period of 8 years. This shows that for the CHP microturbine engine for the LFG utilization project there is a 16% return on investment and 8 years payback period on project’s lifetime.
Table 5. Economic and financial results for the implementation of a LFG Technology for Weltervenden landfill site.
However, this study also assumes a down payment of 100% before commencement of the project at 20 acres as the area of wellfield to supply project. The standard turbine generator set, standard reciprocating engine generator set and CHP turbine showed a negative value for IRR. This signifies that the use of these engines in LFG utilization project, is not economically feasible, based on the scenarios of this study. Meanwhile, the microturbine shows a NPV of 12 million rands and an IRR of 6%. Also, the CHP microturbine shows that there will be a 12% return on investment and 9 years payback period for the LFG utilization project. These CHP microturbine and micro turbine engines are economically feasible since their IRR are positive values.
The study also assumes 40 acres as the area of wellfield to supply project at 50% down payment for the LFG utilization project. The standard turbine engine, standard reciprocating engine, microturbine, and CHP turbine engines have values for IRR as negative. However, the CHP microturbine engine shows a 10% return on investment for the LFG utilization technology. This means that for this current assumption only the CHP microturbine engine is economically feasible for a LFG utilization project.
This study also assumes 40 acres as the area of wellfield to supply project at 100% down payment for the project. The standard turbine generator set, standard reciprocating engine, and CHP turbine engines were not economically feasible engines for the project. The IRR for the above engines is negative except for the microturbine and CHP microturbine engines that had IRR of 1% and 8%, respectively. The CHP microturbine engine, on the other hand, is more economically feasible for the project’s implementation, with an IRR of 8%. This equates to an investment return of 8%.
Environmental and economic benefits
This study calculated the tonnes in CO2e destroyed by the implementation of a LFG utilization technology to determine the environmental benefits and the potential price of the CER sale of the CO2 emitted from the landfill. The LandGEM model’s simulation is used to estimate the total CH4 emitted from the landfill. Converting methane to CO2 equivalent by Couth et al. (Citation2011).
Step 1: assuming LFG utilization plant captures 85% of methane generated
Step 2: convert methane (m3) to tonnes by multiplying by 0.000717 t CH4/m3
Step 3: convert methane (tonnes) to CO2equivalent by multiplying by 25 (assuming methane has a Global Warming Potential (GWP) of 25).
shows the CH4 emitted in tonnes of CO2e and potential CER price for the Thohoyandou LFG utilization technology.
Table 6. A step by step conversion of methane to t CO2e.
The economic benefits of the implementation of a LFG utilization technology in Weltervenden landfill could be considered feasible for all the conventional engines, if the t CO2e is sold in the carbon credit market. The need of these t CO2e is rapidly increasing due to the continuous increase in global warming and climate change.
Total CO2 destroyed from the implementation of a LFG utilization project is 1,280,000 tonnes CO2e and the price of CER assuming $16.3 per CER is $20,900,000 or (Couth et al., Citation2011). The potential amount that can be obtained through the sale of carbon emission is $20,900,000 or 344,850,000 rand (assuming $1 to 14.5 rand). Considering this amount of money derived from the sales of CER in the carbon international market, all the conventional engines used in this study can be considered economically feasible for the implementation of a LFG utilization technology using the Weltervenden landfill when compared to the total capital cost derived in .
Electricity generated
A household in South Africa is assumed to use 2267.97 kWh per year (Eskom) based on the use of household electrical appliances such as fridge, freezer, dishwasher, tumble dryer, television, washing machine and household lighting. It is important to explore the potential to provide household electricity needs from LFGs.
shows the annual electricity in kWh generated from the Weltervenden landfill during the lifetime of the LFG utilization project. The standard reciprocating engines produced the highest amount of electricity from the project. The CHP microturbine and microturbine engines generate the same amount of electricity over the 10 year lifespan of the LFG utilization project. Without the sale of t COe, the CHP microturbine engine is the best fit for the implementation of a LFG utilization project.
Table 7. Annual electricity generated in kWh for the different LFG engines.
Taking into consideration that a South African household uses 2267.97 kWh of electricity per year, the households that will directly benefit from the LFG utilization technology was calculated. shows the average annual electricity generated from each conventional engine in KWh/year and the average number of households to benefit from the electricity generated in Thohoyandou. As stated earlier, the standard reciprocating engine generated the most electricity and also has the highest number of household usage. The standard reciprocating engine-generator set generates an average electricity of approximately 9,366,635.263 KWh/year and will supply an average household of approximately 4130 households every year. CHP microturbine engine generates electricity to approximately 2962 households per year and the CHP turbine engine will supply electricity to approximately 3382 households every year.
Table 8. The average electricity per year generated and the number of household beneficiaries.
Also, shows the average annual electricity generated from each conventional engine in thousands of KWh/year and the average number of households to benefit from the electricity generation. The standard reciprocating engine produced the most electricity and also has the highest number of household beneficiaries to the project. The standard reciprocating engine generated an average electricity of 11,614,910 KWh/year and can supply an average of 5121 households; the standard turbine engine generated an average electricity of about 9,510,968 KWh/year and will supply an average household electricity of approximately 4194 households. Microturbine engine generates electricity to an approximately 3673 households per year and the CHP turbine engine will supply electricity to same number of households like the standard turbine engine.
Conclusion
The LFG models were able to simulate the LFG emissions from Weltervenden landfill and the results were comparable to the results derived from other studies. The study shows that LFG emission peaks a year after the closure of the landfill. Also, the emissions continue to decrease as the years increase after closure of the landfill. The LFGcost models was used to simulate the cost benefits of implementing a landfill gas utilization plant in Weltervenden landfill. The study concludes that the possibility of implementing a LFG utilization plant in Weltervenden landfill is economically feasible, when using a microturbine engines with the sales derived from electricity generated. Also, the use of a CHP microturbine engine to generate electricity, was economically feasible for all scenarios using the LFGcost model. This study will help to enhance government policies concerning emissions from landfills, reduce the continuous emissions from landfills and improve the overall fpower generation sector in South Africa.
According to the objective of this study, the results obtained using the LandGEM and Afvalzorg models to estimate the total LFG in Weltervenden landfills were considered to have provided good estimations when compared to each other and other studies. However, a real-time sub-surface field estimation of the LFG emitted with the aid of gas analyzers to authentically verify how close the LFG estimation from the two models is from reality is required. Also, a comprehensive on ground assessment on the cost and benefits of implementing a LFG utilization plant should be conducted, as the results from this study might not provide only an estimate.
Acknowledgment
The authors appreciatively acknowledge the financial support from Eskom Power Plant Engineering Institute (EPPEI) (E349) and University of Venda.
Data availability Statement
The data that support the findings of this study are available from the corresponding author, (P.O Njoku), upon reasonable request.
Disclosure statement
No potential conflict of interest was reported by the author(s).
Additional information
Funding
Notes on contributors
Prince Obinna Njoku
Prince Obinna Njoku is currently a Ph.D. student in the Department of Ecology and Resource Management, University of Venda. His research focus is on the remediation of environmental pollution, especially its effects on human health. He is currently focused on the possible reduction of gaseous emissions from landfills and the potential impact of these emissions have on human health.
Joshua Nosa Edokpayi
Joshua Nosa Edokpayi has a doctoral degree from the University of Venda, South Africa and a postdoctoral training from the University of Virginia, USA. He is currently a senior lecturer in the School of Environmental Sciences in the University of Venda. He is recognized and rated as a researcher by the National Research Foundation (NRF) of South Africa. He is basically into teaching and postgraduate training of students. His research interest include pollution assessment, impact and mitigation strategies of the environmental media including soil, air and water.
References
- Aydi, A. 2012. Energy recovery from a municipal solid waste (MSW) landfill gas: A tunisian case study. Hydrol. Curr. Res 3 (4):1–3.
- Bhailall, S., S. Piketh, N. Smith, and J. Bogner. 2010. Subsurface gas generation at a landfill in Johannesburg. Clean Air J. Tydskrif vir Skoon Lug 18 (1):10–14.
- Blignauta, J., L. Ueckermannb, and J. Aronsonc. 2009. Agriculture production’s sensitivity to changes in climate in South Africa. S. Afr. J. Sci. 105 (1):61–63.
- Boodhan, G. 2014. An economic analysis of landfill gas to energy projects in the Island State of Trinidad and Tobago. In global interdisciplinary business-economics advancement conference (giba) conference proceedings, 652.
- Capaccioni, B., C. Caramiello, F. Tatàno, and A. Viscione. 2011. Effects of a temporary HDPE cover on landfill gas emissions: Multiyear evaluation with the static chamber approach at an Italian landfill. Waste Manage. 31 (5):956–65. doi:10.1016/j.wasman.2010.10.004.
- Cooley, D., B. Murray, M. Ross, M.Y. Lee, and K. Yeh. 2013. An Economic Evaluation of North Carolina’s Landfill Biogas Development Potential. NIR13-03, Nicholas Institute for Environmental Policy Solutions, Duke University. https://nicholasinstitute.duke.edu/sites/default/files/publications/ni_r_13-03_0.pdf
- Couth, R., C. Trois, J. Parkin, L. J. Strachan, A. Gilder, and M. Wright. 2011. Delivery and viability of landfill gas CDM projects in Africa—A South African experience. Renew. Sust. Energ. Rev 15 (1):392–403.
- DEA (Department of Environmental Affairs). 2011. Draft municipal waste sector plan. Pretoria: Department of Environmental Affairs.
- Di Bella, G., D. Di Trapani, and G. Viviani. 2011. Evaluation of methane emissions from Palermo municipal landfill: Comparison between field measurements and models. Waste Manage. 31 (8):1820–26. doi:10.1016/j.wasman.2011.03.013.
- Donovan, S. M., T. Bateson, J. R. Gronow, and N. Voulvoulis. 2010. Modelling the behaviour of mechanical biological treatment outputs in landfills using the GasSim model. Sci. Total Environ. 408 (8):1979–84. doi:10.1016/j.scitotenv.2009.12.011.
- Dudek, J., P. Klimek, G. Kolodziejak, J. Niemczewska, and J. Zaleska-Bartosz. 2010. Landfill gas energy technologies. Institut nafty i gazu, Kraków.
- EGSSAA. 2009. US Aid from the American people. Retrieved March 15, 2022, from http://www.encapafrica.org/egssaa/solidwaste.pdf
- Fallahizadeh, S., M. Rahmatinia, Z. Mohammadi, M. Vaezzadeh, A. Tajamiri, and H. Soleimani. 2019. Estimation of methane gas by LandGEM model from Yasuj municipal solid waste landfill, Iran. MethodsX 6:391–98. doi:10.1016/j.mex.2019.02.013.
- Farzadkia, M., B. Djahed, S. Shahsavani, and E. Dehghanifard. 2015. Prediction of gas emission and derived electrical power generation from shiraz landfill. Global Nest J. 17 (3):487–97.
- Ferronato, N., and V. Torretta. 2019. Waste mismanagement in developing countries: A review of global issues. Int. J. Environ. Res. Public Health 16 (6):1060. doi:10.3390/ijerph16061060.
- Gardner N., B. J. W. Manley, and J. M. Pearson. 1993. Gas Emissions from Landfills and their Contributions to Global Warming. Appl. Energy. 44 (2): 165–74.
- Henry, R. K., Z. Yongsheng, and D. Jun. 2006. Municipal solid waste management challenges in developing countries–Kenyan case study. Waste Manage. 26 (1):92–100. doi:10.1016/j.wasman.2005.03.007.
- Hoornweg, D., & Bhada-tata. 2012. What a waste, A global review of solid waste. Urban Dev. Ser. Knowl. Papers 15:1–98.
- Jacobs, J., and H. Scharff. 2001. Comparison of methane emission models and methane emission measurements . Göteborg, Sweden: NV Avalzorg.
- Jangikhatoonabad, N. 2015. Feasibility Studies to Support Landfill Gas Recovery in Ghana.
- Kamalan, H., M. Sabour, and N. Shariatmadari. 2011. A review on available landfill gas model. J. Environ. Sci. Technol 2 (4):79–92.
- Larsson, J. 2014. A case study of landfill gas potential at Kikås landfill-Assessment of environmental impacts and alternatives for mitigation ( Master’s thesis).
- Liphoto, L. 2001. The estimation of landfill gas emissions in the Durban Meteropolitan Area (DMA) using the landgem model. MSc Thesis (Environmental Sciences), School of life and environmental Sciences.
- Mou, Z., C. Scheutz, and P. Kjeldsen. 2015. Evaluating the methane generation rate constant (k value) of low-organic waste at Danish landfills. Waste Manage. 35:170–76. doi:10.1016/j.wasman.2014.10.003.
- Municipality, P. 2011. Polokwane Integrated development plan 2011/2016. Open file report, Polokwane Municipality, South Africa.
- Njoku, P. O., J. O. Odiyo, O. S. Durowoju, and J. N. Edokpayi. 2018. A review of landfill gas generation and utilisation in Africa. Open Environ. Sci. 10 (1):1–15. doi:10.2174/1876325101810010001.
- Njoku, P. O., J. N. Edokpayi, and J. O. Odiyo. 2020. Modelling landfill gas potential and potential energy recovery from Thohoyandou landfill site, South Africa. J. Air Waste Manage. Assoc. 70 (8):820–33. doi:10.1080/10962247.2020.1778137.
- Oonk, H. 2010. Literature review: Methane from landfills. Methods to Quantify Generation, Oxidation and Emission. Apeldoorn: OonKay.
- Rogerson, C. M. 2016. Climate change, tourism and local economic development in South Africa. Local Economy 31 (1–2):322–31.
- Saexplorer. 2017. Polokwane Climate. Retrieved November 3, 2017, from http://www.saexplorer.co.za/south-africa/climate/polokwane_climate.asp
- Scarlat, N., V. Motola, J. F. Dallemand, F. Monforti-Ferrario, and L. Mofor. 2015. Evaluation of energy potential of municipal solid waste from African urban areas. Renew. Sust. Energ. Rev 50:269–1286.
- Scharff, H., and J. Jacobs. 2006. Applying guidance for methane emission estimation for landfills. Waste Manage 26 (4):417–29.
- Turpie, J. and Visser, M., 2012. The Impact of Climate Change on South Africa’s Rural Areas (Chapter 4 of Financial and Fiscal Commission: Submission for the 2013/14 Division of Revenue). Financial and Fiscal Commission: Midrand, South Africa.
- Williams, R. R. C. 2001. Landfill gas primer an overview for environmental health professionals. USA: The Agency for Toxic Substances and Disease Registry (ATSDR) USA.
- Woudhuysen, J., and J. Kaplinsky. 2009. Energise!. Beautiful Books.