
ABSTRACT
Airborne particles in urban Palangka Raya, Kalimantan from Oct 2011 until Oct 2020 have been collected and analyzed for PM2.5, PM10, and Black Carbon (BC) concentrations. Palangka Raya is a city that serves the capital of the Central Kalimantan province on the island of Borneo. Kalimantan is affected by peat fires that occur periodically. There were identified increases in PM2.5 and PM10 concentrations during El Niño periods. During the forest fire episode in September – October 2015, PM2.5 and PM10 concentrations increased significantly, to nearly 400 µg/m3 and 800 µg/m3, respectively, and visibility in the city was reduced to < 0.2 miles. The highest BC concentrations were observed during this massive forest fires episode. The regression analyses for PM2.5, PM10 and visibility in Palangka Raya during the period of 2011–2020, showed a non-linear correlation with reduction in visibility due to increased PM2.5 and PM10. There was no correlation for BC with visibility. Air quality in Palangka Raya was at a relatively good level with concentrations below the national ambient air quality standard when there were no forest fires event. Emissions from forest fires caused a substantial reduction in air quality reaching concentrations well above ambient air quality standards and are likely to have caused adverse health effects on the people living in the area.
Implications: Indonesia has repeatedly experienced forest fires, especially on Kalimantan and Sumatera Islands, which burned large areas of peatland. The forest fires leading to increasing PM concentrations especially in the PM2.5 size range which influence visibility. The seasonal variations of BC in Palangka Raya and the relationships of fine particulates with visibility were assessed. The results of regression analyses for PM2.5 and PM10 to visibility during the period of 2011-2020 showed non-linear relationships. An increasing of PM2.5 and PM10 concentrations during El Nino periods were detected well above the ambient air quality standard. To ensure effective and continued handling and prevention of forest and peatland fires, the government set up a special task force and review on several rules, including laws and government regulations as well as governor regulations that permit the burning of forest and peatland areas. These results are expected to be used to formulate more effective mitigations in reducing forest fires events in Indonesia.
Introduction
The impacts of air pollution on the environment as well as human health have acquired greater public attention in recent years, and it has been acknowledged as a major global issue (Brauer et al. Citation2016; Lelieveld et al. Citation2019; Yin et al. Citation2017). Atmospheric particulate matter (PM) is major carriers of carbonaceous material, mineral oxides, water-soluble ions, and metals (Santoso et al. Citation2020a). Atmospheric particles affect radiational forcing, acidification of rivers and lakes and induce adverse health effects in people (Schneidemesser et al. Citation2015). Greater air pollution exposure, including particulate matter, has significant correlation with a higher risk of lung cancer, morbidity, and mortality in many epidemiological studies around the world (Atkinson et al. Citation2016; Liang et al. Citation2019; Maynard et al. Citation2007; WHO, Citation2021). PM10 particles with an aerodynamic diameter of less than 10 µm, PM fine particles with an aerodynamic diameter of less than 2.5 µm, and ultrafine particles (<100 nm) can all infiltrate the lungs, causing adverse health effects and increased mortality (Santoso et al. Citation2020a). Fine particles contributed mainly from anthropogenic combustion sources were more consistently related to adverse health effects (Aguilera et al. Citation2021).
Indonesia has repeatedly experienced forest fires, especially on Kalimantan and Sumatera Islands, which burned large areas of peatland. The fires in Palangka Raya are part of the legacy of the southern peat swamp rice megaproject. A million hectares of swamp were cleared and drained causing an ecological catastrophe. The dried peat and once it burned, was extremely hard to extinguish (https://www.downtoearth-indonesia.org/story/forest-fires). Forest fires are influenced by several factors such as economic issues (crisis, log prices, crude palm oil exports) and natural causes such as the El-Niño phenomenon (Sumaryati, Cholianawati, and Indrawati Citation2019). The fires are known for their adverse impacts on environment, health, ecology, and also the resulting economic losses. Both natural and anthropogenic forest fires emit primary and secondary PM2.5, leading to increasing PM concentrations especially in the PM2.5 size range.
Particle size, mass concentrations and chemical compositions of airborne PM affect visibility. Fine particulate matter (PM2.5) is most effective in scattering visible light and thereby affecting visibility. Visibility reduction comes from a loss of contrast between an object and its background as well as the attenuation of the light signal from an object as it moves to the viewer through light scattering and/or absorption (Liu et al. Citation2020). It is also well-known as an indicator of ambient air quality and may provide a useful tool for assessing health risks posed by pollutants in the atmosphere as well as on public health. Visibility is commonly measured in a specific direction where an object can be seen visually without any assistance (Wang, Dickinson, and Liang Citation2009). Forest fires release a large amount of particulate matter and gases into the atmosphere, which are dangerous pollutants generally referred to as haze. (Viecco et al. Citation2018). Fire reduces the visibility in direct emissions of fine particles (PM2.5 emissions) and gaseous emissions of organic hydrocarbons, which form secondary organic aerosol (SOA) in the atmosphere. Previous studies reported that high concentrations of particulates from Palangka Raya forest fires significantly reduced visibility (Sumaryati, Cholianawati, and Indrawati Citation2019; Yulianti et al. Citation2020).
Black Carbon (BC) is a light absorption measurement that is mainly associated with the non-volatile elemental carbon fraction of PM. It is commonly emitted during combustion processes as a result of combustion in sources such as diesel engines, biomass burning, and pyrolysis of biological material. BC aerosol has been identified as one of factors that significantly affected the air quality and atmospheric light absorption due to its unique physical properties. BC is considered as a short-lived climate pollutant and is the second most significant contributor to global warming after carbon dioxide (CO2) (Bond et al. Citation2013).
We have conducted the assessment of air quality in Palangka Raya for multiple years to gain a more comprehensive understanding of the air quality characteristics of Palangka Raya city. This study discusses the monitored PM and BC data covering the period of 2011 to 2020, compares the normal conditions with the forest fires episode, and evaluates the impact of the forest fires on the PM and BC concentrations, and their correlation with the visibility.
Methodology
Particulate matter sampling
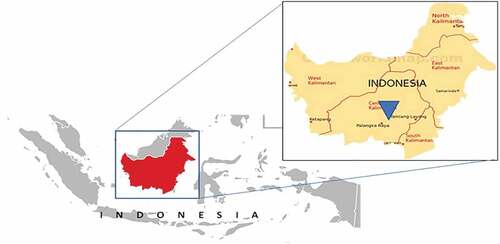
The location of the air quality sampling site was at the office building of EPA of Palangka Raya city, Jl Tjilik Riwut, Central Kalimantan. The site coordinates are 02°11ʹ43.36”S/113°54ʹ05.96 E as shown in . Palangka Raya, with a land area of 2400 km2, is the capital of Central Kalimantan province. Palangka Raya has the largest land area in Indonesia, covering an area 3.6 times that of Jakarta. The population of Palangka Raya in 2017 was 275,667 with a population density of 370 people/km2. The area’s soil consists mostly of peat and alluvium in its southern region and podzol in the northern part of the city. Most industries in Palangka Raya are agricultural and natural products related. The largest part of Palangka Raya’s territory is still forest, including protected forest, production forest, national park, and nature conservation. Hot spots in Central Kalimantan are often observed in the Sebangau Forest (<20 – 100 km to the southwest of Palangka Raya, and in East Kotawaringin (150–200 km to the west of Palangka Raya), which made Palangka Raya one of the cities most affected by the fires. In general, Palangka Raya is a city having three faces: an urban face, a rural face, and its forest face. This condition presents its own challenges for the Palangka Raya City government in developing its metropolitan area. (https://palangkaraya.go.id/selayang-pandang/jumlah-penduduk/).
A dichotomous sampler Gent stacked filter unit (SFU) was set-up on the rooftop of the building about 4–5 m above ground level and about 100 m from the road. There are no tall building and there were no significant changes in the surrounding environment during the sampling period. The Gent SFU particle sampler is capable of collecting particulate matter in two fractions, PM2.5–10 and PM2.5 size (Hopke et al. Citation1997). The coarse fraction sample was collected on an 8 µm pore coated nucleopore filter, and the fine fraction sample was collected on a 0.4 µm pore nucleopore filter. The sampling was carried out for 24 h at least once per week from October 2011-October 2020.
PM and BC measurements
The mass concentrations of PM2.5–10 and PM2.5 were determined by a gravimetric analysis in environmentally controlled room. Moisture content can affect filter weight. The filters were equilibrated for a minimum of 24 hours prior to pre-sampling and post-sampling weighing. During the equilibration period, the relative humidity was maintained at a 45 ± 5%, and air temperature at 20 ± 2°C. Blank and sample filters were weighed before and after sampling using a microbalance with ± 0.001 mg precision (model MX5 Mettler Toledo). The mass concentration of PM2.5 and PM2.5–10 (µg/m3) were obtained from the difference in weight between the coarse and fine filters, respectively, before and after sampling, divided by the volume of air passing through the filter. By summing of those two values, the PM10 mass concentration was obtained.
The BC concentrations were determined by measuring reflectance with an EEL model 43D smoke stain reflectometer (Diffusion Systems Ltd.), which quantifies the reduction of the amount of white light reflected (Biswas et al. Citation2003; Commins and Waller Citation1967; Coulson and Ellison Citation1963). The amount of light reflected or absorbed in the filter sample is determined by the particle concentration, size, density, and refractive index. The BC loading is estimated by measuring the reflectance of light from a tungsten bulb. The uncertainty of the measurement was mainly dependent on the R0 reflectance before and R1 reflectance after sampling. The BC detection limit was 0.02 µg/m3, using the approach by the U.S. Environmental Protection Agency (Salako et al. Citation2012). From our replicate three measurements of sample analyses showed a typical relative percentage difference of 5%. The uncertainty of BC mass could be as high as 15% which, when combined in quadrature with an uncertainty of 5% in ln(R0/R), resulted in a total uncertainty of ±15% (Taha et al. Citation2007). The reflectance value of the sample filter was measured three times after it was placed on a white standard (Lestiani, Santoso, and Hidayat Citation2008). The reflectometer calibration was carried out using the secondary standards with known black carbon concentrations (Begum, Biswas, and Hopke Citation2011; Biswas et al. Citation2003). For the calculation of BC, a mass absorption coefficient used was 5.7 m2/g. This value was established by Maenhaut experimentally determined for reflectance using white light measurement on 47 mm diameter Nuclepore filters (Cohen et al. Citation2000).
Visibility data
Particulate matter is one of the important emissions from forest fires that often forms haze, and it causes a decrease in air quality (Kusumaningtyas and Aldrian Citation2016). These haze episodes have affected on the human health (most vulnerable children and the elderly) and also hampered economic activities and financial loss due to the disease costs and productivity’s loss (Latif et al. Citation2018). According to Permadi et al. (Citation2013), the forest fires in Indonesia were identified as the annual cause of haze that impacted regional air quality in terms of particulate matter (PM), ground level ozone, and visibility locally as well as in neighboring South East Asia countries (Permadi et al., Citation2013). During the sampling periods, visibility data were derived from data exchanged under the World Meteorological Organization (WMO) World Weather Watch Program in accordance with WMO Resolution 40. (Cg-XII) that can be assessed from http://www.ncdc.noaa.gov. The station is located at the Tjilik Riwut Airport near Palangka Raya, 6.7 km from the sampling site. Visibility was measured from 2011–2020. The hourly data were time averaged to provide daily values. Regression analysis was carried out for visibility data vs PM2.5, PM10 and BC, using SigmaPlot V14.
Results and discussion
Particulate matter concentrations
Observation of the air quality during the forest fire episodes has been carried out and a decrease has been observed through the PM concentrations. More than 300 pairs of air sample filters have been collected to assess the air quality of Palangka Raya. The summary statistics obtained from this study are presented in . The yearly average of PM2.5 values were below the annual PM2.5 Indonesian standards (15 µg/m3) except in 2015. The PM2.5 and PM10 concentrations in Palangka Raya were observed to be particularly high during the massive forest fires in October 2015 . Although we did not have complete data for the period of the forest fires in 2015 due to several days of power outage, the 2015 forest fires episode impact on deteriorating the air quality in Palangka Raya was clearly seen, with PM concentrations 10–100 times higher than normal. Concentrations reached 377 and 710 µg/m3 for 24-h of PM2.5 and PM10, respectively. The multiple events of forest fires also can be seen in . PM concentrations increased during the forest fires episodes that typically occurred in August – October. Sumaryati, Cholianawati, and Indrawati (Citation2019) reported that the peak of forest fire activity tends to happen in the end of the dry season in August given the pattern of monsoonal rainfall in most areas of Central Kalimantan. Nevertheless, the fires in 2015 had a greater impact on air quality than fires in previous years. From July to October 2015, the haze was severe due to a very strong El Niño conditions causing very dry conditions and leading to enhanced fire spread and intensity (Latif et al. Citation2018).
Figure 2. Time series of monthly concentration of PM2.5 and PM10 Palangka Raya.
Table 1. The average concentrations of PM2.5 and PM10 in Palangka Raya.
According to Wen et al. (Citation2016), during the 2015 Indonesian forest fires, a thick haze spread over the regions of Malaysia, Singapore, Southern Thailand, Vietnam, Cambodia, and Philippines. Malaysia experienced exacerbation of air pollution during the southwest monsoon (August to September 2015) with the highest Air Pollution Index being 211 (unhealthy) in Selangor Malaysia on 14 September 2015 (Wen et al. Citation2016).
The haze severity was related to the wind direction (Wen et al. Citation2016). Sulong et al. (Citation2017) reported the PM2.5 concentration was 72.3 ± 38.0 µg/m3 exceeding Malaysia Ambient Air Quality Standard, by 2–3 times that of non-haze periods.
The 1 h PM2.5 concentration in Singapore reached a record high of 471 µg/m3 on October 19, 2015 (Sharma and Balasuramanian Citation2018). Kalimantan forest fires also contributed to Malaysian air quality due to the transboundary haze dominated by fine particle (PM2.5) (Fujii et al. Citation2017). The PM2.5 concentration during haze periods were 3–5 times higher. The highest concentration of PM2.5 for 24 h average during haze in 2015 was 136 µg/m3 (Djarum, Ahmad, and Zhang Citation2021).
Following the 2015 forest fires, PM2.5 concentrations decreased as a result of various policy actions such as prohibiting land clearing through burning and strict law enforcement. These findings demonstrate the effectiveness of regulations and policies enacted by both the central and local governments.
The ratio of PM2.5 to PM10 reflects the characteristics of particle pollution since the fine particles (PM2.5) and coarse particles (PM2.5–10) are generally produced from different sources. In the absence of direct measurements, the ratio can provide information about aerosol pollution and be used to characterize the underlying atmospheric processes as well as evaluate the historical PM2.5 pollution. The correlation between PM2.5 and PM10 in Palangka Raya showed that the average ratio of PM2.5/PM10 during the study period was about 0.55, that is indicating the dominant fraction of fine particles in PM10. This ratio might be influenced by the repeated peatland fires during the study period years. Schweizer, Cisneros, and Buhler (Citation2019) showed that the ratio of coarse particulate (PM2.5–10) to fine particulate (PM2.5) was 0.47 and 1.37 with and without smoke events, respectively. These results demonstrated that during the wildland fire, fine particles were the dominant fraction.
Figure 3. The correlation between PM2.5 and PM10 of Palangka Raya aerosol.
Black carbon concentrations
To quantify its contribution to air pollution, we measured BC in PM2.5 collected in Palangka Raya, from 2011 to 2020 as presented in . The BC concentrations were in the range of 0.02–7.74 µg/m3 with an average concentration of 1.15 µg/m3. The average BC fraction of PM2.5 was 14% showing that BC was one of the major contributors of PM2.5 in Palangka Raya. shows a box-whisker plot of BC concentrations from 2011 until 2020 in Palangka Raya. The highest BC concentration were found during the massive forest fires episode in September-October 2015. Pribadi and Kurata (Citation2017) reported that September 2015 was the peak of the fire season and accounted for 66% of the total emissions, with 81% of total emissions were generated from peat fires. As noted above, these severe forest fires in Indonesia not only negatively affected Indonesian air quality, but also were transported to surrounding countries including Malaysia and Singapore.
Figure 4. Box-whisker plot of yearly BC concentration in Palangka Raya. Line represents the median value.
Table 2. The average concentrations of BC in Palangka Raya.
The average concentration of BC in Palangka Raya during 2011–2020 was lower compared to another city on Java Island with the range value from 2.38 to 3.55 µg/m3and within the range of other Indonesian cities outside of Java with averages ranging from 0.66 to 2.78 µg/m3. The lowest average of BC concentration in Palangka Raya was found in 2020, but during this year, sampling activities were not carried out optimally throughout the year due to the implementation of the government’s policy on Large-Scale Social Restrictions (PSBB) to prevent the escalation of the spread of the COVID-19 pandemic. The policy also limits the movement of employees to work in the office which has an impact on sampling. The low concentration of both BC and PM is a reflection of reduced anthropogenic activities, especially the transportation sector. Based on the Santoso et al. (Citation2020b) assessment of Indonesian urban air quality during the multiyear period (2010–2017) in sixteen large Indonesian cities covering Java and the islands other than Java (Sumatra, Kalimantan, Sulawesi, Maluku, and Papua), the average percentages of BC in PM2.5 at the Java sites were ranged from 19.6 to 22.6%. As for the sites outside Java islands, the average percentages of BC in PM2.5 ranged from 15.1 to 26.0%. BC is assumed to be associated with the emission from traffic and biomass burning (Santoso et al. Citation2020b). BC concentrations in Palangka Raya were much lower compared to other major cities such as Dhaka, Bangladesh (12.2 ± 5.9 µg/m3) (Seneviratne et al. Citation2011). This high BC concentration was attributed to be primarily from motor vehicles. The annual concentration of BC in Palangka Raya was higher during 2011–2013 compared to the other years except for 2015. The high BC during those years might be due to smaller fires and other source such as vehicle emission and local biomass burning.
The impacts on visibility
The visibility data taken from National Oceanic and Atmospheric Administration (NOAA) were available every 3 hours. We used the data and compare it with the daily concentration of PM2.5 as shown in . A clear negative correlation can be seen between PM2.5 and visibility. On normal days, the visibility was between 4–6 miles, while during the forest fires episode when high PM2.5 concentrations occurred, the visibility dropped significantly, attaining a minimum value of 0.2 miles. This effect of PM2.5 leading to reduced visibility has been demonstrated in other studies (Sulong et al. Citation2017; Wu et al. Citation2020). Under very severe pollution, haze can also lead to visibility being below 500 m (Ma et al. Citation2014). Furthermore, Pui, Chen, and Zuo (Citation2014) study showed that 500–800 μg/m3 of PM2.5 could result in visibility reduction to <100 m. Luan et al. (Citation2018) showed that in haze events, as PM2.5 increased from 100 to 200 µg/m3, the visibility declined from 5800 to 2700 m.
Figure 5. PM2.5 dan Visibility time series of aerosol in Palangka Raya, 2011–2020.
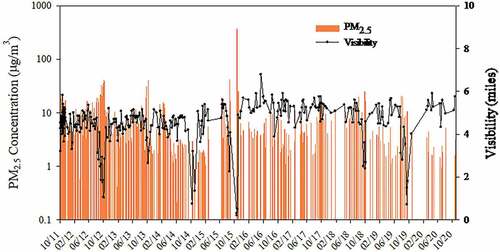
From , it can be seen that the visibility attained low values in October 2012, 2013, 2015, September 2018, and August/September 2019 due to the forest fires episodes. The forest fire episodes in Central Kalimantan were typically peak in September and October (75% of the total hotspots). Other episodes of forest fires occurred outside of the normal fire season. Peatland fires could reach 20,000 hotspots under very strong El Niño conditions as seen in 2015 (Yuliyanti et al., Citation2020). This figure is roughly three times higher than the average number of hotspots. The occurrence of forest fire episodes and the number of hotspots in Palangka Raya also correlated with the El Niño event. The El Niño events began with extremely high-water temperatures in the central and eastern equatorial Pacific Ocean. This causes the east trade winds to slow down as they move from east to west. Clouds are formed from the evaporation of seawater. In the western Pacific Ocean, the air pressure was increasing and the cloud growth in the eastern seas of Indonesia is impeded. This El Niño phenomenon has resulted in a decreased rainfall in several parts of Indonesia, including Central Kalimantan (Susilo et a., Citation2013). The most severe forest fire episodes occurred in 2015 due to the very strong El Niño over a long period (~19 months) (Yulianti et al. Citation2020). In 2019, Indonesia experienced an air pollution haze, which exacerbated forest and peatland fires in several Indonesian provinces including South Sumatra, Riau and Jambi, Central Kalimantan, and South Kalimantan. For several months, these provinces were covered in haze and thick smoke. Increased CO2 emissions have been identified over several years due to the burning of the forest resulting from slash and burn practices (Hooijer et al. Citation2006). Peatland-forest fires are currently a major concern. More than 300 fires were reported in Palangka Raya in August 2019. In August and September 2019, Palangka Raya’s airport Tjilik Riwut was obscured by a thick haze. It is also reported that the visibility at the airport was reduced to 1,300 meters on September 29 (Susetyo et al., Citation2020).
According Awaluddin (Citation2016), the impact on acute illness in forest fires-prone areas is mostly experienced by women aged 18–60 years with the cough being the most common symptom. An extensive study to assess the impact of particulate matter from forest fires reported respiratory symptoms such as colds, coughs, asthma, as well as chronic effects on cardiovascular disorders (Black et al. Citation2017; Finlay et al. Citation2012).
The reduced visibility had an inverse correlation with increasing PM concentration. This pattern is shown clearly in . In 2015, visibility was at the lowest level and PM2.5 at the same time reached its highest concentration. To evaluate the correlations between PM2.5 and visibility, a power function as suggested by Chen (Citation2014) and Wu et al. (Citation2020) was fitted to the data. shows that there were significant reductions in visibility due to increased PM2.5 (6a) or PM10 (6b). Both regression results for PM2.5 and PM10 were in the form of power function, with r2 = 0.798 and 0.822, respectively. Sumaryati, Cholianawati, and Indrawati (Citation2019) suggested that the effect of PM10 to visibility can be clearly seen at higher PM10 concentrations (>50 μg/m3), because at lower PM10 concentrations (< 50 µg/m3), visibility reduction is significantly influenced by many other factors, such as meteorological variables and other pollutants.
Figure 6. Relationships between visibility in miles with PM2.5 (a) and PM10 (b). The solid lines are the plots of the power law equations and the dashed lines present the 95% confidence intervals.
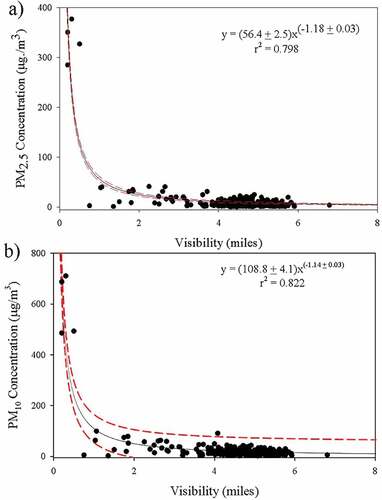
Humidity, wind speed and direction, and temperature all have an impact on the correlation of 24 hours visibility and particulate matter. Particles of ammonium nitrate and ammonium sulfate are hygroscopic, leading to increase particle size with increased humidity (Indrawati et al. Citation2021). This hygroscopic growth exacerbates visibility reduction due to the non-linear increase in light scattering efficiency. Stable meteorological conditions indicated by the low wind speeds combined with temperature inversions, can cause higher PM concentrations and poor visibility (Zhao et al. Citation2013). The regression of visibility with BC resulted in a much lower r2 (0.271) (not shown) because of the limited correlation for BC concentrations below 2 μg/m3. For low BC concentrations, a variety of factors affect the visibility.
Conclusion
Regression analyses for BC, PM2.5, and PM10 and visibility in Palangka Raya during the period of 2011–2020 showed non-linear relationships with reasonable fits using a power function. Increased PM2.5 and PM10 concentrations were identified during El Niño periods. Palangka Raya’s air quality was at a level that is relatively good, with concentrations below the national ambient air quality standard when there were no forest fires. The emissions from forest fires caused substantially diminished air quality reaching concentrations far above ambient air quality standards and likely to have been inducing adverse health effects for the people living in the area.
Acknowledgment
The authors would like to thank the National Nuclear Energy Agency, BATAN, Indonesia for the technical and financial support for this research. The authors gratefully thank the International Atomic Energy Agency (IAEA) for providing funding specifically through the TC INS7007 and TC INS1029 projects. The authors also would like to acknowledge all the staff that have been involved and assisted this study from Center for Applied Nuclear Science and Technology and Environmental Protection Agency of Palangka Raya city. The main contributors of this manuscript are Muhayatun Santoso, Philip K Hopke, Endah Damastuti, Syukria Kurniawati and Diah Dwiana Lestiani.
Disclosure statement
No potential conflict of interest was reported by the author(s).
Data availability statement
The data supporting the findings of this study are available within the article [and/or] its supplementary materials.
Additional information
Funding
Notes on contributors
Muhayatun Santoso
Muhayatun Santoso is a Research Professor in Air Quality and Nuclear Analytical Technique application in Center for Applied Nuclear Science and Technology, National Nuclear Energy Agency (BATAN) of Indonesia.
Philip K. Hopke
Philip K. Hopke is the Bayard D. Clarkson Distinguished Professor Emeritus at Clarkson University and Adjunct Professor in the Department of Public Health Sciences of the University of Rochester School of Medicine and Dentistry.
Endah Damastuti
Endah Damastuti is a Junior Researcher in Nuclear Analytical Technique application in Center for Applied Nuclear Science and Technology, National Nuclear Energy Agency (BATAN) of Indonesia.
Diah Dwiana Lestiani
Diah Dwiana Lestiani is a Senior Researcher in Nuclear Analytical Technique application in Center for Applied Nuclear Science and Technology, National Nuclear Energy Agency (BATAN) of Indonesia.
Syukria Kurniawati
Syukria Kurniawati is a Junior Researcher in Nuclear Analytical Technique application in Center for Applied Nuclear Science and Technology, National Nuclear Energy Agency (BATAN) of Indonesia.
Indah Kusmartini
Indah Kusmartini is a Research Assistant in Center for Applied Nuclear Science and Technology, National Nuclear Energy Agency (BATAN) of Indonesia.
Djoko Prakoso
Djoko Prakoso is a Research Assistant in Center for Applied Nuclear Science and Technology, National Nuclear Energy Agency (BATAN) of Indonesia.
Dyah Kumalasari
Dyah Kumala Sari is a Research Assistant in Center for Applied Nuclear Science and Technology, National Nuclear Energy Agency (BATAN) of Indonesia.
Ahmad Riadi
Ahmad Riadi is a Head of Environmental Laboratory Regional Technical Implementing Unit, The Environmental Agency of Palangka Raya City, Palangka Raya, Indonesia.
References
- Aguilera, R., T. Corringham, A. Gershunov, and T. Benmarhnia. 2021. Wildfire smoke impacts respiratory health more than fine particles from other sources: Observational evidence from Southern California. Nat. Commun. 12 (1):1493. doi:10.1038/s41467-021-21708-0.
- Atkinson, R. W., A. Analitis, E. Samoli, G. W. Fuller, D. C. Green, I. S. Mudway, H. R. Anderson, and F. J. Kelly. 2016. Short-term exposure to traffic related air pollution and daily mortality in London, UK. J. Expo. Sci. Environ. Epidemiol. 26 (2):125–32. doi:10.1038/jes.2015.65.
- Awaluddin. 2016. Public health complaints due to smoke of forest and land fires in Pekanbaru city. Journal of Endurance 1(1):37–46. In Indonesian. doi:10.22216/jen.v1i1.1079.
- Begum, B. A., S. K. Biswas, and P. K. Hopke. 2011. Key issues in controlling air pollutants in Dhaka, Bangladesh. Atmos. Environ. 45 (40):7705–13. doi:10.1016/j.atmosenv.2010.10.022.
- Biswas, S. K., S. A. Tarafdar, A. Islam, M. Khaliquzzaman, H. Tervahattu, and K. Kupiainen. 2003. Impact of unleaded gasoline introduction on the concentration of lead in the air of Dhaka, Bangladesh. J. Air Waste Manage. Assoc. 53(11):1355–62. doi:10.1080/10473289.2003.10466299.
- Black, C., Y. Tesfaigzi, J. A. Bassein, and L. A. Miller. 2017. Wildfire smoke exposure and human health: Significant gaps in research for a growing public health issue. Environ. Toxicol. Pharmacol. 55:186–95. doi:10.1016/j.etap.2017.08.022.
- Bond, T. C., S. J. Doherty, D. W. Fahey, P. M. Forster, T. Berntsen, B. J. DeAngelo, M. G. Flanner, S. Ghan, B. Kärcher, D. Koch, et al. 2013. Bounding the role of black carbon in the climate system: A scientific assessment. J. Geophys. Res. Atmos. 118:5380–552. doi:10.1002/jgrd.50171.
- Brauer, M., G. Freedman, J. Frostad, A. van Donkelaar, R. V. Martin, F. Dentener, R. van Dingenen, K. Estep, H. Amini, J. S. Apte, et al. 2016. Ambient air pollution exposure estimation for the global burden of disease 2013. Environ. Sci. Technol. 50 (1):79–88. doi:10.1021/acs.est.5b03709.
- Chen, J., S. Qiu, J. Shang, O. M. F. Wilfrid, X. Liu, H. Tian, and J. Boman. 2014. Impact of relative humidity and water soluble constituents of PM2.5 on visibility impairment in Beijing, China. Aerosol Air Qual. Res. 14 (1):260–68. doi:10.4209/aaqr.2012.12.0360.
- Cohen, D., G. Taha, E. Stelcer, D. Garton, and G. Box, 2000. The measurement and sources of fine particle elemental carbon or soot at several key sites in NSW over the past eight years. In 15th International Clean Air & Environment Conference, Sydney, Australia. Available at http://www.ansto.gov.au/ansto/environment1/iba/publications/2000-2001/pdf/cleanair2000pap.pdf.
- Commins, B. T., and R. E. Waller. 1967. Observations from a ten-year-study of pollution at a site in the city of London. Atmos. Environ. 1 (1):49–68. doi:10.1016/0004-6981(67)90108-4.
- Coulson, J., and J. K. Ellison. 1963. A calibration of the filter-paper method of estimation of smoke. Br. J. Appl. Phys. 14 (12):899–903. doi:10.1088/0508-3443/14/12/317.
- Djarum, D. H., Z. Ahmad, and J. Zhang. 2021. Comparing different pre-processing techniques and machine learning models to predict PM10 and PM2.5 concentration in Malaysia. Proceedings of the 3rd International Conference on Separation Technology, Johor, Malaysia. pp.353–74. doi: 10.1007/978-981-16-0742-4_25.
- Finlay, S. E., A. Moffat, R. Gazzard, D. Baker, and V. Murray. 2012. Health impacts of wildfires. PLoS Curr. 4:e4f959951cce2c. doi:10.1371/4f959951cce2c.
- Fujii, Y., S. Tohno, N. Amil, and M. T. Latif. 2017. Quantitative assessment of source contributions to PM2.5 on the west coast of Peninsular Malaysia to determine the burden of Indonesian peatland fire. Atmos. Environ. 171:111–17. doi:10.1016/j.atmosenv.2017.10.009.
- Hooijer, A., M. Silvius, H. Wösten, and S. Page. 2006. PEAT-CO2: Assessment of CO2 emissions from drained peatlands in SE Asia. Delft Hydraulics Report Q3943:1–36.
- Hopke, P. K., Y. Xie, T. Raunemaa, S. Biegalski, S. Landsberger, W. Maenhaut, and P. C. D. Artaxo. 1997. Characterization of the gent stacked filter unit PM10 sampler. Aerosol Sci. Technol 27 (6):726–35. doi:10.1080/02786829708965507.
- Indrawati, A., D. F. Andarini, N. Cholianawati, and Sumaryati. 2021. Analysis PM10 and visibility during forest fire in Palangka Raya. IOP Conf. Series:Environ. Earth Sci. 893:012002. doi:10.1088/1755-1315/893/1/012002.
- Kusumaningtyas, S. D. A., and E. Aldrian. 2016. Impact of the June 2013 Riau Province sumatera smoke haze event on regional air pollution. Environ. Res. Lett. 11 (7):075007. doi:10.1088/1748-9326/11/7/075007.
- Latif, M. T., M. Othman, N. Idris, L. Juneng, A. M. Abdullah, W. P. Hamzah, M. F. Khan, N. M. Nik Sulaiman, J. Jewaratnam, N. Aghamohammadi, et al. 2018. Impact of regional haze towards air quality in Malaysia: A review. Atmos. Environ. 177:28–44. doi:10.1016/j.atmosenv.2018.01.002.
- Lelieveld, J., K. Klingmüller, A. Pozzer, U. Pöschl, M. Fnais, A. Daiber, and T. Münzel. 2019. Cardiovascular disease burden from ambient air pollution in Europe reassessed using novel hazard ratio functions. Eur. Heart J 40 (20):1590–96. doi:10.1093/eurheartj/ehz135.
- Lestiani, D. D., M. Santoso, and A. Hidayat. 2008. Characteristic of black carbon in fine particulate matter at Bandung and Lembang sites 2004-2005. Indonesian J. Nuclear Sci. Technol. IX (2):89–94. Agustus 2008 in Indonesian
- Liang, F., X. Yang, F. Liu, J. Li, Q. Xiao, J. Chen, X. Liu, J. Cao, C. Shen, L. Yu, et al. 2019. Long-term exposure to ambient fine particulate matter and incidence of diabetes in China: A cohort study. Environ. Int. 126:568–75. doi:10.1016/j.envint.2019.02.069.
- Liu, J., E. Chen, Q. Zhang, P. Shi, Y. Gao, Y. Chen, W. Liu, Y. Qin, Y. Shen, and C. Shi. 2020. The correlation between atmospheric visibility and influenza in Wuxi city, China. Medicine 99 (32):e21469. doi:10.1097/MD.0000000000021469.
- Luan, T., X. Guo, L. Guo, and T. Zhang. 2018. Quantifying the relationship between PM2.5 concentration, visibility and planetary boundary layer height for long-lasting haze and fog–haze mixed events in Beijing. Atmos. Chem. Phys. 18 (1):203–25. doi:10.5194/acp-18-203-2018.
- Ma, N., C. S. Zhao, J. Chen, W. Y. Xu, P. Yan, and X. J. Zhou. 2014. A novel method for distinguishing fog and haze based on PM2.5, visibility, and relative humidity. Sci. China. Earth. Sci. 57 (9):2156–64. doi:10.1007/s11430-014-4885-5.
- Maynard, D., B. A. Coull, A. Gryparis, and J. Schwartz. 2007. Mortality risk associated with short-term exposure to traffic particles and sulfates. Environ. Health Perspect. 115 (5):751–55. doi:10.1289/ehp.9537.
- Permadi, D. A., and N. T. Kim Oanh. 2013. Assessment of biomass open burning emissions in Indonesia and potential climate forcing impact. Atmos. Environ. 78:250–58. doi:10.1016/j.atmosenv.2012.10.016.
- Pribadi, A., and G. Kurata. 2017. Greenhouse gas and air pollutant emissions from land and forest fire in Indonesia during 2015 based on satellite data. IOP Conf. Ser: Earth Environ. Sci. 54:012060. doi:10.1088/1755-1315/54/1/012060.
- Pui, D. Y. H., S.-C. Chen, and Z. Zuo. 2014. PM2.5 in China: Measurements, sources, visibility and health effects, and mitigation. Particuology 13 (1):1–26. doi:10.1016/j.partic.2013.11.001.
- Salako, G. O., P. K. Hopke, D. D. Cohen, B. A. Begum, S. K. Biswas, G. G. Pandit, Y. S. Chung, S. Abd Rahman, M. S. Hamzah, P. Davy, et al. 2012. Exploring the variation between EC and BC in a variety of locations. Aerosol Air Qual. Res 12 (1):1–7. doi:10.4209/aaqr.2011.09.0150.
- Santoso, M., D. D. Lestiani, E. Damastuti, S. Kurniawati, I. Kusmartini, D. P. D. Atmodjo, D. K. Sari, Tamrin, D. A. Permadi, and P. K. Hopke. 2020a. Long term characteristics of atmospheric particulate matter and compositions in Jakarta, Indonesia. Atmos. Pollut. Res 11 (12):2215–25. doi:10.1016/j.apr.2020.09.006.
- Santoso, M., D. D. Lestiani, S. Kurniawati, E. Damastuti, I. Kusmartini, D. P. D. Atmodjo, D. K. Sari, P. K. Hopke, R. Mukhtar, T. Muhtarom, et al. 2020b. Assessment of urban air quality in Indonesia. Aerosol Air Qual. Res. 20:2142–58. doi:10.4209/aaqr.2019.09.0451.
- Schneidemesser, E., P. S. Monks, J. D. Allan, L. Bruhwiler, P. Forster, D. Fowler, A. Lauer, W. T. Morgan, P. Paasonen, M. Righi, et al. 2015. Chemistry and the linkages between air quality and climate change. Chem. Rev. 115 (10):3856–97. doi:10.1021/acs.chemrev.5b00089.
- Schweizer, D., R. Cisneros, and M. Buhler. 2019. Coarse and fine particulate matter components of wildland fire smoke at Devils Postpile National Monument, California, USA. Aerosol Air Qual. Res. 19 (7):1463–70. doi:10.4209/aaqr.2019.04.0219.
- Seneviratne, M. C. S., V. A. Waduge, L. Hadagiripathira, S. Sanjeewani, T. Attanayake, N. Jayaratne, and P. K. Hopke. 2011. Characterization and source apportionment of particulate pollution in Colombo, Sri Lanka. Atmos. Pollut. Res. 2 (2):207–12. doi:10.5094/APR.2011.026.
- Sharma, R., and R. Balasuramanian. 2018. Size-fractionated particulate matter in indoor and outdoor environments during the 2015 Haze in Singapore: Potential human health risk assessment. Aerosol Air Qual. Res. 18:904–17. doi:10.4209/aaqr.2017.11.0515.
- Sulong, N. A., M. T. Latif, M. F. Khan, N. Amil, M. J. Ashfold, M. I. A. Wahab, K. M. Chan, and M. Sahani. 2017. Source apportionment and health risk assessment among specific age groups during haze and non-haze episodes in Kuala Lumpur, Malaysia. Sci. Total. Environ. 601–602:556–70. doi:10.1016/j.scitotenv.2017.05.153.
- Sumaryati, S., N. Cholianawati, and A. Indrawati. 2019. The impact of forest fire on air-quality and visibility in Palangka Raya. J. Phys: Theor. Appl. 3 (1):16–26. doi:10.20961/jphystheor-appl.v3i1.38071.
- Susetyo, K. E., K. Kusin, Y. Nina, Y. Jagau, M. Kawasaki, and D. Naito. Peatland and forest fires in Central Kalimantan, Indonesia, newsletter of tropical peatland society project. 2019, 2020. Res. Inst. Humanit. 8. https://www.chikyu.ac.jp/peatlands/img/newsletter/vol8.pdf 10 March 2020.
- Susilo, G. E., K. Yamamoto, T. Imai, Y. Ishii, H. Fukami, and M. Sekine. 2013. The effect of ENSO on rainfall characteristics in the tropical peatland areas of Central Kalimantan, Indonesia. Hydrol. Sci. J. 58 (3):539–48. doi:10.1080/02626667.2013.772298.
- Taha, G., G. P. Box, D. D. Cohen, and E. Stelcer. 2007. Black carbon measurement using laser integrating plate method. Aerosol Sci. Technol. 41 (3):266–76. doi:10.1080/02786820601156224.
- Viecco, M., S. Vera, H. Jorquera, W. Bustamante, J. Gironas, C. Dobbs, and E. Leiva. 2018. Potential of particle matter dry deposition on green roofs and living walls vegetation for mitigating urban atmospheric pollution in semiarid climates. Sustainability 10 (7):2431. doi:10.3390/su10072431.
- Wang, K., R. E. Dickinson, and S. Liang. 2009. Clear sky visibility has decreased over land globally from 1973 to 2007. Science 323 (5920):1468–70. doi:10.1126/science.1167549.
- Wen, Y. S., A. Fauzan, N. Nabila, and Z. Sulaiman. 2016. Transboundary air pollution in Malaysia: Impact and perspective on haze. Nova Journal of J. Eng. Appl. Sci 5 (1):1–11. doi:10.20286/nova-jeas-050103.
- World Health Organization (WHO). 2021. WHO global air quality guidelines. Particulate matter (PM2.5 and PM10), ozone, nitrogen dioxide, sulfur dioxide and carbon monoxide. 273. Geneva: World Health Organization.
- Wu, X., J. Xin, X. Zhang, K. Schaefer, Y. Wang, L. Wang, T. Wen, Z. Liu, R. Si, G. Liu, et al. 2020. A new approach of the normalization relationship between PM2.5 and visibility and the theoretical threshold, a case in north China. Atmos. Res. 245:105054. doi:10.1016/j.atmosres.2020.105054.
- Yin, P., M. Brauer, A. Cohen, R. T. Burnett, J. Liu, Y. Liu, R. Liang, W. Wang, J. Qi, L. Wang, et al. 2017. Long-term fine particulate matter exposure and nonaccidental and cause-specific mortality in a large national cohort of Chinese men. Environmental Health Perspectives 125 (11):117002. doi:10.1289/EHP1673.
- Yulianti, N., K. Kusin, D. Naito, M. Kawasaki, O. Kozan, and K. E. Susetyo. 2020. The linkage of el niño-induced peat fires and its relation to current haze condition in Central Kalimantan. Journal of Wetl. Ecol. Manag. 8 (2):100–16. doi:10.20527/jwem.v8i2.221.
- Zhao, H., H. Che, X. Zhang, Y. Ma, Y. Wang, H. Wang, and Y. Wang. 2013. Characteristics of visibility and particulate matter (PM) in an urban area of Northeast China. Atmos Pollut Res. 4 (4):427–34. doi:10.5094/APR.2013.049.