
 ?Mathematical formulae have been encoded as MathML and are displayed in this HTML version using MathJax in order to improve their display. Uncheck the box to turn MathJax off. This feature requires Javascript. Click on a formula to zoom.
ABSTRACT
Improper municipal solid waste (MSW) management leads to contamination of water, soil and air with negative impacts on human health. Moreover, not dealing with residual waste has huge implications for meeting circular economy targets. Understanding how much it costs could lead to a better quality of service and boost environmental sustainability. This study estimates an input distance function using econometric techniques to measure the technical efficiency of the MSW sector in Chile. This approach further allows us to estimate the shadow price of residual waste in terms of total costs. The results indicated that the average technical efficiency of the waste sector was 0.592. This means that the potential savings in costs and residual waste among municipalities could be at the level of 40.8%. Large divergences among municipalities were found since efficiency scores ranged between 0.029 and 0.863. It is found that for 53% of the municipalities evaluated, efficiency scores varied between 0.61 and 0.80. On average, the cost of reducing residual waste was 81.10 US $ per kilogram. This means that on average the cost of preventing one more kilogram of residual waste not being collected and recycled was 81.10 US $. It was also found that on average as population density increased, the shadow price of residual waste increased as well.Implications: The study provides a methodology that allows the policy makers to estimate the efficiency of the solid waste sector where limited available statistical data usually exists in developing and medium-income countries. They have the opportunity to understand what drives costs and identify the best and worst performers. This information is essential to develop local initiatives to enhance waste recycling and therefore, achieving the targets established at national level. Managers can also see if there are other operating factors that could influence performance such as population density. The proposed methodology allows integrating other exogenous variables that might be interesting to policy makers. For instance, a tourism index could be included in the assessment to evaluate whether tourism impacts on the efficiency of municipalities in the provision of municipal solid waste services and therefore, to analyze the implementation of an eco-tax for tourists.
Introduction
The management of municipal solid waste (MSW) has become a global challenge due to limited resources, economic growth, demographic development, climate change and worldwide industrialization (Guerrini et al. Citation2017; Medina-Mijangos et al. Citation2021; Sharma, Ganguly, and Gupta Citation2018). It is found that a 1% increase in gross domestic product could lead to an increase by 0.69% in the generation of waste (Foggia and Beccarello Citation2020; Johnstone and Labonne Citation2004). According to Kaza, Yao, and Bhada-Tatavan (Citation2018), the generation of MSW is expected to grow to 3.4 billion tons by 2050. In the framework of the Sustainable Development Goals (United Nations Citation2015), the collection and recycling of MSW are of great importance for enhancing environmental sustainability and obtaining circular economy targets (Foggia and Beccarello Citation2020). Improvement in these services can be done through the assessment of their efficiency, i.e., the ability of the municipalities to deliver their services with the minimum cost possible (Rogge and De Jaeger Citation2013; Rana, Ganguly, and Gupta Citation2017). Nevertheless, it is also important to assess the performance of MSW service providers from an environmental perspective, i.e., municipalities’ efforts to collect and recycle MSW (Romano and Molinos-Senante Citation2020; Sarra et al. Citation2019). Understanding how operations can be managed more efficiently involve several benefits such as better quality of service, lower tariffs for citizens, and better environmental protection (Diaz-Villavicencio et al., Citation2017; Romano, Rapposelli, and Marrucci Citation2019).
According to an extensive literature review, the efficiency assessment of municipalities in the provision of MSW services can be carried out by two main techniques. On the one hand, several studies have used parametric approaches to assess the efficiency of solid waste sector (e.g., Callan and Thomas Citation2001; Carvalho and Marques Citation2014; Fan et al. Citation2020; Foggia and Beccarello Citation2018, Citation2020; Gellynk and Verhelst Citation2007; Simoes and Marques Citation2011; Swart and Groot Citation2015). Parametric (econometric) approaches such as Stochastic Frontier Analysis (SFA) assume a functional form for the production technology (e.g., Cobb-Douglas, translog) and separate noise from inefficiency. By contrast, non-parametric (linear programming) approaches such as Data Envelopment Analysis (DEA) do not require the specification of a functional form and accommodate multiple inputs and outputs (Campos-Alba et al. Citation2019). They assume that any deviations from the frontier is due to inefficiency only (deterministic) (Coelli et al. Citation2005). This approach has also widely applied to evaluate the performance of solid waste service providers (e.g., De Jaeger et al. Citation2011; Guerrini et al. Citation2017; Marques, Da Cruz, and Carvalho Citation2012; Marques and Simoes Citation2009, Citation2020; Romano and Molinos-Senante Citation2020; Romano, Rapposelli, and Marrucci Citation2019; Sarra, Mazzocchitti, and Rapposelli Citation2017; Simões and Marques, Citation2012; Worthington and Dollery Citation2001). Additionally, some previous research has focused on identifying the drivers of efficiency in the MSW sector (e.g., Benito, Del Rocio Moreno, and Solana Citation2011; De Jaeger et al. Citation2011; Exposito and Velasco Citation2018; Guerrini et al. Citation2017; Jacobsen, Buysse, and Gellynck Citation2013, Citation2012; Simoes, De Witte, and Marques Citation2010).
As past research evidence, most of the studies evaluating the performance of municipalities in the provision of solid waste services focused on European countries such as in Italy, Portugal and Spain. By contrast, this topic has been hardly researched in medium-income countries. Two exceptions are the studies conducted by Llanquileo-Melgarejo et al. (Citation2021) and Llanquileo-Melgarejo and Molinos-Senante (Citation2021) who evaluated the eco-efficiency in the provision of MSW services for several municipalities in Chile including desirable and undesirable products and using non-parametric (DEA) approaches. Additionally, Molinos-Senante and Maziotis (Citation2021) assessed the cost efficiency of the Chilean waste sector by estimating a cost function using SFA techniques. This methodological approach requires the use of prices for inputs and outputs which are not always available in developing and medium-income countries where access to statistical data is limited.
To overcome this limitation, this study assesses the efficiency of municipalities in the provision of MSW services using a distance function approach because it presents the following advantages: i) unlike cost functions, distance functions do not require the use of prices for outputs and inputs; ii) distance function accommodates multiple inputs and outputs in an econometric approach and; iii) this methodological approach allows computing the shadow price of undesirable outputs such as residual waste. The estimated shadow prices through the use of distance functions can be interpreted as the value of externalities that could generate environmental damage if they are not properly controlled (Hernández-Sancho et al., Citation2010). Solid waste sector includes the collection and recycling of both recyclables products and unrecyclable products such as residual waste. If residual waste is not properly managed, it generates a negative effect on the environment (Haraguchi, Siddiqi, and Narayanamurti Citation2019). The United Nations Environment Programme (Citation2015) concluded that the management and disposal of MSW contributed to 3–5% of global anthropogenic greenhouse gas emissions. Hence, understanding, the costs of reducing residual waste could enhance resources efficiency and environmental sustainability.
The main objectives of this study are twofold. The first objective is to estimate the cost of reducing residual waste in municipalities by computing the shadow price of this undesirable output. The obtained results can be used as proxy of environmental costs related to not recycling MSW. The second objective is to assess the efficiency of several municipalities in the provision of MSW services in a medium-income country, i.e., in Chile, using distance functions and stochastic frontier analysis techniques. This a novel approach as, to the best of our knowledge, the estimation of the shadow price of residual waste using distance functions and parametric approaches have not been done before.
Methodology
Technical efficiency of municipalities in the provision of municipal solid waste service
This section outlines the methodology used to estimate the technical efficiency of the Chilean municipalities in the provision of MSW services. The study follows a parametric approach to conduct this analysis which requires the specification of a functional form for the underlying technology. Hence, the production technology is defined as a set of different inputs employed to generate a set of different outputs. Thus, the production technology can be defined as follows:
where denotes production technology,
and
denote inputs and outputs, respectively. Since the production technology is characterized by multiple inputs and outputs, the concept of distance functions is used to measure the technical efficiency of a unit under evaluation (municipalities in our case). Due to limited resources of the Chilean municipalities, it is assumed they want to minimize their costs. Thus, we can define the input distance function,
as follows:
where scalar denotes the maximal proportional reduction in inputs (
) without generating less of output (
). Thus, the input distance function is used to measure the technical efficiency (
) of a unit, a distance from the efficient production frontier (Coelli et al. Citation2013). The input distance function is non-increasing in inputs, non-decreasing in outputs, linearly homogeneous and quasi-concave in inputs (Coelli et al. Citation2003, Citation2005). Since the production technology is hardly known in reality (Coelli et al. Citation2013) an assumption for its functional form is made and then is estimated. Following past literature, the study chooses a translog functional form because it is flexible, allows for homogeneity in inputs and has been widely employed (Brea-Solis, Perelman, and Saal Citation2017; Coelli et al. Citation2013; Kumbhakar, Wang, and Horncastle Citation2015; Molinos-Senante, Porcher, and Maziotis Citation2017; Molinos-Senante, Villegas, and Maziotis Citation2019; Saal, Parker, and Weyman-Jones Citation2007). Thus, the following translog input distance function is defined:
where denotes municipality,
and
are defined as the total number of outputs and inputs, respectively, and
,
,
are parameters to be estimated. The term
represents the error term which follows the normal distribution,
We also included environmental variables,
to capture their impact on municipalities input requirements (Saal, Parker, and Weyman-Jones Citation2007). Imposing homogeneity +1 in inputs the estimable form of EquationEq. (3)
(3)
(3) takes the following form:
where and
presents the technical inefficiency of each municipality
and is assumed to follow the exponential distribution (Molinos-Senante, Porcher, and Maziotis Citation2017; Saal, Parker, and Weyman-Jones Citation2007). Technical efficiency is then recovered as
The restrictions for homogeneity in inputs and symmetry are imposed as follows (Coelli et al. Citation2013):
Shadow price of residual waste
After the estimation of the parameters of EquationEq. (4(4)
(4) ), we calculate the shadow price of one input in terms of another, i.e., the shadow price of residual waste in terms of operating costs. This is done based on the approach developed by Grosskopf, Hayes, and Hirschberg (Citation1995), Morrison Paul and Nehring (Citation2005), Coelli et al. (Citation2013) and others:
In EquationEq. (6(6)
(6) ),
is the elasticity of an input
for any municipality
(Brea-Solis, Perelman, and Saal Citation2017; Molinos-Senante, Porcher, and Maziotis Citation2017).
Based on EquationEq. (6(6)
(6) ), the shadow price (implicit cost) of an input
(i.e., residual waste) in terms of an input
(i.e., operating costs) is calculated:
In EquationEq. (7(7)
(7) ),
and
present the elasticities of an input
and input
for any municipality
, respectively. The terms
and
present the actual (observed) inputs
and
for any municipality
(Maziotis, Villegas, and Molinos-Senante Citation2020; Molinos-Senante, Villegas, and Maziotis Citation2019).
Case study description
Municipal solid waste management in Chile
Our empirical approach focuses on the waste collection and recycling services provided by several municipalities in Chile. The efforts made by the government of Chile to improve the management of MSW are very recent. In 2016, the Law for Promoting Recycling and Extended Producer Responsibility was adopted and its implementation started in mid-2020. According to this law, by 2033, 80% of the households must have a door-to-door collection system for inorganic waste.
The management of MSW involves two main activities: i) collection and transport and ii) final treatment of disposal. While Chilean local authorities (municipalities) are responsible of MSW management, usually both activities are outsourced to private companies. In addition, there are informal recyclers whose role varies depending on the economic level of the municipality. In the most affluent Chilean municipalities, the presence and impact of informal recyclers is minimal. However, in other municipalities where poorer people live, informal recyclers provide a relevant role in the management of MSW (Valenzuela-Levi Citation2021). Currently, having a recycling system is not mandatory for local entities. Actually, according to Valenzuela-Levi (Citation2019), in 2018 around 55% of the Chilean municipalities had implemented some sort of recycling service.
MSW in Chile (both recyclable and residual waste) are collected door-to-door. Public containers for waste disposal are very rare and none of the municipalities analyzed in this study have this waste collection system. MSW which is not recycled is mostly disposed in landfills. According to SINIA (Citation2021), approximately 80% of the solid waste generated in Chile is disposed in landfills.
The management of MSW in Chile is outdated compared to European countries and even to other Latin American countries. In 1994, the European Union adopted the Directive on Packaging and Packaging Waste (Directive 94/62/EC) becoming an international pioneer of the implementation of the extended producer responsibility principle, i.e., European Union introduced this principle 22 years earlier than Chile. This European Directive was the main driver behind the establishment of the current recycling systems presented in almost all European counties. Later, the Directive 2004/12/EC was adopted, which amended the Directive 94/62/EC, setting more ambitious targets for MSW. The adoption of both Directives involved the development of national policies for packaging waste recycling and recovery in European Union countries (Marques and Da Cruz Citation2015). The Packaging and Packaging Waste Directive led to an impressive increase in the recycling rates of all member states (Da Cruz et al. Citation2014). According to the European Environment Agency (Citation2021), the average recycling rate of municipal and packaging waste in European Union is 48%. Nevertheless, as Cetrulo et al. (Citation2018) noted, the presence of a legal context for MSW does not guarantee by itself its good management. By contrast, institutional, political, and cultural issues are also relevant for improving recycling rates. These issues are especially relevant in Latin American countries where informal recyclers usually play a relevant role in the management of MSW.
Data
Our sample consists of 298 Chilean municipalities from a total of 345. This means that our sample covers 79% of the total Chilean population (14,716,132 out of a total of 18,729,160 inhabitants). The data refers to the year 2018 and was downloaded from the National Waste Declaration System (Llanquileo-Melgarejo et al. Citation2021).
The selection of inputs, outputs and environmental variables was based on previous studies on solid waste sector in Chile and elsewhere and data availability (e.g., Rios and Picazo-Tadeo, Citation2021; Romano and Molinos-Senante Citation2020; Sarra, Mazzocchitti, and Rapposelli Citation2017; Simões et al., Citation2010). Thus, our study used two inputs. The first input was the total costs of -MSW management which involves operating expenditure of the collection of solid waste and its final treatment, i.e., recycling or disposal in landfill. It was measured in Chilean PesosFootnote1 per year. The second input was the amount of residual waste measured in tons per year as the aim of the municipalities is to reduce the quantity of residual waste collected and increased the recyclable one. (Guerrini et al. Citation2017; Llanquileo-Melgarejo and Molinos-Senante Citation2021; Marques and Simoes Citation2009; Rogge and De Jaeger Citation2013; Simões et al., Citation2012; Simoes, De Witte, and Marques Citation2010). As far as the outputs were concerned, these were related to the recyclables products and were defined as follows. The first output was the amount of glass collected and recycled measured in tons per year (Llanquileo-Melgarejo and Molinos-Senante Citation2021; Llanquileo-Melgarejo et al. Citation2021). The second output was the amount of other recycled waste measured in tons per year (Bosch, Pedraja, and Suárez-Pandiello Citation2000; Exposito and Velasco Citation2018; García-Sánchez Citation2008; Marques and Simoes Citation2009; Rogge and De Jaeger Citation2013). Finally, in order to control for the different operating characteristics of each municipality population density was included in our analysis (Agovino, Matricano, and Garofalo Citation2020; Halkos and Petrou Citation2019; Romano, Rapposelli, and Marrucci Citation2019). Population density was calculated as the number of inhabitants divided by the area of municipality. The descriptive statistics of the variables used in this study are reported in .
Table 1. Descriptive statistics.
Results and discussion
Input distance function estimation
reports the results from the estimation of the input distance function. It is found that as expected, the elasticities of recycled glass and other recycled waste with respect to cost have a negative sign and statistically significant from zero. This means that as the amount of recycled glass and other recycled waste increases, then costs increase and thus, inefficiency increases as well. In particular, it is shown that on average a 10% increase in the amount of recycled glass and other recycled waste, it could lead to an increase in costs by 0.85% and 1.11%, respectively. This finding illustrates that separative collection and recycling glass and other recycled waste presented economies of scales. From a policy perspective, this result provides evidence of the importance of developing strategies and measures to facilitate separative collection to citizens and implementing low-cost strategies for MSW recycling. The second order term of recycled glass and other recycled waste were negative and statistically significant from zero. This means that both recycled glass and other recycled waste increased at an increasing rate. Based on their estimated coefficients the rate of increase in the collection and recycling of glass and other waste was 3.7% and 1.2%, respectively.
Table 2. Estimates of the input distance function.
The input elasticities of residual waste and total costs were 0.932 and 0.068,Footnote2 respectively. This means that residual waste is a significant cost driver for the MSW sector. This result corroborates the need of implementing low-cost strategies and policies to enhance MSW recycling. The squared term of the residual waste was positive and statistically significant from zero. This means that residual waste had been increasing at a decreasing rate. It evidences the relevant efforts carried out at national and local level to increase recycling rates (Araya-Cordova et al., Citation2021). The interaction term between other recycled waste and residual waste was negative and statistically significant from zero. This means that increasing the amount of other recycled waste increases the elasticity of residual waste as well suggesting that these services might not lead to cost savings. This is because considerable inefficiency exists in the Chilean MSW sector as suggested by the highly statistically significant coefficient of . Finally, population density was found to be negative and statistically significant from zero. This means that keeping other factors constant a 10% increase in population density could lead to a 3.5% increase in the total costs on average. This finding suggests that on average densely populated areas might be confronted with higher collection and recycling costs.
Dependent variable is total cost
Bold indicates that coefficients are statistically significant at 5% significance level
Bold italic indicates that coefficients are statistically significant at 10% significance level
Efficiency and shadow price estimation
summarizes the results from the estimation of technical efficiency and shadow price of reducing residual waste in terms of total costs. The results indicated that, on average, the municipalities were 59.2% technically efficient in the provision of MSW services. This means that the potential reduction in costs among municipalities was at the level of 40.8% on average. Our findings are consistent with previous studies by Llanquileo-Melgarejo et al. (Citation2021) and Llanquileo-Melgarejo and Molinos-Senante (Citation2021) who reported similar levels of efficiency (for instance, 0.54 when undesirable output was incorporated in their analysis). The worst municipality needs to substantially reduce costs and residual waste as the technical efficiency was very low. The best performer reported a technical efficiency score of 0.863. The findings suggest that considerably inefficiency in the Chilean solid waste sector exists. Even the best municipality needs to manage its operations more efficiently. There is a potential of 13.7% in cost savings for this municipality. Because disaggregated information about operational costs (e.g., staff, fuel, regents, etc.) is not available for Chilean municipalities, the main factors in which municipalities should act to save costs cannot be identified. Nevertheless, it would be very useful to identify the best practices applied by the most efficient municipalities that can be shared with their peers to improve the cost efficiency of the provision of MSW services in Chile.
Table 3. Summary statistics of efficiency estimation and shadow price of residual waste for Chilean municipalities analyzed.
On average, the shadow price of residual waste in terms of total costs was 81.10 US $ per kilogram. The shadow price of reducing one kilogram of residual waste varied between 0.809 and 292.753 US $ in total costs. This means that the minimum cost of preventing one more kilogram of residual waste not being collected and recycled was 0.81 US $ whereas the maximum cost of reducing the amount of residual waste was 292.75 US $ per kilogram. This large divergence in the implicit cost of reducing residual waste might be due to notable differences in the resources distribution for MSW recycling among Chilean municipalities (Araya-Córdova et al. Citation2021; Valenzuela-Levi Citation2019). In particular, according to SINADER (Citation2018), the operational costs of providing MSW services in Chile range between 9 CLP/ton and 31,245 CLP/ton. The percentage of residual waste among Chilean municipalities also varies with a minimum value of 51.0% and a maximum of 99.9%.
show the distribution of technical efficiency and shadow price of residual waste in terms of total costs among the Chilean municipalities evaluated. As we can see in , the majority (52.7%) of municipalities had an average technical efficiency score which ranged between 0.61 and 0.80. This means that these municipalities could reduce their operational costs and residual waste up to 39% to improve their performance. Only 9 out of 298 municipalities reported higher levels of technical efficiency. This corresponds only to 3.0% of the whole sample. All of them correspond to urban municipalities which reinforces and complements the conclusions by Araya-Córdova et al. (Citation2021) who reported important differences between rural and urban realities to manage MSW. Moreover, the results showed that 132 out of 298 municipalities reported an average technical efficiency score which was less than 0.60. In particular, 13 municipalities can be considered to belong to the worst performing group as their average technical efficiency score was up to 0.20. The potential savings in costs and residual waste for this group could be up to 80%. Thus, this group needs to make substantial improvements in their managerial practices to catch-up with the more efficient municipalities in the sector. Finally, 89 out of 298 municipalities (29.9%) needed to contract their costs between 40–60% to improve performance.
Figure 1. Histogram showing the distribution of technical efficiency scores for the Chilean municipalities evaluated.
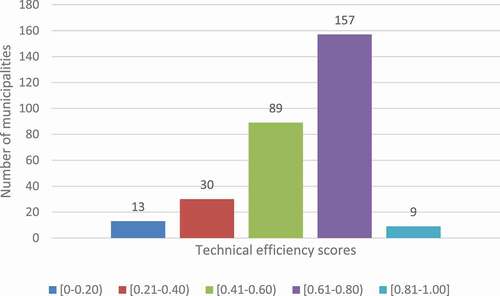
Figure 2. Histogram with distribution of estimated shadow prices of residual waste (US $/kilogram) for the Chilean municipalities.
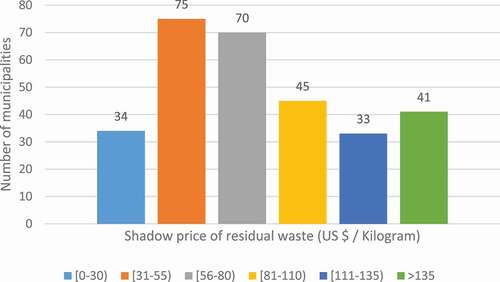
The distribution of the shadow price of residual waste in terms of total costs showed that for the majority of the municipalities the implicit cost of reducing residual waste was up to 80 US $ per kilogram. In particular, for 145 out of 298 municipalities (48.7%), the extra spend in total costs to prevent one additional kilogram of residual waste not being recycled could range from 31 to 80 US $ on average. Several municipalities reported a lower range in reducing residual waste, up to 30 US $ per kilogram for 34 municipalities. It involves that with a moderate effort, these municipalities could significantly improve the environmental management of MSW. By contrast, 78 municipalities reported higher costs for reducing residual waste which varied from 81 to 135 US $ CLP per kilogram. Finally, there were 41 municipalities that were required to spend more than 135 US $ CLP in total costs in order not to have one additional kilogram of residual waste left unrecycled. This group of municipalities are those that currently have not developed any strategy or program to carry out firstly, separative collection and then recycling of MSW. Hence, to achieve the environmental targetsFootnote3 defined by the Chilean Environment Ministry is crucial to take actions to enhance recycling at an affordable cost.
Considering the low efficiency scores of the municipalities evaluated (), the implicit cost of reducing residual waste () and the national targets linked to the Sustainable Development Goals, in the near future it is needed to inject relevant funds into the system for promoting the recycling of MSW. Nevertheless, given the low percentage of solid waste that is recycled in Chile, the strengthening of the current system might be not enough to achieve the proposed targets and alternative tools are required. The use of economic instruments such as a tariff based on “pay as you throw” might be useful to reduce the generation of MSW and improve its management (Marques, Simões, and Pinto Citation2018).
To get a better understanding how population density is related to efficiency and shadow price of residual waste, we need to look into the results reported in . It is found that on average less densely populated areas with less than 10 inhabitants per km2 reported a technical efficiency score of 0.598. This means that these municipalities needed to reduce costs and residual waste by 40.2% to provide the same level of output. The implicit cost of reducing one additional kilogram of residual waste for these municipalities was 70.21 US $. As population density increased, then technical efficiency drops. It is found that municipalities with a density of more than 10 inhabitants but less than 25 inhabitants per km2 showed a mean technical efficiency of 0.573. This finding suggests that in densely populated areas municipalities needed to collect bigger amounts of recyclables and unrecyclable waste. This could impact the costs related to waste services and eventually, efficiency. As population density increased even further, between 25 and 100 inhabitants per km2 efficiency remained unstable. The additional spend in total costs to prevent one kilogram of residual waste left unrecycled was 86.24 US $. This finding suggests that moderate size municipalities were less technically efficient than small size municipalities. Eventually when population density exceeded the 100 inhabitants per km2 technical efficiency increased. For large municipalities mean technical efficiency was 0.667, which implies that the potential saving in costs and residual waste among these municipalities was 33.3%. In those areas the cost of reducing residual waste was found to be higher that other areas, 89.32 US $ per kilogram. Overall, the results indicated that there was a positive relationship between population density and the shadow price of residual waste. As density increased, the additional cost needed to be spent by each municipality to deal with one additional kilogram of residual waste increased as well. As population density increased, technical efficiency decreased. This impact would eventually disappear at adequately high levels of population density. The findings of our study are corroborated by previous studies from Simoes and Marques (Citation2012), Guerrini et al. (Citation2017) and Romano and Molinos-Senante (Citation2020) who found that at high levels of population density municipalities’ solid waste services were more efficient than at lower levels because larger equipment could not be used in narrow streets.
Table 4. Technical efficiency and shadow price of residual waste based on population density.
Considering that Chilean municipalities are responsible for managing MSW in their corresponding territories without mandatory recycling initiatives (Valenzuela-Levi et al., Citation2021), the potential link between efficiency and shadow price of residual waste and Chilean regions is explored (). The most densely populated areas with a high number of municipalities are the Metropolitan region of Santiago and Valparaiso. The former has 49 municipalities with a density of 5672 inhabitants per km2, whereas the latter has 38 municipalities with a density of 238 inhabitants per km2. On average these areas appeared to be relatively more efficient than other less densely populated areas in the sector. In particular, the Metropolitan region of Santiago, which includes the capital of the country, reported an average efficiency score of 0.621 which means this area could further reduce its costs by 38% to generate the same level of outputs. The additional total cost that needed to be spent by these two regions (Metrolopitana of Santiango and Valparaiso) to recycle one additional kilogram of residual waste was 93.47 and 88.09 US $, respectively. This cost is relatively higher than the obtained for the rest of the Chilean regions with the exception of two regions located in the south and north parts of Chile, which are pretty isolated areas.
Table 5. Efficiency and shadow price of reducing residual waste by Chilean region.
The most technically efficient regions in our sample were Ñuble and Bernardo O’ Higgins, with a density of 32 and 81 inhabitants per km2, respectively. In these regions the potential savings in costs and residual waste could be at the level of 34% and 36%, respectively. Less densely populated areas appeared to be relatively less efficient than moderate and large regions. The worst performer was the region of Antofagasta with a mean technical efficiency of 0.311. The cost of reducing one additional kilogram of residual waste in this region was relatively high, 83.70 US $. A similar situation is evident for the Tarapaca who was found to be the second worst performer in the waste sector. It reported the one of highest implicit costs to reduce residual waste, 99.34 US $ per kilogram, whereas its mean technical efficiency was 0.385.
Conclusion
Understanding what drives costs in waste sector could be of great importance as it will help the stakeholders to enhance their performance from a technical and environmental perspective. In this paper, the technical efficiency of several municipalities that provide waste collection and recycling services in Chile is estimated using parametric techniques. As the environmental impact of recycled waste and residual waste is notably different, both types of waste are differentiated in our analysis. Most importantly, the shadow price (implicit cost) of reducing residual waste in terms of total costs is derived, which could be used to improve the economic and environmental sustainability of the sector. The findings of our study can be summarized as follows.
The results showed that the collection and recycling of recyclable products such as glass and other waste had a significant impact on waste costs. Another factor that had a significant impact on costs was population density. Moreover, substantial technical inefficiency in the Chilean waste sector exists. The mean technical efficiency was 0.592 which means that the potential savings in costs and residual waste among municipalities could be at the level of 40.2%. From an environmental perspective, it has been illustrated that the recycling rates in Chile are very poor and therefore, the policy in the recycling of MSW should be further developed since there is notable room for improvement. Considering the low efficiency reported by Chilean municipalities, more financial incentives should be provided at national and local level. The Chilean Environmental Ministry should provide more financial subsidies to municipalities to implement recycling systems at local level. Moreover, local entities could carry out educational campaigns to raise awareness about the relevance of selective collection of MSW as a first step for their recycling. It is also suggested the implementation of more recycling drop-off points to ease separative collection of MSW. The mean shadow price of reducing residual waste was 81.10 US $ per kilogram. This means that on average the extra spend in total costs to deal with one additional kilogram of residual waste was 81.10 US $. Moreover, it was found that as population density increased the implicit cost of reducing residual waste increased as well. Additionally, areas with high levels of density appeared to be more efficient than moderate and small size areas. This was the case for municipalities with a density higher than 100 inhabitants per km2.
Overall the methodology employed and the results from this study have interesting policy implications. The study provides a methodology that allows the policy makers to estimate the efficiency of the solid waste sector where limited available statistical data usually exists in developing and medium-income countries. They have the opportunity to understand what drives costs and identify the best and worst performers. Considering that efficiency scores and shadow prices are estimated at local level, results are essential to develop local initiatives to enhance waste recycling and therefore, achieving the targets established at national level. The identification of the municipalities whose performance is outstanding might be useful to develop a guidelines of best practices to be applied in the other municipalities which present large room for improvement. Managers can also see if there are other operating factors that could influence performance such as population density. The proposed methodology allows integrating other exogenous variables that might be interesting to policy makers. For instance, a tourism index could be included in the assessment to evaluate whether tourism impacts on the efficiency of municipalities in the provision of MSW services and therefore, to analyze the implementation of an eco-tax for tourists.
Our study focuses on evaluating the economic efficiency of municipalities in the provision of MSW services and on estimating the shadow price of residual waste. However, the different management systems for MSW collection and treatment involve different environmental impacts which were not integrated in our assessment. Hence, in future research, it will be very interesting to use life cycle assessment tools for evaluating the environmental impact of several waste management operations to provide a more holistic assessment of MSW service. Moreover, our study only integrates population density as environmental variable affecting the efficiency of municipalities. However, according to the literature there might be other environmental variables that might influence the performance of municipalities in the provision of MSW services. Hence, future research could include these environmental variables (e.g. tourism intensity, population and the size of the municipality.). Finally, two desirable outputs were considered in this study to evaluate the performance of municipalities, i.e., glass recycled and other recycled waste. Hence, in future research, it will be useful to disaggregate the output “other recycled waste” in several outputs such as paper recycled, plastic recycled and organic waste recycled to obtain more detailed results.
Data availability
The data that support the findings of this study are available from the corresponding author, [MMS], upon reasonable request.
Disclosure statement
No potential conflict of interest was reported by the author(s).
Additional information
Funding
Notes on contributors
Maria Molinos-Senante
Maria Molinos-Senante is Ph.D. on Local Development and Territory. She is associate professor at Pontificia Universidad Catolica de Chile.
Alexandros Maziotis
Alexandros Maziotis is Ph.D. on Economics and he is postdoc at Pontificia Universidad Catolica de Chile.
Ramón Sala-Garrido
Ramón Sala-Garrido is Ph.D. on Economics and he is full professor at University of Valencia.
Manuel Mocholi-Arce
Manuel Mocholi-Arce is Ph.D. on Economics and is professor at University of Valencia.
Notes
1 On 2nd July, 1 US$ 738 CLP and 1 €
874 CLP.
2 The elasticity of total costs was recovered from the homogeneity property, 1–0.932 = 0.068.
3 Decree 12 of the Chilean Environment Ministry establishes that in 2032, 65% of the glass, 45% of the plastic, 70% of the paper, 55% of the metal and 60% of the cardboard should be valorized.
References
- Agovino, M., D. Matricano, and A. Garofalo. 2020. Waste management and competitiveness of firms in Europe: A stochastic frontier approach. Waste Manage. 102:528–40. doi:10.1016/j.wasman.2019.11.021.
- Araya-Córdova, P. J., S. Dávila, N. Valenzuela-Levi, and Ó. C. Vásquez. 2021. Income inequality and efficient resources allocation policy for the adoption of a recycling program by municipalities in developing countries: The case of Chile. J. Clean. Prod. 309:127305. doi:10.1016/j.jclepro.2021.127305.
- Benito, B., M. Del Rocio Moreno, and J. Solana. 2011. Determinants of efficiency in the provision of municipal street-cleaning and refuse collection services. Waste Manage. 31:1099–108. doi:10.1016/j.wasman.2011.01.019.
- Bosch, N., F. Pedraja, and J. Suárez-Pandiello. 2000. Measuring the efficiency of Spanish municipal refuse collection services. Local Gov. Stud. 26 (3):71–90. doi:10.1080/03003930008434000.
- Brea-Solis, H., S. Perelman, and D. S. Saal. 2017. Regulatory incentives to water losses reduction: The case of England and Wales. J. Product. Anal. 47 (3):259–76. doi:10.1007/s11123-017-0496-4.
- Callan, S. J., and J. M. Thomas. 2001. Economies of scale and scope: A cost analysis of municipal solid waste services. Land Econ 77:548–60. doi:10.2307/3146940.
- Campos-Alba, C. M., E. J. De la Higuera-Molina, G. Pérez-López, and J. L. Zafra-Gómez. 2019. Measuring the efficiency of public and private delivery forms: An application to the waste collection service using order-M Data panel frontier analysis. Sustainability 11 (7):2056. doi:10.3390/su11072056.
- Carvalho, P., and R. C. Marques. 2014. Economies of size and density in recycling of municipal solid waste in Portugal. Waste Manage. 34:12–20. doi:10.1016/j.wasman.2013.10.004.
- Cetrulo, T. B., R. C. Marques, N. M. Cetrulo, A. D. Mendizábal-Cortés, and T. F. Malheiros. 2018. Effectiveness of solid waste policies in developing countries: A case study in Brazil. J. Clean. Prod. 205:179–87. doi:10.1016/j.jclepro.2018.09.094.
- Coelli, T. J., A. Estache, S. Perelman, and L. Trujillo. 2003. A primer on efficiency measurement for utilities and transport regulators. Washington: WBI Development Studies, World Bank.
- Coelli, T. J., D. S. Prasada Rao, C. J. O’Donnell, and G. E. Battese. 2005. An introduction to efficiency and productivity analysis. 2nd ed. New York: Springer.
- Coelli, T., A. Gautier, S. Perelman, and R. Saplacan-Pop. 2013. Estimating the cost of improving quality in electric distribution: A parametric distance function approach. Energy Policy 53:287–97. doi:10.1016/j.enpol.2012.10.060.
- Da Cruz, N. F., S. Ferreira, M. Cabral, P. Simões, and R. C. Marques. 2014. Packaging waste recycling in Europe: Is the industry paying for it? Waste Manage. 34 (2):298–308. doi:10.1016/j.wasman.2013.10.035.
- De Jaeger, S., J. Eyckmans, N. Rogge, and T. Van Puyenbroeck. 2011. Wasteful wastereducing policies? The impact of waste reduction policy instruments on collection and processing costs of municipal solid waste. Waste Manage. 31:1429–40. doi:10.1016/j.wasman.2011.02.021.
- Díaz-Villavicencio, G., S. R. Didonet, and A. Dodd. 2017. Influencing factors of eco-efficient urban waste management: Evidence from Spanish municipalities. J. Clean. Prod. 164:1486–96. doi:10.1016/j.jclepro.2017.07.064.
- European Environment Agency. 2021. Recycling rates in Europe by waste stream. https://www.eea.europa.eu/data-and-maps/daviz/recycling-rates-by-waste-streams-3#tab-chart_1
- Exposito, A., and F. Velasco. 2018. Municipal solid-waste recycling market and the European 2020 Horizon Strategy: A regional efficiency analysis in Spain. J. Clean. Prod. 172:938–48. doi:10.1016/j.jclepro.2017.10.221.
- Fan, X., B. Yu, Z. Chu, X. Chu, W.-C. Huang, and L. Zhang. 2020. A stochastic frontier analysis of the efficiency of municipal solid waste collection services in China. Sci. Total Environ. 743:140707. doi:10.1016/j.scitotenv.2020.140707.
- Foggia, G. D., and M. Beccarello. 2018. Improving efficiency in the MSW collection and disposal service combining price cap and yardstick regulation: The Italian case. Waste Manage. 79:223–31. doi:10.1016/j.wasman.2018.07.040.
- Foggia, G. D., and M. Beccarello. 2020. Drivers of municipal solid waste management cost based on cost models inherent to sorted and residual waste. Waste Manage. 114:12 202–214. doi:10.1016/j.wasman.2020.07.012.
- García-Sánchez, I. M. 2008. The performance of Spanish solid waste collection. Waste Manag. Res. 26 (4):327–36. doi:10.1177/0734242X07081486.
- Gellynk, X., and P. Verhelst. 2007. Assessing instruments for mixed household solid waste collection services in the Flemish region of Belgium. Resour. Conserv. Recycl. 49:372–87. doi:10.1016/j.resconrec.2006.05.003.
- Grosskopf, S., K. Hayes, and J. Hirschberg. 1995. Fiscal stress and the production of public safety: A distance function approach. J. Public Econ. 57 (2):277–96. doi:10.1016/0047-2727(94)01445-T.
- Guerrini, A., P. Carvalho, G. Romano, R. C. Marques, and C. Leardini. 2017. Assessing efficiency drivers in municipal solid waste collection services through a nonparametric method. J. Clean. Prod. 147:431–41. doi:10.1016/j.jclepro.2017.01.079.
- Halkos, G., and K. N. Petrou. 2019. Assessing 28 EU member states’ environmental efficiency in national waste generation with DEA. J. Clean. Prod. 208:509–21. doi:10.1016/j.jclepro.2018.10.145.
- Haraguchi, M., A. Siddiqi, and V. Narayanamurti. 2019. Stochastic cost-benefit analysis of urban waste-to-energy systems. J. Clean. Prod. 224:751–65. doi:10.1016/j.jclepro.2019.03.099.
- Hernandez-Sancho, F., M. Molinos-Senante, and R. Sala-Garrido. 2010. Economic valuation of environmental benefits from wastewater treatment processes: An empirical approach for Spain. Sci. Total Environ. 408:953–57. doi:10.1016/j.scitotenv.2009.10.028.
- Jacobsen, R., J. Buysse, and X. Gellynck. 2013. Cost comparison between private and public collection of residual household waste: Multiple case studies in the Flemish region of Belgium. Waste Manage. 33:3–11. doi:10.1016/j.wasman.2012.08.015.
- Johnstone, N., and J. Labonne. 2004. Generation of Household Solid Waste in OECD Countries: An Empirical Analysis Using Macroeconomic Data. Land Econ 80:529–528. doi:10.2307/3655808.
- Kaza, S., L. Yao, and P. F. Bhada-Tatavan. 2018. What a Waste 2.0: A Global Snapshot of Solid Waste Management to 2050. Urban Development. Washington, DC: World Bank. https://openknowledge.worldbank.org/handle/10986/30317
- Kumbhakar, S. C., H. J. Wang, and A. Horncastle. 2015. A practitioner’s guide to stochastic frontier analysis. Cambridge, England: Cambridge University Press.
- Llanquileo-Melgarejo, P., and M. Molinos-Senante. 2021. Evaluation of economies of scale in eco-efficiency of municipal waste management: An empirical approach for Chile. Environ. Sci. Pollut. Res. 28:28337–48. doi:10.1007/s11356-021-12529-1.
- Llanquileo-Melgarejo, P., M. Molinos-Senante, G. Romano, and L. Carosi. 2021. Evaluation of the impact of separative collection and recycling of municipal solid waste on performance: an empirical application for Chile. Sustainability 13:2022. doi:10.3390/su13042022.
- Marques, R. C., and P. Simoes. 2009. Incentive regulation and performance measurement of the Portuguese solid waste management services. Waste Manag. Res. 27 (2):188–96. doi:10.1177/0734242X08095025.
- Marques, R. C., N. F. Da Cruz, and P. Carvalho. 2012. Assessing and exploring (in)efficiency in Portuguese recycling systems using non-parametric methods. Resour. Conserv. Recycl. 67:34–43. doi:10.1016/j.resconrec.2012.07.005.
- Marques, R. C., and N. F. Da Cruz. 2015. Recycling and extended producer responsibility: the European experience. London: Routledge.
- Marques, R. C., P. Simões, and F. S. Pinto. 2018. Tariff regulation in the waste sector: An unavoidable future. Waste Manage. 78:292–300. doi:10.1016/j.wasman.2018.05.028.
- Maziotis, A., A. Villegas, and M. Molinos-Senante. 2020. The cost of reducing unplanned water supply interruptions: A parametric shadow price approach. Sci. Total Environ. 719:137487. doi:10.1016/j.scitotenv.2020.137487.
- Medina-Mijangos, R., A. De Andrés, H. Guerrero-Garcia-Rojas, and L. Seguí-Amórtegui. 2021. A methodology for the technical-economic analysis of municipal solid waste systems based on social cost-benefit analysis with a valuation of externalities. Environ. Sci. Pollut. Res. 28 (15):18807–25. doi:10.1007/s11356-020-09606-2.
- Molinos-Senante, M., S. Porcher, and A. Maziotis. 2017. Impact of regulation on english and welsh water-only companies: An input distance function approach. Environ. Sci. Pollut. Res. 24 (20):16994–7005. doi:10.1007/s11356-017-9345-2.
- Molinos-Senante, M., A. Villegas, and A. Maziotis. 2019. Are water tariffs sufficient incentives to reduce water leakages? An empirical approach for Chile. Util. Policy 61 (100971):100971. doi:10.1016/j.jup.2019.100971.
- Molinos-Senante, M., and A. Maziotis. 2021. The cost of reducing municipal residual solid waste: evidence from municipalities in Chile. Sustainability 13 (12):6607. doi:10.3390/su13126607.
- Morrison Paul, C. J., and R. Nehring. 2005. Product diversification, production systems, and economic performance in U.S. agricultural production. J. Econom. 126 (2):525–48. doi:10.1016/j.jeconom.2004.05.012.
- Rana, R., R. Ganguly, and A. K. Gupta. 2017. Evaluation of solid waste management in satellite towns of Mohali and Panchkula-India. J. Solid Waste Technol. Manag. 43 (4):280–94. doi:10.5276/JSWTM.2017.280.
- Ríos, A.-M., and A. J. Picazo-Tadeo. 2021. Measuring environmental performance in the treatment of municipal solid waste: The case of the European Union-28. Ecol. Indic. 123:107328. doi:10.1016/j.ecolind.2020.107328.
- Rogge, N., and S. De Jaeger. 2013. Measuring and explaining the cost efficiency of municipal solid waste collection and processing services. Omega 41:653–64. doi:10.1016/j.omega.2012.09.006.
- Romano, G., A. Rapposelli, and L. Marrucci. 2019. Improving waste production and recycling through zero-waste strategy and privatization: An empirical investigation. Resour. Conserv. Recycl. 146:256–63. doi:10.1016/j.resconrec.2019.03.030.
- Romano, G., and M. Molinos-Senante. 2020. Factors affecting eco-efficiency of municipal waste services in Tuscan municipalities: An empirical investigation of different management models. Waste Manage. 105:384–94. doi:10.1016/j.wasman.2020.02.028.
- Romano, G., D. C. Ferreira, R. Marques, and L. Carosi. 2020. Waste services’ performance assessment: The case of Tuscany, Italy. Waste Manage. 118:573–84. doi:10.1016/j.wasman.2020.08.057.
- Saal, D. S., D. Parker, and T. Weyman-Jones. 2007. Determining the contribution of technical change, efficiency change and scale change to productivity growth in the privatized English and Welsh water and sewerage industry: 1985–2000. J. Product. Anal. 28 (1–2):127–39. doi:10.1007/s11123-007-0040-z.
- Sarra, A., M. Mazzocchitti, and A. Rapposelli. 2017. Evaluating joint environmental and cost performance in municipal waste management systems through data envelopment analysis: Scale effects and policy implications. Ecol. Indic. 73:756–71. doi:10.1016/j.ecolind.2016.10.035.
- Sarra, A., M. Mazzocchitti, E. Nissi, and D. Quaglione. 2019. Considering spatial effects in the evaluation of joint environmental and cost performance of municipal waste management systems. Ecol. Indic. 106:105483. doi:10.1016/j.ecolind.2019.105483.
- Sharma, A., R. Ganguly, and A. K. Gupta. 2018. Matrix method for evaluation of existing solid waste management system in Himachal Pradesh, India. J. Mater. Cycles Waste Manag. 20 (3):1813–31. doi:10.1007/s10163-018-0703-z.
- Simoes, P., K. De Witte, and R. C. Marques. 2010. Regulatory structures and operational environment in the Portuguese waste sector. Waste Manage. 30:1130–37. doi:10.1016/j.wasman.2009.12.015.
- Simoes, P., and R. C. Marques. 2011. How does the operational environment affect utility performance? A parametric study on the waste sector. Resour. Conserv. Recycl. 55:695–702. doi:10.1016/j.resconrec.2011.02.001.
- Simoes, P., and R. C. Marques. 2012. On the economic performance of the waste sector: A literature review. J. Environ. Manage. 106:40–47. doi:10.1016/j.jenvman.2012.04.005.
- Simoes, P., N. F. Cruz, and R. C. Marques. 2012. The performance of private partners in the waste sector. J. Clean. Prod. 29-30:214–21. doi:10.1016/j.jclepro.2012.01.027.
- SINADER. 2018. Sistema Nacional de Declaración de Residuos. https://portalvu.mma.gob.cl/sinader/
- SINIA. 2021. Informe del Estado del Medio Ambiente. Capítulo 10: Residuos. https://sinia.mma.gob.cl/wp-content/uploads/2021/04/10-residuos.pdf
- Swart, J., and L. Groot. 2015. Waste management alternatives: (Dis)economies of scale in recovery and decoupling. Resour. Conserv. Recycl. 94:43–55. doi:10.1016/j.resconrec.2014.11.005.
- United Nations. 2015. Sustainable Development Goals. https://wedocs.unep.org/20.500.11822/9672
- United Nations Environment Programme. 2015. Global Waste Management Outlook 2015.
- Valenzuela-Levi, N. 2019. Factors influencing municipal recycling in the Global South: The case of Chile. Resour. Conserv. Recycl. 150:104441. doi:10.1016/j.resconrec.2019.104441.
- Valenzuela-Levi, N. 2021. Poor performance in municipal recycling: The case of Chile. Waste Manage. 133:49–58. doi:10.1016/j.wasman.2021.07.021.
- Worthington, A. C., and B. E. Dollery. 2001. Measuring efficiency in local government: An analysis of New South Wales Municipalities domestic waste management function. Policy Stud. J. 29:4–24. doi:10.1111/j.1541-0072.2001.tb02088.x.