
 ?Mathematical formulae have been encoded as MathML and are displayed in this HTML version using MathJax in order to improve their display. Uncheck the box to turn MathJax off. This feature requires Javascript. Click on a formula to zoom.
ABSTRACT
A variety of factors can affect a person’s perception of their environment and health, but one factor that is often overlooked in indoor settings is the air quality. To address this gap, we develop and evaluate four Machine Learning (ML) models on two disparate datasets using Indoor Air Quality (IAQ) parameters as primary features and components of self-reported IAQ satisfaction and sleep quality as target variables. In each case, we compare models to each other as well as to a simple model that always predicts the majority outcome. In the first analysis, we use open-source data collected from 93 California residences to predict occupant’s satisfaction with their indoor environment. Results indicate building ventilation rate, Relative Humidity (RH), and formaldehyde are most influential when predicting IAQ perception and do so with an accuracy greater than the simplified model. The second analysis uses IAQ data gathered from a field study we conducted with 20 participants over 11 weeks to train similar models. We obtain accuracy and F1 scores similar to the simplified model where PM2.5 and TVOCs represent the most important predictors. Our results underscore the ability of IAQ to affect a person’s perception of their built environment and health and highlight the utility of ML models to explore the strength of these relationships.
Implications: The results from this study show that two outcome variables – occupant’s indoor air quality (IAQ) satisfaction and perceived sleep quality – are related to the measured IAQ parameters but not heavily influenced by typical values measured in apartments and homes. This study highlights the ability of machine learning models as exploratory analysis tools to determine underlying relationships within and across datasets in addition to understanding the importance of certain features on the outcome variable. We compare four different models and find that the random forest classifier has the best performance in both analysis on IAQ satisfaction and perceived sleep quality. It is a suitable model for predicting IAQ-related subjective metrics and also provides value insight into the feature importance of the IAQ parameters. The accuracy of any of these machine learning models in predicting occupants’ comfort or sleep quality is limited by the dataset size, how data is collected, and range of data. This study identifies the factors that are important to IAQ perception: ventilation rate, relative humidity, and concentrations of formaldehyde, NO2, and particulate matter. It indicates that sensors that can measure these variables are necessary for future, related studies that model occupants’ IAQ satisfaction. However, this study does not find strong relationships between any of the IAQ parameters measured in this study and perceived sleep quality despite the logical pathway between these many pollutants and respiratory issues. A prediction model of IAQ perception or sleep quality can be integrated into home management systems to automatically adjust building operations such as ventilation rates in smart buildings. Once buildings are equipped with a network of low-cost sensors that measure concentrations of pollutants and operating conditions of the ventilation system, the prediction model can be used to predict the occupants’ comfort and facilitate the control of the ventilation system.
Introduction
Healthy indoor environments are crucial to human life considering people spend 87% of their time indoors, 69% of which is spent in residences (Klepeis et al. Citation2001). Although buildings can protect occupants from ambient air pollution, they can also expose occupants to high levels of compounds emitted from indoor sources such as Particulate Matter (PM) and Nitrogen Oxides (NOx) from cooking, Formaldehyde (HCHO) and Volatile Organic Compounds (VOCs) from painting and furniture, and spores from mold. Even when the concentration of air pollutants indoors is not high, the intake can still be large given the length of the exposure period (Weschler Citation2006). Adverse health effects (e.g., respiratory symptoms, impaired lung function, and premature mortality (Kim, Kabir, and Kabir Citation2015)) of air pollutants have been reported in previous studies, and Sick Building Syndrome (SBS) – building-related illnesses without a clear causal factor, common symptoms of which include eye irritation, headaches, shortness of breath, rash, etc. – - has also been recognized (Redlich, Sparer, and Cullen Citation1997). Generally poor IAQ can exacerbate or induce ailments related to the respiratory (Lévesque et al. Citation2018) and cardiovascular (Chuang et al. Citation2017) systems in addition to negatively affecting occupants’ moods (Fiedler et al. Citation2008). Therefore, in order to achieve good health, decent life quality, and high work efficiency for building occupants, maintaining a satisfactory quality of air in indoor environments is necessary.
As an analogy to thermal comfort, perception of IAQ is a subjective measure of the quality of indoor air. Compared with the concentrations of individual compounds in air, IAQ perception has the advantages of being one single indicator of overall IAQ and takes into account the discomfort of the occupant. IAQ perception has the potential to become a convenient metric to evaluate and compare buildings if accurately estimated. Moreover, a prediction model of IAQ perception can be integrated into home management systems to automatically adjust building operations such as ventilation rates in smart buildings. However, predicting IAQ perception is a complicated research problem as myriad factors are associated with it, and their relationships are likely nonlinear. No evident correlation was found between subjective IAQ satisfaction and objective measurements of ventilation and air pollutants in office buildings (Sekhar, Tham, and Cheong Citation2003). However, residents reported fewer SBS symptoms in green homes which also had lower concentrations of 2.5 µm (PM2.5), Nitrogen Dioxide (NO2), and nicotine in addition to a slightly lower ventilation rate than conventional homes (Colton et al. Citation2014). Similarly, building characteristics, such as air exchange rate, dwelling type, year of construction, and dwelling location, were found to affect concentrations of NO2, HCHO and Total Volatile Organic Compounds (TVOCs) in residential buildings (Langer and Bekö Citation2013). Thus, a predictive model capable of dealing with correlated input variables and nonlinear relationships across IAQ measurements and building characteristics could provide promising insight into occupants’ perceptions of IAQ. Recently, ML models like artificial neural networks have been shown to successfully predict IAQ-related parameters including concentrations of air pollutants and SBS symptoms (Wei et al. Citation2019) which provides promise for the prediction of IAQ satisfaction.
Similarly complicated to IAQ perception and equally likely to be affected by poor IAQ is an occupant’s self-reported sleep quality. Commonly-occurring pollutants associated with the indoor and outdoor environment can inflame airways (Billings et al. Citation2019) which might affect respiration while sleeping or worsen preexisting sleep conditions like obstructive sleep apnea. A handful of recent studies have begun to probe the relationship between IAQ and self-reported sleep quality (Akimoto et al. Citation2021) and have found that participants tend to have fewer awakenings, a more restful sleep, and less short-wave sleep (Xiong et al. Citation2020; Xu et al. Citation2021) under less polluted conditions. Even fewer studies have attempted to use ML methods to predict an individual’s sleep quality. In (Hidayat, Tambunan, and Budiawan Citation2018), researchers train a K-nearest neighbor (KNN) classifier to predict changes in five sleep quality indicators based on the previous day’s physical activity level. Using activity and sleep data from a wrist-worn activity device, they were able to predict changes in Total Sleep Time (TST) and Sleep Efficiency (SE) with 68% and 64% accuracy, respectively. Using more robust neural network based methods, researchers in (Sathyanarayana et al. Citation2016) were able to predict poor or adequate SE with an accuracy as high as 95%. In a slightly different approach, one study used home-based activities (cooking, watching television, etc.) detected from smart home sensors to predict changes in wake and sleep times (Williams and Cook Citation2017), but did not monitor sleep quality directly. To the best of the authors’ knowledge, there exist no studies that directly predict sleep quality from IAQ-related parameters including temperature and relative humidity.
In this study, we use four ML classification models – Logistic Regression (LR), Gaussian Naïve- Bayes (NB), Decision Tree (DT), and Random Forest (RF) – in an attempt to understand and classify the effect of IAQ on participants’ perceptions of their indoor environment and sleep quality. In this first analysis, we use open-source data collected from 93 Californian residences to predict occupant’s satisfaction with their indoor environment. Following this analysis, we train the same models on IAQ data gathered from a field study we conducted over 11 weeks from 20 participants using four self-reported sleep metrics as targets. In both cases, we report the accuracy and F1 scores in addition to comparing the results to a simplified “dummy” classifier that always predicts the binary class that was observed in the majority.
Methodology
In the following subsections, we highlight the procedures we implemented to understand the relationships between IAQ parameters and participants’ perceptions. In sections 2.1 and 2.2 we introduce the datasets we use to address each analysis and the pre-processing steps we implemented. In Section 2.3 we detail the four classifiers we consider, how we implement the prediction process, and the metrics we use to evaluate their performance. All the pre-processing, modeling, and prediction were implemented using Python3 and the scikit-learn v1.0.1 library.
IAQ perception
Dataset
To assess the effect of IAQ on a person’s perception of their indoor environment, we used data from two field studies on IAQ measured in 70 detached houses (Singer et al. Citation2020) and 23 low-income apartments (Zhao et al. Citation2021) in California. The objective of both studies was to investigate whether IAQ was acceptable in homes equipped with natural gas cooking appliances and mechanical ventilation systems as required by California’s Building Energy Efficiency Standards. Of the houses in (Singer et al. Citation2020), 64 of 70 had exhaust fans and the remaining had supply systems. All apartments in (Zhao et al. Citation2021) used exhaust fans to ventilate the space. Both studies conducted one-week measurements of all IAQ parameters in the master bedroom and at a central indoor site, usually the kitchen and/or living room. Additional air quality measurements were made just outside the home. The IAQ parameters include temperature, relative humidity, and concentrations of PM2.5, Carbon Dioxide (CO2), NO2, NOx, and HCHO. The two studies investigated different types of residential buildings. The first study, conducted from July 2016 to April 2018, examined detached houses built in 2011–2017 with 1 to 2.5 stories and a mean floor area of 244 m2 (Singer et al. Citation2020). The second study, more recently conducted during 2019, investigated apartments built or renovated between 2013 and 2016 with 1 to 2 stories and a mean floor area of 76 m2 (Zhao et al. Citation2021). These two studies were selected because they provide complete and detailed information necessary for predicting IAQ, including building characteristics (e.g., floor area, mechanical ventilation, filter condition), concentrations of air pollutants (e.g., CO2, PM and HCHO), as well as survey responses on occupants’ satisfaction with the air quality in their homes.
Pre-Processing
shows the 23 features which were initially input to the ML models. For the categorical variables, i.e., Oven_Fuel, WHV_AsFound, AF_Condition, and RHD_Grease_Screen, we encoded them according to the values given in . For the IAQ parameters measured by time-resolved active sampling, i.e., T, RH, PM, PM_Out, CO2, and CO2_BR, we averaged their values from each home over the one-week sampling period. Values of T, RH, PM, and CO2 are from measurements at the central indoor site, PM_Out from outdoor measurements, and CO2_BR from measurements in the master bedroom. For the IAQ parameters measured by time-integrated passive sampling, i.e., NO2, NOx, and FRM, we averaged the values measured at the central indoor site and the master bedroom in each home. Any missing feature values were imputed with the median of the corresponding column. As a final step, we scaled all variables to zero mean and unit variance.
Table 1. Definitions and encoding of input features of the machine learning models.
We encoded the satisfaction level with IAQ as a binary target variable since the dataset was too small to observe significant responses in each category and because the satisfaction scales from the two studies that we consider did not match. The encoding process varied depending on the study we were considering. Singer et al. provided a 9-point Likert scale addressing the question “To what extent are you satisfied or dissatisfied with the indoor air quality in your home?” where responses of 1 indicated “very dissatisfied” and 9 indicated “very satisfied” (Singer et al. Citation2020). Zhao et al. provided four responses to the question “When thinking about your home, how do you feel about the air quality inside home?”: “I am unhappy with it”, “I feel it could be improved”, “I feel it’s fine”, and “I am happy with it” (Zhao et al. Citation2021). We established a correlation between the responses to the two studies and indicate how we encoded the responses in . The distinction between strong satisfaction and relatively lower satisfaction led to a balanced data, with 43 and 46 outcomes, respectively. Four entries were removed due to the missing response to the IAQ satisfaction question, leaving 89 data points for the prediction analysis.
Table 2. IAQ satisfaction response encoding.
With the 89 data points, we conducted feature analysis to understand which of the 23 features were most important when predicting perception of IAQ. The most important features were identified based on the feature importance attribute of the DT and RF models. However, we ensured that all IAQ parameters that were measured in the subsequent analysis on self-reported sleep quality (Section 2.2.1) were included as features regardless of their measured importance so that we could compare the impact of IAQ parameters on different aspects of occupant perception. To check whether there existed an intrinsic connection between the features and a given target, the performance of the classifiers when trained on the randomly shuffled target was compared to their performance on the original values of the target variables. The random guessing was conducted in 5 folds, and the average performance of the classifiers was recorded.
Self-Reported sleep quality
Data collection
To obtain data for predicting sleep quality, we recruited student participants from the University of Texas at Austin (UT) through virtual enrollment interviews as part of a larger cohort study (Fritz and Nagy Citation2020; Wu et al. Citation2021). Participants were between the ages of 19 to 27 and had no known sleep disorders. Each participant downloaded the Beiwe smartphone application which provides GPS data and periodically sends Ecological Momentary Assessments (EMAs) directly to participants for them to complete. EMAs were sent to participants at 9:00 am on Monday, Wednesday, Friday, and Sunday and asked participants to rate four aspects of their sleep quality: Total Sleep Time (TST), Sleep Onset Latency (SOL), Number of Awakenings (NAW), and their restfulness rated on a 0–3 scale (). We use these self-reported sleep metrics as target variables when training our ML models.
Figure 1. Questions and possible responses regarding participant sleep quality included on morning EMAs sent four times during the week.
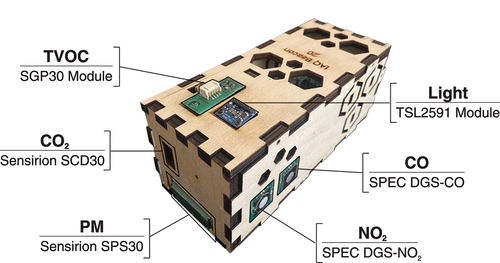
We asked participants to place an environmental monitor of our creation in their bedrooms to monitor the IAQ conditions. The Building Occupancy and EnVironment Beacon (BEVO Beacon), pictured in , uses affordable, consumer-grade sensors to measure multiple components of IAQ including PM2.5, CO2, TVOCs, and Carbon Monoxide (CO), Temperature (T), and RH. Each of the sensors on the BEVO Beacon was calibrated in an experimental home environment (UTest House at UT’s Pickle Research Center), an environmental test chamber, or both, individually on each device. A summary of the calibration processes can be found in the appendix with more detailed information provided in (Fritz et al. Citation2022) and (Fritz et al. Citation2022). Participants were also given Fitbit Inspire HRTM devices which use a heart rate monitor in conjunction with an accelerometer to monitor activity and sleep.
Figure 2. The BEVO Beacon and sensors included on the device.
Pre-Processing
We are only interested in IAQ data collected while the participant was in their bedroom and asleep. To determine if participants were home, we cross-referenced the GPS data from Beiwe to the addresses participants had provided when enrolling. To identify when participants were asleep, we used sleep events detected by their Fitbit devices. Our final dataset consists of 258 observations corresponding to nights when BEVO Beacons measured IAQ conditions, participants were home and asleep, and the same participant completed the morning EMA after waking. A minimum of 4 and maximum of 37 nights were collected across 16 individuals.
We use a total of six binary features based on measurements of CO2, TVOCs, CO, PM2.5, T, and RH. Data from each of the IAQ sensors on the BEVO Beacon were determined to be low or high for each participant by comparing the median concentration of each IAQ parameter per night to the overall mean IAQ measurements experienced during their Fitbit-detected sleep events. We encoded sleep metric targets as binary values based on whether or not they were in the suggested range listed in . We chose to binarize the IAQ and sleep quality measurements because we were only interested in determining if a relationship existed between IAQ parameters and sleep, but not the extent of the association.
Table 3. Recommendations used to encode the sleep metrics self-reported on EMAs.
Model training and evaluation
The classifiers we consider in this study are Logistic Regression (LR), Gaussian Naïve-Bayes (NB), Decision Tree (DT), and Random Forest (RF). The binary LR model makes use of the Sigmoid function given by:
where and
refer to the coefficient and value for a certain feature
and
is the probability that the set of input features belongs to one of two classes (Menard Citation2002). LR acts as a simplified model that we can compare the other, more complex models to.
NB is a probability-based classifier that use Bayes’ theorem along with the assumption that features are conditionally independent given the class (Sammut and Webb Citation2011). Starting with Bayes’ theorem and applying conditional independence, we get:
where is the target class.
A DT classifier is composed of discrete decision rules that are applied recursively to partition features of a dataset into class subspaces (Myles et al. Citation2004). The DT model is composed of two types of nodes. Branch nodes represent rule-based junctions that categorizes a set of input features into one of two subspaces typically through the use of inequality expressions. A leaf node is any terminal node that fully classifies the set of input features. The RF classifier builds upon the DT model by incorporating the output of multiple, shallow DT models through the use of algorithms like boosting and bagging. RF is a powerful ensemble method that has exhibited success across many domains and problems since its inception (Breiman Citation2001). Unlike the LR and NB models which have only a few hyperparameters that are simple to tune, the DT and RF models are more complex. For these two models, we used a grid search approach to optimize key hyperparameters across both datasets – most notably the depth, criterion to determine the quality of splits, and the number of trees to include in the RF model. We limited the depth of the tree to help prevent over-fitting, which is especially important for small datasets. The hyperparameters used for each model are summarized in the Appendix. For each iteration through the set of model hyperparameters, we conducted a 5-fold Cross-Validation (CV) and compared the averaged accuracy scores for each model configuration to determine the appropriate hyperparameters.
We chose to include four models because each has its own unique advantages and disadvantages. The LR model provides a baseline to compare against and is simple, easy-to-interpret, and quick to train. The model coefficients also indicate the strength and direction of feature-target associations. However, LR assumes linearity between the features and targets and will lead to biased results when samples are not independent. NB works well for smaller datasets, can be trained quickly, and provides highly accurate results where the assumption of conditional independence holds. However, this model is prone to errors when observations are not independent. The DT and RF models help circumvent the problem of independence required by the LR and NB models since they are non-parametric and do not require independence between observations. The DT model can determine non-linear relationships, requires less data pre-processing, provides measures of feature importance, and can be easily explained relative to other methods. However, the DT model takes longer to train than LR and NB, but, most notably, is prone to over-fitting if not properly constructed. The RF model helps overcome issues with over-fitting by combining results from multiple DT models trained on sub-samples of the data. While this process typically provides more accurate results, RF models lose the advantages of explainability and quicker training times consist with DT models.
After determining the features to include from the perception of IAQ dataset and optimizing the DT and RF models for both datasets, we predicted participants’ perception of IAQ and sleep quality. In both analyses, we used a 80/20 train/test split while guaranteeing the train and test sets preserve the ratio of the target class. We calculated the accuracy of the model to predict from both the training and test datasets. Accuracy is defined as the number of predictions the models correctly identified, or in the context of a binary classification problem:
where = True Positives,
= True Negatives,
= False Positives, and
= False Negatives. We also calculate a F1 score by adjusting the decision threshold that optimizes the precision and recall scores. Precision and recall are given by:
The F1 score is the simply the harmonic mean of the precision and recall scores, given by:
We compare the performance of the four classifiers to each other in addition to considering the accuracy and F1 scores from a “dummy” model that always predicts the majority class. For the dummy model, we do not have to adjust decision threshold for the F1 score because the model will always predict the majority outcome regardless of the decision threshold.
Results
Perception of IAQ satisfaction
Feature selection
Based on the feature importances from the DT and RF models, we selected a list of nine relevant features: RHD_Low, CO2_BR, FRM, RH, Q50, EXF_BA, PM, NO2, and T. Three of the nine features indicate the strength of mechanical (RHD_Low and EXF_BA) or natural ventilation (Q50) system, while the remaining six represent components of IAQ. shows the accuracy of training and testing of the four classifiers on the original vs. randomly shuffled targets and all vs. selected features. All the four models have similar or better performance on the test dataset when being trained on the nine features compared to when being trained on all available features, which suggests that the nine selected features sufficed the establishment of the predictor model. In addition, the higher accuracy of training and testing when using the original targets than using the randomly shuffled targets indicate that there exists a connection between the features and target and that such connection can be captured by ML models.
Table 4. Results from 5-fold cross validation and test scores of classifiers trained on varying combinations of features and targets.
shows the cumulative distribution plots of feature values used in the training and testing sets to predict IAQ perception. The CO2 concentrations that we consider are consistent amongst both studies in addition to well-ventilated bedroom spaces measured by other researchers (Mishra et al. Citation2018; Strøm-Tejsen et al. Citation2016). Interestingly, the CO2_BR concentrations, along with the PM_IN and FRM measurements, are similar between the low-income apartments and houses despite the stark differences in Q50 and EXF_BA. This result is likely due to the significant volume differences between apartments in the smaller study and houses in the other. PM concentrations are also similar between the two studies we consider and tend to be within typical ranges for the home environment (Ścibor et al. Citation2019). The temperature and RH measurements are within comfort ranges outlined in ASHRAE Standard 55 and similar between studies but with a greater percentage of RH measurements at elevated values in the apartment-based study. The NO2 concentrations are also tend to be higher in the apartment-based study relative to the house-based study, but measurements in both studies fall within typical ranges for houses (Gilbert et al. Citation2006; Raw et al. Citation2004). Lastly, HCHO concentrations used in our modeling process are slightly high relative to new houses in less-polluted regions (Järnström et al. Citation2006), but are typical for most homes (Raw et al. Citation2004).
Figure 3. Cumulative distribution plots for the feature values used to predict perception of IAQ. Each plot shares the same y-axis values. The first six features represent those related to IAQ while the remaining three, pictured at the bottom, are related to the mechanical or natural ventilation system.
The bottom three plots in highlight the building characteristics associated with different ventilation parameters. The majority of lowest kitchen range hood fan speeds (RHD_LOW) are similar between the two studies with a large proportion of measurements clustered around 100 cfm (170 m3/hr), but a greater range for houses. The value of 100 cfm is the minimum flow rate of the kitchen vented range hood as required by ASHRAE Standard 62.2 (ASHRAE Citation2019). Houses also exhibit both a greater range and value of measured natural ventilation (Q50), which is expected since houses are usually less air tight than apartments (Pan Citation2010). Steeper slopes of the cumulative distribution plot of bathroom exhaust (EXF_BA) for houses illustrate slight tendencies at values around 40 and 90 cfm. The majority of EXF_BA for apartments are clustered around 40 cfm. The exhaust airflow rate is required to be higher than 50 cfm for intermittent operation and 20 cfm for continuous operation by ASHRAE Standard 62.2.
Model optimization and performance
We used the nine selected features to train and evaluate the four ML classifiers. For the LR and NB models, we used the default values provided by the Python scikit-learn library that we used to define all our models. For the DT and RF models, we optimized the maximum depth of the tree to achieve a 5-fold CV score of 0.70 and 0.74, corresponding to depths of 5 and 8 for each model, respectively. Additionally, we optimized the number of trees in the RF model resulting in 20 estimators.
Performance of the four ML classifiers and the dummy model on the training and test datasets is shown in . All the four ML models outperform the accuracy of the dummy model. The NB model produces an accuracy only 5% better than the dummy model, while the two tree-based models produce the most accurate predictions – 66% and 69%, respectively. These results alongside the F1 score from the RF model indicates that tree-based models are the most appropriate for predicting IAQ perception at least based on the dataset we use. The other three models produce F1 scores as accurate as the dummy model meaning they are as useful as the dummy model while the F1 score from the rf model is significantly higher. The decision threshold indicates the probability at which the model will classify the inputs as belonging to the minor or major class. The decision thresholds in are all less than 0.5 despite our use of a balanced dataset perhaps indicating our method of binarizing participants’ satisfaction with IAQ could be optimized further.
Table 5. Performance metrics of ML models when predicting perception of IAQ.
Analysis
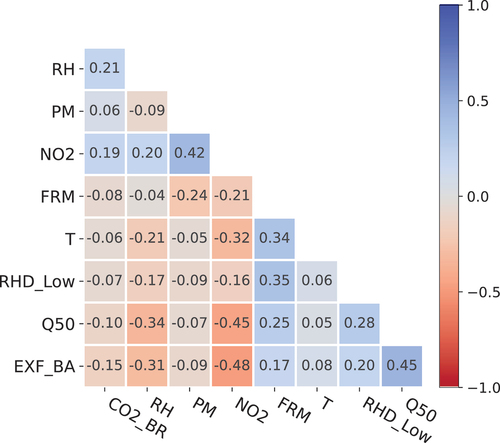
The correlation amongst the nine selected features was analyzed by plotting the heatmap in . The absolute values of all correlation coefficients of the nine features are less than 0.5, indicating no strong correlation among them. There exists a negative correlation between the four IAQ measurements – CO2_BR, RH, PM, and NO_2 – and the three ventilation measurements – RHD_Low, Q50, and EXF_BA. An increased ventilation rate can dilute the concentration of air pollutants and water vapor indoors if the source is in the residence. For instance, NO2 is emitted due to cooking on gas cooktops, and its concentration can be reduced by replacing the indoor air with outdoor air through ventilation assuming the ambient concentration of NO2 is lower.
Figure 4. Correlation matrix of the selected nine features used to predict IAQ satisfaction.
illustrates the importance of each feature from the DT and RF models. For both models, RH, Q50, and RHD_Low were amongst the most important predictors and have a weight larger than 0.1. T, CO2_BR, and EXF_BA are the least important predictors for both models. Interestingly, the DT model gives more weight to air pollutant measurements, particularly FRM, NO2, and PM while the RF model emphasizes ventilation – Q50 and EXF_BA. This difference is likely due to the differently sized trees used in the two models. In fact, if we reduce the size of the DT model to match that of the estimators used in the RF model, the feature importances from the DT model shift to match those from the RF model more closely. Despite the differences in important predictors, we get similar accuracies from both models.
Figure 5. Relative feature importance when predicting perception of IAQ from the Decision Tree (DT) and Random Forest (RF) models.
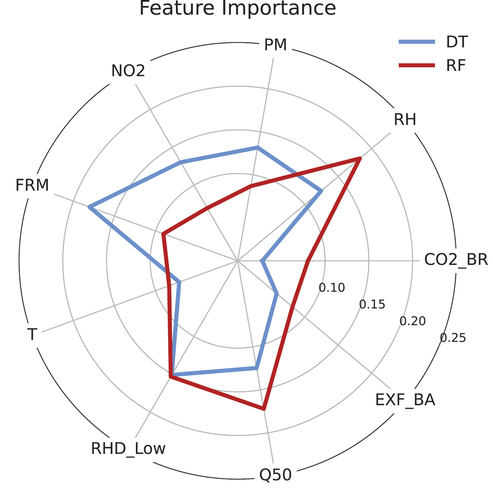
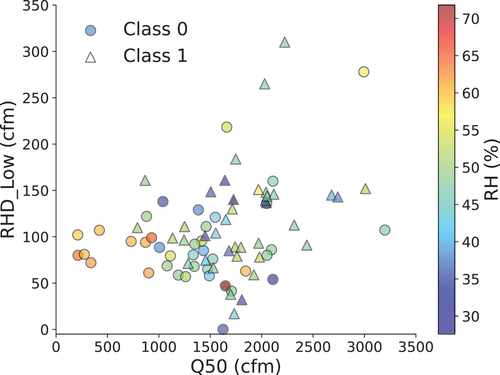
Given that RH, Q50, and RHD_low have the most importance in the RF model, we further analyzed the relationship between these three features and the IAQ perception. As can be seen in , homes with a higher Q50 and RHD_Low tend to have a high IAQ satisfaction while homes with a higher RH tend to have a lower IAQ satisfaction. The RF model successfully learned such a relationship between features and the target.
Figure 6. Relationship between RHD_Low, Q50, RH and class of IAQ satisfaction (Class 0 – lower IAQ satisfaction, Class 1 – high IAQ satisfaction).
A few studies have assessed the impact of IAQ parameters on occupants’ perceptions on IAQ with the greatest focus on thermal comfort’s impact. Generally, researchers have determined that as temperature and/or RH values increase, occupants’ perceptions of IAQ decrease (Fang, Clausen, and Fanger Citation1998; Geng et al. Citation2017; Lan et al. Citation2011). Our finding on the importance of RH to predict perception of IAQ () corroborates this relationship, but temperature does not seem to have as great of an effect. Similarly, many researchers emphasize the use of CO2 in models to understand occupants’ satisfaction with IAQ (Tang, Ding, and Singer Citation2020). However, our results indicate that CO2 is the least important predictor (), although the measurements we use consider are from the bedroom rather than from a centralized location like the living room.
Perception of sleep quality
Summary of feature measurements
For this dataset, we do not conduct feature engineering, but rather include all six IAQ variables as features. shows the cumulative distribution plots of median feature values measured in participants’ bedrooms that were used in the training and testing sets to predict self-reported sleep quality. The CO2 measurements are more consistent with poorly ventilated bedrooms spaces (Strøm-Tejsen et al. Citation2016) or those with closed window/doors (Mishra et al. Citation2018). Provided that these measurements were made during the summer in shared apartments, participants’ windows and doors are likely closed which would allow CO2 concentrations to buildup. The increased concentrations of CO could also be attributed to this phenomenon. Approximately 19% of the median CO concentrations are greater than the recommended 24-hour exposure limit (World Health Organization Citation2010) of approximately 6.1 ppm, attributed primarily to one participant. Only 3% of the remaining measurements are greater than the 8-hour exposure limit of approximately 8.7 ppm. These measurements are considerably higher than those found in a related study measuring CO in bedrooms of homes with and without gas stoves (Raw et al. Citation2004), but concentrations can reach values upwards of 90 ppb while cooking with gas (Ross and Wilde Citation1999) which might linger in small, poorly ventilated spaces.
Figure 7. Cumulative distribution plots for the feature values used to predict sleep quality perceptions. Each plot shares the same y-axis values.
While the CO2 and CO concentrations might be high, PM2.5 concentrations are, on average, lower than those measured in related studies (Liao, Delghust, and Laverge Citation2019; McCormack et al. Citation2009) which might be attributed to conditions, such as flooring type and cleaning/cooking activities, that would differ between space types and participant populations. The temperature measurements in our study are, on average, lower than temperatures measured in bedrooms from a related study (Xiong et al. Citation2020), but with a larger variation in values. Our measured RH are lower, but consistent with typical values measured in homes and within the range recommended by ASHRAE Standard 55.
Model optimization and performance
Initially, we attempted to determine the hyperparameters for the DT and RF models based on their aggregated performance across all four sleep metrics. However, the accuracy of the DT and RF models improved when predicting TST and restfulness when the depths of the trees were limited to 2 while for SOL and NAW, the optimal depth was 6. For each sleep metric, we used 10 estimators in the RF model. Again, we use the default values for the LR and NB models since varying the hyperparameters associated with these classifiers did not notably alter their performance.
shows the accuracy of the four classifiers when predicting from the training and testing datasets. When considering performance on the training set, the accuracy of each classifier is as good or better than the dummy model for each combination of target and model. On average, the DT model is the most accurate, but only by a few percentage points for each target. The NB is the worst performing model, but again only by a few percentage points when compared to the LR model. The DT and RF models are likely more accurate because they do not require observations to be independent where as independence is a necessary criteria for the LR and NB models. However, we choose to include the results from the LR and NB models so that we are consistent between analyses and illustrate that these models are still nearly as accurate as DT and RF models even when the assumption of independence is violated. All four classifiers and the dummy model have the same accuracy when considering restfulness which is a product of a heavily imbalanced dataset. When considering the models ability to predict on data not seen during training, the accuracy of predicting TST and restfulness remains consistent. However, the accuracy of these classifiers to predict SOL and NAW from the test data is significantly worse. A random guess model would be as or more accurate than each of these models which is surprising given the relatively good accuracy on the training data. We believe the accuracy of predicting SOL and NAW metrics is low because these are more challenging metrics for participants to remember (Means et al. Citation2003). In addition, the number of poor and satisfactory SOL and NAW reports are more evenly split than for TST and restfulness. Therefore accuracy will be higher for these two metrics since the models will have a tendency to predict the outcome that is in a majority of the imbalanced dataset.
Table 6. Performance of ML models when predicting self-reported sleep metrics.
Based on the accuracy scores in , the RF model seems to be the best predictor of self-reported sleep quality but must be tuned according to the sleep metric. All models perform poorly when predicting SOL and NAW from the test data, indicating that there is no relationship between these metrics and the IAQ parameters measured in this study. If we compare models by considering the F1 score, all the classifiers have nearly the same score. When predicting TST, the F1 score from the LR model has a very slight increase over the dummy model and the same increase is observed for the DT and RF models when predicting SOL. The decision thresholds are similar amongst all four models when predicting TST and restfulness but significantly lower for the tree-based models when predicting SOL and NAW. The low decision thresholds are likely due to the lack of relationship between the IAQ parameters and sleep metrics. Therefore the optimal decision threshold is approximately zero meaning that the model will classify the set of inputs as the majority class i.e. act similarly to the dummy model.
Analysis
The feature importances from the DT and RF models are shown in . When predicting SOL and restfulness, the two classifiers agreed on the two most important parameters. For TST, PM2.5 was the most important feature for both classifiers and T was the second most important feature. Based on the value of the importance, T was significantly more important as the second parameter for the DT classifier than for the RF model, which was nearly equal in importance to CO and CO2. The PM2.5 and CO measurements drive the DT model when predicting TST with almost negligible influence by CO2 measurements. PM2.5 is also the most important predictor for restfulness in each model. is nearly as important as PM2.5 in the DT model but PM2.5 is significantly more important than any other predictor in the RF model. When predicting SOL and NAW, the value of the feature importance for the primary predictor is relatively low and nearly equivalent to the secondary predictor, especially when considering the RF model. Furthermore, the feature importance values for the remaining predictors decreases only slightly. The lack of a clear primary and/or secondary predictor underscores the poor ability of these models to accurately predict SOL and NAW.
Table 7. Feature importances from DT and RF models.
Based on the available research regarding the relationship between IAQ and sleep quality, we would have expected the models to indicate a greater sensitivity toward temperature and CO2. These variables only appear as important features when predicting SOL, however their weight is low relative to the other predictors. Generally, higher bedroom temperatures tends to degrade both objective and self-reported sleep quality (see Lan et al. Citation2017) and references within). Despite recording bedroom temperatures that exceeded 30°C, none of the models were significantly sensitive to temperature according the feature importances from both the DT and RF models. A handful of studies have found that elevated CO2 concentrations also tend to degrade objective and self-report sleep quality (Mishra et al. Citation2018; Strøm-Tejsen et al. Citation2016; Xu et al. Citation2021). Additionally, CO2 is generally a good proxy for overall IAQ in occupied spaces since concentrations will rise if ventilation is poor and vice-versa. However, we find that CO2 concentrations are only mildly important when predicting SOL. This finding is most likely a result of measuring typical CO2 concentrations where other studies consider consistent concentrations as high as 3000 ppm (Xu et al. Citation2021).
Discussion
Multiple studies have assessed the relationship between IAQ, building parameters, and air quality satisfaction (Hedge, Erickson, and Rubin Citation1996; Ma et al. Citation2021), but our study is one of the few that attempts to predict occupants’ satisfaction with IAQ based on these parameters. Predicting occupants’ perception of IAQ is the logical next step now that researchers have discovered the parameters with the greatest influence. In such a study, researchers were able to predict the percentage of occupants with one or more building-related symptoms using multiple configurations of an artificial neural network, boasting r2>0.60 when compared to observed symptoms (Sofuoglu Citation2008). Their model takes into account the same IAQ parameters as we do and also considers the microbiome, light, and noise, but does not account for building characteristics such as ventilation like our models. The ability to predict occupants’ perceptions of IAQ would allow operators to adjust building systems to help tackle issues associated with SBS.
We are the first study to attempt to predict perceived sleep quality from bedroom IAQ measurements. However, related studies have used a variety of other factors to predict perceived and/or device-measured sleep quality with varying success. Using sophisticated, deep-learning models, researchers in (Sathyanarayana et al. Citation2016) were able to predict satisfactory or poor sleep efficiency from day-time activity with an accuracy as high as 93% using a convolutional neural network. One study used participant’s level of social interaction alongside smartphone data and their previous night’s sleep to predict perceived sleep quality with an accuracy of 78.3% (Bai et al. Citation2012). Stress was found to be a weak predictor of sleep quality compared to a subject’s previous night’s sleep although the authors remark that stress measured during the study had only modest variation (Åkerstedt et al. Citation2012). These studies underscore the wide variety of factors that can affects one’s sleep and indicate their value in future models that attempt to predict sleep quality.
While we were able to predict perceptions of IAQ and, to a certain extent, sleep quality from our datasets, we expect the performance of our models would improve if IAQ conditions had been more extreme. As explained in Sections 3.1.1 and 3.2.1, the IAQ measurements were within typical ranges also measured in related studies that considered home and bedroom environments. Since these measurements are typical, participants are likely accustomed to these environments and, therefore, a greater value or variation in IAQ parameters would likely elicit more significant responses. provides insight into this problem where the distinguishing features between classes is not well-defined. The distinction between measurements of IAQ parameters and sleep metric classes is blurred even more. Examining the more “extreme” measurements in , the distinction between classes is more apparent, reinforcing the idea that elevated IAQ measurements would likely improve the models’ predictive performance.
For any ML model, more data generally leads to improvements in model performance assuming there is a relationship between features and the specified target. In terms of our analyses, we were using datasets composed of 89 and 273 observations, respectively. These small datasets highlight two important concepts in terms of future IAQ research. The first dataset that considers perception of IAQ underscores the lack of publicly-available data on emerging topics in the IAQ field. Both datasets also highlight the challenge of collecting and combining data collected from multiple modalities, one of which is reliant on participant involvement. In the case of the IAQ perception dataset, researchers reduced the burden on participants by requiring them to fill out only one survey despite measuring IAQ conditions over a period of a week. Regarding the sleep quality dataset, IAQ measurements were made continuously over a period of 11 weeks but participants, on average, only submitted 2 surveys per week – half the number that researchers requested.
ML techniques are useful to both predict outcomes as well as discover relationships between variables that might not be apparent. Typically, researchers employ unsupervised techniques that, through various methods, attempt to delineate distinct groups of observations. However, in this study we assume a relationship exists between our features and targets and assess the strength of the relationships by analyzing the accuracy of the classifiers and feature importances from the DT and RF models. Based on the results from both our analyses, we were able to determine weak relationships between features of IAQ and building parameters with targets related to the occupants’ perceptions of IAQ and sleep quality. The process proves to be a useful technique, at least in regard to exploratory analysis, to help identify key features and potential relationships.
Conclusion
The results from both analyses indicate that we were able to predict, in most cases, participants’ perception of IAQ and sleep quality with an accuracy as good or better than a dummy model that predicted the majority observation regardless of the input. In the first analysis, we use four classifiers – LR, NB, DT, and RF – to explore a more direct relationship between IAQ and ventilation parameters with occupants’ perceptions of air quality. Each model was able to predict a binary IAQ satisfaction level with 5% – 17% greater accuracy than the dummy model with the RF model performing the best. The DT model performed nearly as well, but emphasized IAQ parameters in the classification process while building characteristics were the greatest predictors in the RF model. In the second analysis, we use nightly IAQ measurements from participants’ bedrooms to classify 4 metrics of self-reported sleep quality using the same four classifiers but with altered hyperparameters. Each of these classifiers was able to predict TST and restfulness scores with the same accuracy as the dummy model but failed to predict SOL and NAW with an accuracy greater than the dummy model. The RF model again tended to perform the best across all four sleep metrics. The performance of the models would likely improve if participants had been made aware to consider the IAQ when self-reporting their sleep or a greater variation in IAQ measurements had observed.
Our work on both analyses adds to the limited body of research and sheds light on the ability of IAQ measurements to predict outcomes of occupant perception of their indoor environment and suggest their use when considering a person’s sleep quality. Despite the logical pathways between the features and targets we consider, the accuracy of our models is limited which suggests that occupants can acclimate to concentrations of indoor air pollutants and building characteristics that are within a wide, but typical range. Therefore studies in the future should consider more varied IAQ and building characteristics so that occupants can more readily perceive changes in IAQ. Our work also highlights the utility of ML in exploratory analysis to help identify multivariate relationships that might not otherwise be apparent.
Acronyms
BEVO Beacon Building Occupancy and EnVironment Beacon.
CO Carbon Monoxide.
CO2 Carbon Dioxide.
CV Cross-Validation.
DT Decision Tree.
EMA Ecological Momentary Assessment.
HCHO Formaldehyde.
IAQ Indoor Air Quality.
KNN K-nearest neighbor.
LR Logistic Regression.
ML Machine Learning.
NAW Number of Awakenings.
NB Gaussian Naïve-Bayes.
NO2 Nitrogen Dioxide.
NOx Nitrogen Oxides.
PM Particulate Matter.
PM2.5 Particulate Matter with aerodynamic diameter less than 2.5 µm.
RF Random Forest.
RH Relative Humidity.
SBS Sick Building Syndrome.
SE Sleep Efficiency.
SOL Sleep Onset Latency.
T Temperature.
TST Total Sleep Time.
TVOC Total Volatile Organic Compound.
VOC Volatile Organic Compound.
Acknowledgment
This work was supported by Whole Communities—Whole Health, a research grand challenge at the University of Texas at Austin.
Disclosure statement
No potential conflict of interest was reported by the author(s).
Data Availability Statement
The data that support the findings of this study are available from the corresponding author, HF, upon reasonable request. Data for the first analysis on IAQ and IAQ satisfaction has also been made publicly available by authors in [19] and [20].
Additional information
Notes on contributors
Hagen Fritz
Hagen Fritz is a Ph.D. student at the University of Texas at Austin in the Building Energy and Environments program within the Civil, Architectural, and Environmental Engineering department. His research centers around the development and application of consumer-grade sensors to monitor indoor air quality and relating these data to outcomes of human health measured through similar means.
Mengjia Tang
Mengjia Tang is currently a Ph.D. candidate in the Department of Civil, Architectural, and Environmental Engineering at the University of Texas at Austin. Her research interests include indoor air quality, air cleaning devices, and the association between buildings and occupant health.
Kerry Kinney
Kerry Kinney is a L.P. Gilvin Centennial Professor in Engineering at The University of Texas at Austin. Her research interests include microbial exposures and occupant health; indoor air quality; premise plumbing and drinking water quality; bioaerosols; and treatment process design for municipal and industrial wastewaters.
Zoltan Nagy
Zoltan Nagy is an assistant professor in the Department of Civil, Architectural, and Environmental Engineering at The University of Texas at Austin, directing the Intelligent Environments Laboratory since 2016. His research interests are in smart buildings and cities, renewable energy systems, control systems for zero emission building operation, and the application of machine learning and artificial intelligence for the built environment for a sustainable energy transition.
References
- Åkerstedt, T., N. Orsini, H. Petersen, J. Axelsson, M. Lekander, and G. Kecklund. 2012. Predicting sleep quality from stress and prior sleep–a study of day-to-day co- variation across six weeks. Sleep Med. 13 (6):674–79. doi:10.1016/j.sleep.2011.12.013.
- Akimoto, M., C. Sekhar, M. P. Bivolarova, C. Liao, X. Fan, J. Laverge, L. Lan, and P. Wargocki. 2021. Reviewing how bedroom ventilation affects IAQ and sleep quality. ASHRAE J. 63 (4):56–60.
- ASHRAE. 2019. ANSI/ASHRAE standard 62.2-2019: Ventilation and acceptable indoor air quality in residential buildings.
- Bai, Y., B. Xu, Y. Ma, G. Sun, and Y. Zhao. 2012 Will you have a good sleep tonight?: Sleep quality prediction with mobile phone. 7th International Conference on Body Area Networks, BODYNETS 2012, Oslo, Norway.
- Billings, M. E., D. Gold, A. Szpiro, C. P. Aaron, N. Jorgensen, A. Gassett, P. J. Leary, J. D. Kaufman, and S. R. Redline. 2019. The association of ambient air pollution with sleep apnea: The multi-ethnic study of atherosclerosis. Ann. Am. Thorac. Soc. 16 (3):363–70. doi:10.1513/AnnalsATS.201804-248OC.
- Breiman, L. 2001. Random forests. Mach Learn 45 (1):5–32. doi:10.1023/A:1010933404324.
- Chuang, H.-C., K.-F. Ho, L.-Y. Lin, T.-Y. Chang, G. B. Hong, C.-M. Ma, I.-J. Liu, and K.-J. Chuang. 2017. Long- term indoor air conditioner filtration and cardiovascular health: A randomized crossover intervention study. Environ Int 106:91–96.
- Colton, M. D., P. MacNaughton, J. Vallarino, J. Kane, M. Bennett-Fripp, J. D. Spengler, and G. Adamkiewicz. 2014. Indoor air quality in green vs conventional multifamily low-income housing. Environ. Sci. Technol. 48 (14):7833–41. doi:10.1021/es501489u.
- Fang, L., G. Clausen, and P. O. Fanger. 1998. Impact of temperature and humidity on the perception of indoor air quality. Indoor Air 8 (2):80–90. doi:10.1111/j.1600-0668.1998.t01-2-00003.x.
- Fiedler, N., K. Kelly-McNeil, P. Ohman-Strickland, J. Zhang, J. Ottenweller, and H. M. Kipen. 2008. Negative affect and chemical intolerance as risk factors for building- related symptoms: A controlled exposure study. Psychosom Med 70 (2):254–62. doi:10.1097/PSY.0b013e31816074f4.
- Fritz, H., S. Bastami, C. Lin, K. Nweye, T. To, L. Chen, D. Le, A. Ibarra, W. Zhang, J. Y. Park, et al. 2022. Design, fabrication, and calibration of the Building EnVironment and Occupancy (BEVO) Beacon: A rapidly-deployable and affordable indoor environmental quality monitor. Building and Environment. doi:10.1016/j.buildenv.2022.109432
- Fritz, H., K. A. Kinney, C. Wu, D. M. Schnyer, and Z. Nagy. 2022. Data fusion of mobile and environmental sensing devices to understand the effect of the indoor environment on measured and self-reported sleep quality. Build. Environ. 214:108835. doi:10.1016/j.buildenv.2022.108835.
- Fritz, H., and Z. Nagy. 2020. Ecologically valid multimodal data collection. In: Proceedings of the 7th ACM International Conference on Systems for Energy-Efficient Buildings, Cities, and Transportation, Yokohama, Japan. p. 326–27.
- Geng, Y., W. Ji, B. Lin, and Y. Zhu. 2017. The impact of thermal environment on occupant ieq perception and productivity. Build. Environ. 121:158–67. doi:10.1016/j.buildenv.2017.05.022.
- Gilbert, N. L., D. Gauvin, M. Guay, M.-È. Héroux, G. Dupuis, M. Legris, C. C. Chan, R. N. Dietz, and B. Lévesque. 2006. Housing characteristics and indoor concentrations of nitrogen dioxide and formaldehyde in quebec city, Canada. Environ. Res. 102 (1):1–8. doi:10.1016/j.envres.2006.02.007.
- Hedge, A., W. A. Erickson, and G. Rubin. 1996. Predicting sick building syndrome at the individual and aggregate lev- els. Environ Int 22 (1):3–19. doi:10.1016/0160-4120(95)00099-2.
- Hidayat, W., T. D. Tambunan, and R. Budiawan. 2018. Empowering wearable sensor generated data to predict changes in individual’s sleep quality. In: 2018 6th International Conference on Information and Communication Technology (ICoICT), Bandung, Indonesia. IEEE. p. 447–52.
- Järnström, H., K. Saarela, P. E. A. Kalliokoski, and A.-L. Pasanen. 2006. Reference values for indoor air pollutant concentrations in new, residential buildings in Finland. Atmos. Environ. 40 (37):7178–91. doi:10.1016/j.atmosenv.2006.06.021.
- Kim, K.-H., E. Kabir, and S. Kabir. 2015. A review on the human health impact of airborne particulate matter. Environ Int 74:136–43. doi:10.1016/j.envint.2014.10.005.
- Klepeis, N. E., W. C. Nelson, W. R. Ott, J. P. Robinson, A. M. Tsang, P. Switzer, J. V. Behar, S. C. Hern, and W. H. Engelmann. 2001. The national human activity pattern survey (nhaps): A resource for assessing exposure to environmental pollutants. J Expo Sci Environ Epidemiol 11 (3):231–52. doi:10.1038/sj.jea.7500165.
- Lan, L., K. Tsuzuki, Y. Liu, and Z. Lian. 2017. Thermal environment and sleep quality: A review. Energy Build. 149:101–13. doi:10.1016/j.enbuild.2017.05.043.
- Lan, L., P. Wargocki, D. P. Wyon, and Z. Lian. 2011. Effects of thermal discomfort in an office on perceived air quality, SBS symptoms, physiological responses, and human performance. Indoor Air 21 (5):376–90. doi:10.1111/j.1600-0668.2011.00714.x.
- Langer, S., and G. Bekö. 2013. Indoor air quality in the Swedish housing stock and its dependence on building characteristics. Build. Environ. 69:44–54. doi:10.1016/j.buildenv.2013.07.013.
- Lévesque, B., V. Huppé, M. Dubé, and R. Fachehoun. 2018. Impact of indoor air quality on respiratory health: Results of a local survey on housing environment. Public Health 163:76–79. doi:10.1016/j.puhe.2018.06.015.
- Liao, C., M. Delghust, and J. Laverge. 2019. Association between indoor air quality and sleep quality. In: 40th AIVC, 8th TightVent & 6th venticool Conference, Ghent, Belgium.
- Ma, N., D. Aviv, H. Guo, and W. W. Braham. 2021. Measuring the right factors: A review of variables and models for thermal comfort and indoor air quality. Renew. Sustain. Energy Rev. 135:110436. doi:10.1016/j.rser.2020.110436.
- McCormack, M. C., P. N. Breysse, E. C. Matsui, N. N. Hansel, D. Williams, J. Curtin-Brosnan, P. Eggleston, and G. B. Diette. 2009. Center for Childhood Asthma in the Urban Environment, In-home particle concentrations and childhood asthma morbidity. Environ. Health Perspect. 117 (2):294–98. doi:10.1289/ehp.11770.
- Means, M. K., J. D. Edinger, D. M. Glenn, and A. I. Fins. 2003. Accuracy of sleep perceptions among insomnia sufferers and normal sleepers. Sleep Med. 4 (4):285–96. doi:10.1016/S1389-9457(03)00057-1.
- Menard, S. 2002. Applied logistic regression analysis, Vol. 106. SAGE Publications, Inc. doi:10.4135/9781412983433.
- Mishra, A. K., A. Van Ruitenbeek, M. Loomans, and H. Kort. 2018. Window/door opening-mediated bedroom ventilation and its impact on sleep quality of healthy young adults. Indoor Air 28 (2):339–51. doi:10.1111/ina.12435.
- Myles, A. J., R. N. Feudale, Y. Liu, N. A. Woody, and S. D. Brown. 2004. An introduction to decision tree modeling. J. Chemom: A J. Chemom. Soc 18 (6):275–85. doi:10.1002/cem.873.
- Ohayon, M., E. M. Wickwire, M. Hirshkowitz, S. M. Albert, A. Avidan, F. J. Daly, Y. Dauvilliers, R. Ferri, C. Fung, D. Gozal, et al. 2017. National sleep foundation’s sleep quality recommendations: First report. Sleep Health. 3 (1):6–19. doi:10.1016/j.sleh.2016.11.006.
- Pan, W. 2010. Relationships between air-tightness and its influencing factors of post-2006 new-build dwellings in the uk. Build. Environ. 45 (11):2387–99. doi:10.1016/j.buildenv.2010.04.011.
- Raw, G. J., S. K. Coward, V. M. Brown, and D. R. Crump. 2004. Exposure to air pollutants in English homes. J. Expo. Sci. Environ. Epidemiol 14 (1):S85–S94. doi:10.1038/sj.jea.7500363.
- Redlich, C. A., J. Sparer, and M. R. Cullen. 1997. Sick-building syndrome. Lancet 349 (9057):1013–16. doi:10.1016/S0140-6736(96)07220-0.
- Ross, D., and D. Wilde. 1999. Continuous monitoring of nitrogen dioxide and carbon monoxide levels in UK homes. Proc. Indoor Air 99:147–52.
- Sammut, C., and G. I. Webb 2011. Encyclopedia of machine learning. Springer Science & Business Media.
- Sathyanarayana, A., S. Joty, L. Fernandez-Luque, F. Ofli, J. Srivastava, A. Elmagarmid, T. Arora, and S. Taheri. 2016. Sleep quality prediction from wearable data using deep learning. JMIR Mhealth Uhealth 4 (4):e125. doi:10.2196/mhealth.6562.
- Ścibor, M., B. Balcerzak, A. Galbarczyk, N. Targosz, and G. Jasienska. 2019. Are we safe inside? indoor air quality in relation to outdoor concentration of pm10 and pm2. 5 and to characteristics of homes. Sustain. Cities Soc. 48:101537. doi:10.1016/j.scs.2019.101537.
- Sekhar, S., K. Tham, and K. Cheong. 2003. Indoor air quality and energy performance of air-conditioned office buildings in Singapore. Indoor Air 13 (4):315–31. doi:10.1111/j.1600-0668.2003.00191.x.
- Singer, B. C., W. R. Chan, Y.-S. Kim, F. J. Offermann, and I. S. Walker. 2020. Indoor air quality in California homes with code-required mechanical ventilation. Indoor Air 30 (5):885–99. doi:10.1111/ina.12676.
- Sofuoglu, S. C. 2008. Application of artificial neural net- toms in office buildings. Build. Environ. 43 (6):1121–26. doi:10.1016/j.buildenv.2007.03.003.
- Strøm-Tejsen, P., D. Zukowska, P. Wargocki, and D. P. Wyon. 2016. The effects of bedroom air quality on sleep and next-day performance. Indoor Air 26 (5):679–86. doi:10.1111/ina.12254.
- Tang, H., Y. Ding, and B. Singer. 2020. Interactions and comprehensive effect of indoor environmental quality factors on occupant satisfaction. Build. Environ. 167:106462. doi:10.1016/j.buildenv.2019.106462.
- Watson, N. F., M. S. Badr, G. Belenky, D. L. Bliwise, O. M. Buxton, D. Buysse, D. F. Dinges, J. Gangwisch, M. A. Grandner, C. Kushida, et al. 2015. Recommended amount of sleep for a healthy adult: A joint consensus statement of the American academy of sleep medicine and sleep research society. J. Clin. Sleep Med. 11 (6):591–92. doi:10.5664/jcsm.4758.
- Wei, W., O. Ramalho, L. Malingre, S. Sivanantham, J. C. Little, and C. Mandin. 2019. Machine learning and statistical models for predicting indoor air quality. Indoor Air 29 (5):704–26. doi:10.1111/ina.12580.
- Weschler, C. J. 2006. Ozone’s impact on public health: Contributions from indoor exposures to ozone and products of ozone-initiated chemistry. Environ. Health Perspect. 114 (10):1489–96. doi:10.1289/ehp.9256.
- Williams, J. A., and D. J. Cook. 2017. Forecasting behavior in smart homes based on sleep and wake patterns. Technol. Health Care 25 (1):89–110. doi:10.3233/THC-161255.
- World Health Organization. 2010. WHO guidelines for indoor air quality: Selected pollutants. World Health Organization, Regional Office for Europe.
- Wu, C., H. Fritz, S. Bastami, J. P. Maestre, E. Thomaz, C. Julien, D. M. Castelli, K. de Barbaro, S. K. Bearman, G. M. Harari, et al. 2021. Multi-modal data collection for measuring health, behavior, and living environment of large-scale participant cohorts. GigaScience. 10 (6):giab044. doi:10.1093/gigascience/giab044.
- Xiong, J., L. Lan, Z. Lian, and R. De Dear. 2020. Associations of bedroom temperature and ventilation with sleep quality. Sci. Technol. Built Environ. 26 (9):1274–84. doi:10.1080/23744731.2020.1756664.
- Xu, X., Z. Lian, J. Shen, T. Cao, J. Zhu, X. Lin, K. Qing, W. Zhang, and T. Zhang. 2021. Experimental study on sleep quality affected by carbon dioxide concentration. Indoor Air 31 (2):440–53. doi:10.1111/ina.12748.
- Zhao, H., W. R. Chan, S. Cohn, W. W. Delp, I. S. Walker, and B. C. Singer. 2021. Indoor air quality in new and renovated low-income apartments with mechanical ventilation and natural gas cooking in California. Indoor Air 31 (3):717–29. doi:10.1111/ina.12764.