
 ?Mathematical formulae have been encoded as MathML and are displayed in this HTML version using MathJax in order to improve their display. Uncheck the box to turn MathJax off. This feature requires Javascript. Click on a formula to zoom.
ABSTRACT
Municipal domestic waste (MDW) management is essential to maintain ecological security. Waste classification is seen as a solution to the urban waste dilemma. However, very few residents in China are currently involved in waste classification. Based on the public goods theory and the hypothesis of rational behavior, with the aid of GIS, this paper develops a multi-agent model to simulate the features and evolution of residents’ waste classification behavior in the context of community. By comparing the percentage of those who participate in waste classification in different scenarios, various factors that may influence residents’ waste classification behavior are analyzed. The simulation results show that the improvement of convenience facilities and the promotion of awareness-raising activities help enhancing residents’ waste classification behavior. An increase in rewards and penalties by the government will promote residents’ waste classification behavior, though this promotion is not significant. Adherent enforcers can provide a continuous incentive for residential waste classification behavior. This study provides evidence for the government and communities to develop waste classification policies and motivate residents to participate in waste classification.
Implications: Municipal waste seriously restricts the survival and development of cities, and waste disposal has become a problem that plagues government managers in various countries. Waste classification is considered to be an effective way to solve the municipal waste dilemma, but currently China faces the dilemma of low residents’ participation in waste classification. Through multi-agent modeling, the interaction and decision-making of urban residents in the process of waste classification are simulated, and introduce GIS to truly restore the daily classification scenes of residents. Explore the dynamic evolution of urban residents’ classification behavior and the change of residents’ waste classification rate under different situations to find more effective ways to improve the participation rate of residents in waste classification and give targeted and practical countermeasure suggestions. It provides decision-making reference for the formulation of governmental waste classification policies and the design of community behavior programs, and to contribute to the sustainable development of society.
Introduction
With rapid urbanization, population growth and world economic development, municipal domestic waste (MDW) management has become a worldwide challenge (Guo et al. Citation2021). According to the report released by the world bank, the world is expected to generate 3.4 billion tons of waste annually by 2050 if no measures are taken (Kaza et al. Citation2018). The problem of MDW is deteriorating into a global crisis, posing a serious threat to the environment and human health.
Since the reform and opening, China has experienced the fastest and largest urbanization process in human history (Wei et al. Citation2020). With the achievements of urbanization, the tremendous pressure of growing domestic waste on the urban environment is gradually exposed (Qiao and Hua Citation2021). Removal and transportation volume of MDW in China increased from 118.188 million tons in 2000 to 242.062 million tons in 2019. It is estimated that by 2030, China’s domestic waste production will exceed 300 million tons. The fast-paced lifestyle, the rapid growth in the consumption of plastic products (Shamshad et al. Citation2021), the “excessive packaging” brought about by the rapid development of express delivery and takeout industries (Kang et al. Citation2021), and all kinds of electronic waste produced by the rapid change of science and technology have greatly changed the content and form of waste (Maria, Combariza Bayona, and Sripada Citation2021). The composition of waste is more complex, and the difficulty of waste treatment is further increased. The problem of MDW has been upgraded from the version 1.0 “waste siege” to the version 2.0 “waste syndrome”. MDW not only affects the daily life of residents and threatens the ecological environment (Wen et al. Citation2014), but the successive outbreaks of “Not In My Back Yard” (NIMBY) conflict (Cong et al. Citation2021; Yan, Agamuthu, and Waluyo Citation2020; Yang et al. Citation2020c) also indicate that if the waste problem is not handled properly, it will turn into a social problem, aggravate the conflict between the government and the public, and affect social stability.
MDW management is a complex system. At present, China’s domestic waste management system mainly involves four links: classified delivery, classified collection, classified transportation, and classified treatment (Li et al. Citation2019). Waste classification is the starting point, the prerequisite for realizing recycling, harmlessness and reduction of waste treatment, and is regarded as the fundamental way to solve the problem of MDW (Sukholthaman and Sharp Citation2016; Wang et al. Citation2020). After Waste classification, recyclable substances can be effectively recovered (Nie et al. Citation2018). Hazardous waste is disposed of uniformly and specifically to reduce pollution to the environment and harm to humans. After classification, the amount of residue is less than 10%, which improves the efficiency of waste treatment and greatly improves the economic benefits of incineration projects (Gu, Liu, and Wang Citation2021; He and Lin Citation2019). Waste classification makes waste treatment more efficient and environmentally friendly, while satisfying the shift in people’s pattern from control and treatment of the waste to what resources to be used from the waste.
In order to promote Waste classification, China has been taking action. At the national level, as early as 2000, China has carried out the deployment of Waste classification work. The Law of the People’s Republic of China on the Prevention and Control of Environmental Pollution by Solid Waste, which came into effect on September 1, 2020, puts forward the implementation of domestic waste classification system in the form of law, and waste classification has been promoted to a new height again. In this context, China’s waste classification work has not achieved obvious results, far from the expected goal (Li et al. Citation2022; Lu and Sidortsov Citation2019). According to the results of a household survey conducted by the Development Research Center of the State Council in 2019 in eight provinces, only 36.3% of the respondents classified their domestic waste, and nearly half of the eight provinces surveyed have a residents’ waste classification rate of less than 40% (Development Research Centre of the State Council Citation2019). A large number of residents are afraid of trouble, time-consuming, and behavioral frustration caused by mixed collection and transportation, don’t carry out waste classification in accordance with regulations, and waste classification work faces a collective action dilemma (Zhang and Zhang Citation2016). In addition, the report of the development research center of the State Council further points out that, Residents’ waste classification is more based on rewards than the conscious willingness to protect the environment. This phenomenon is consistent with the hypothesis of rational behavior (Lü et al. Citation2018).
Residents are the behavior subjects of waste classification, and their behavior choice determines the effect of waste classification (Meng et al. Citation2019). The low participation of residents has become a huge obstacle to the implementation of waste classification (Li Citation2021), and how to improve the percentage of those who participate in waste classification has become an important topic in promoting waste classification. Many scholars have focused their research on residents, from the macro perspective of institutional construction (Wan, Shen, and Yu Citation2015) and social capital (Ibranhim and Law Citation2014) to the micro perspective of personal values, classification attitude (Zhang et al. Citation2015) and the awareness of environmental protection (Nguyen, Zhu, and Le Citation2015), researchers at home and abroad have conducted in-depth studies on the factors that affect the residents’ waste classification behavior. In the study of external scenarios, convenience of classification (Li et al. Citation2022), knowledge of waste classification (Peng et al. Citation2021), awareness-raising activities (Guo and Chen Citation2022) are also the focus of scholars’ research. The lack of resident participation is the most important reason why waste classification is difficult to implement, which has been agreed by most scholars (Zhang et al. Citation2021). However, domestic related studies mostly from the perspective of individual residents, and lack of consideration on the collective behaviors of waste classification. The quantitative research on the public goods attributes of residents’ waste classification behavior needs to be supplemented and perfected. In addition, the residents’ waste classification behavior is a dynamic evolution process, residents will constantly interact with the outside world to make choices, which involves not only the interaction between residents (Park and Ha Citation2014), but also the interaction between residents and the environment (Abdelradi Citation2018). Sometimes the results lack reference without considering the geospatial environment, but the spatial attribute factors are ignored by the majority of scholars. Traditional qualitative analysis and mathematical statistical analysis are difficult to study this problem, but simulation can effectively solve it.
In this paper, multi-agent simulation modeling and GIS is applied to the research of residents’ waste classification behavior, which is studied from the perspective of dynamic evolution, so as to realize the interaction of agents on the real city map. In view of the collective behavior dilemma faced by residents’ waste classification behavior, according to the hypothesis of rational behavior, the external situational factors affecting residents’ waste classification behavior are quantified and a quantitative model is established. Scenario simulation and simulation are carried out on residents’ waste classification behavior and interactive decision-making behavior in the process of waste classification in the community space, to study the interaction behavior within residents and between residents and the environment. It provides decision-making reference for the formulation of government waste classification policy and the design of community behavior scheme, and promotes the work of community waste classification.
Conceptual model
The classification of MDW has typical public goods attributes (Ma et al. Citation2020; Yang et al. Citation2020a). Residents pay costs for waste classification, and the positive external benefits such as the improvement of ecological environment, the improvement of resource utilization rate and the high-quality development of the city after waste classification are shared by all residents (Wang and You Citation2020). Based on this attribute, waste classification inevitably has the phenomenon of insufficient residents’ participation and collective action “free-riding”. More scholars pointed out that the Collective Action Dilemma has become an essential problem of waste source classification in China (Zhang and Zhang Citation2016). As a rational man (Camerer and Fehr Citation2006), residents’ behavior is the result of “rational choice” from the perspective of cost and income. Although there are many environmentalists with high classification awareness and moral values, they are driven by internal drive rather than external force to take the initiative on waste classification. However, at present, waste classification has not yet formed a social ethos, and residents’ environmental values are generally weak, free riders are still the main type in the process of MDW classification and management. The hypothesis of rational behavior can better explain the collective action dilemma of residents’ waste classification.
For age, gender, occupation, education level and other individual background characteristics (Babaei et al. Citation2015), there are still some controversies in academia. Different scholars’ studies on the same variable come to quite different conclusions. Considering that the relationship between this type of variable and the residents’ waste classification behavior is not stable, the explanatory power is relatively limited (Miafodzyeva and Brandt Citation2013; Rafia, Keisuke, and Kiyo Citation2009). Therefore, the individual background characteristics are not considered in this study.
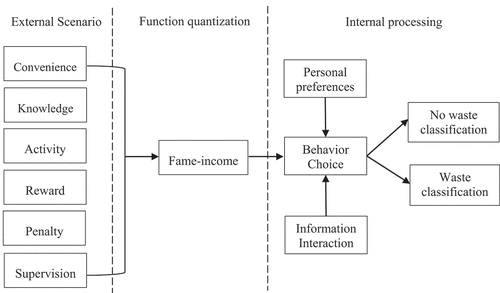
Referring to previous research results, this paper selected six factors to form the external scenario of residential waste classification: convenience, knowledge, awareness-raising activity, reward (Yang et al. Citation2018), penalty (Cui, Su, and Zhang Citation2021) and supervision (Chen et al. Citation2018), and divide residents into two types: fame or income-driven (Chen and Gao Citation2021). Quantify the impact of external scenarios on residents’ waste classification, and establish a functional relationship between it and the cost and income of residents’ waste classification behavior. The residents’ waste classification behavior changes the income of residents, and the residents’ perception of the income of their own and others’ waste classification behavior also react to residents’ behavior choice ().
Figure 1. Conceptual model of resident waste classification behavior selection.
Context and methodology
Research context
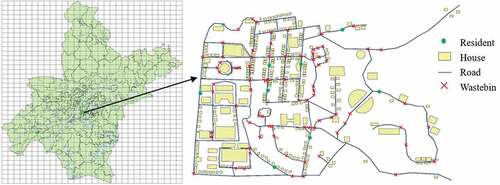
Wuhan (29◦58’~31◦22ʹN and 113◦41’~115◦05ʹE) is the capital of Hubei Province, the largest city in central China, with a large population, developed economy, and diverse and complex waste types. At the same time, Wuhan is one of the first 46 pilot cities to implement waste classification, a typical city for waste classification. The field of MDW classification and management is the community of residents’ daily life (Wan et al. Citation2020). Community is an important situation for public waste classification (Domina and Koch Citation2022). Therefore, this paper selects a vector map of administrative planning in a certain area of Wuhan as the simulation environment for simulation design. The specific things involved in the process of MDW classification are abstracted into a geographical two-dimensional model composed of points, lines and surfaces. As shown in , the yellow square represents the house, the green small circle represents the residents, the line represents the route, and the red cross represents the wastebin.
Figure 2. Simulation map of community residents’ waste classification.
Research methodology
Multi-agent system (MAS) has become one of the most popular methods for modeling real scenes and artificial social computing experiments because of its distribution, interaction and intelligence (Zhang et al. Citation2018). At present, it has been widely used in economics (Rano Citation2020), machine learning (Ehsan Citation2021), virus spreading (Castro et al. Citation2021), emergency management (Yang et al. Citation2020b) and other fields. Multi-agent modeling and simulation can simulate real or potential behavior in complex adaptive systems, while being able to adapt to changing environments and highly restore complex systems. The target attribute of the agent and the ability to perceive the external environment to make decisions independently are very suitable for the study of multi-agent behavior. In addition, Waste classification behavior is a spatial interaction simulation between individuals and groups, and the multi-agent model can more realistically reflect individual classification behavior and group classification results.
The GIS can provide a simulation environment with realistic scenes, and can record the location information of the agent. The multi-agent model can build an interactive network by extracting the road networks and residential areas from geographic information. The combination of GIS and multi-agents can break through the limitations of single technology in the realistic environment and scene interaction, enabling each agent to interact in the realistic geospatial environment provided by GIS (Na and Banerjee Citation2019; Sun et al. Citation2021), and more truly simulation of interaction between multiple subjects and between subjects and the environment. The simulation of waste classification behavior with geographic information and behavior subject characteristics can dynamically display the evolution of residents’ behavior and residents’ real-time perception of environment and behavior utility.
Multi-agent model
Agents’ attributes
The multi-agent simulation experiment of waste classification behavior involves Resident Agent, Wastebin Agent, Road Agent and House Agent. Resident agents have their own numbers and preference attributes. They can perceive the information of houses, roads and wastebins on the map and make corresponding judgments and decision-making behavior. The status of the resident agent’s income variables, credit variables and behavior habit variables are updated synchronously after making behavior decisions. Wastebin agent has convenience and location attributes, and each wastebin has its own number and fixed location. The location of the wastebin agent can be recognized by the passing resident agent. Road agent has its own number, road starting point label and road length attributes. The distance between any two points on the road agent can be calculated. The house agent has its fixed number, area and location coordinates. The attributes of the above-mentioned agents are summarized in .
Table 1. Summary table of multi-agent model attributes.
Model for reputation
At present, the atmosphere of waste classification has not been formed in society. Residents who abide by social rules and fulfill their responsibility for waste classification will be appreciated and praised by others. Good social evaluation enables residents to gain more social respect and spiritual satisfaction. This kind of non-economic return can also be regarded as the income obtained by residents participating in waste classification. is defined as the accumulated reputation generated by residents’ waste classification behavior at time T, and the calculation formula is shown in EquationEquation (1)
(1)
(1) :
Where, means that residents choose waste classification.
Model for economy
Classification cost
In order to do a good job of waste classification, residents will buy the corresponding waste classification products. For example, classified waste bags, special wastebin, etc. represents the money expenditure of residents for waste classification. In addition to direct economic expenditure, waste classification also requires residents to pay a certain amount of time and energy. Most of the time, the high intangible cost is a major problem hindering residents’ waste classification. In this paper, the non-economic expenditure of waste classification is quantified by the time of waste classification, which is regarded as a time cost. Residents’ waste classification time is related to their knowledge of waste classification and the convenience of wastebins. With the increase of residents’ waste classification times and the formation of classification habits, the time spent by residents on classification will be reduced, and waste classification has gradually become a living habit of people. This paper assumes that when residents carry out waste classification up to three times, residents have a certain experience of waste classification, and their time spent in the process of waste classification will be reduced.
represents the time required by residents’ waste classification behavior.
represents the time cost of residents’ waste classification behavior. The calculation formula is shown as follows:
Where, is the time it takes for residents to carry out waste classification for the first time.
is the convenience degree of waste classification. The value ranges from 0 to 1, and
indicates sufficiently convenient.
represents awareness-raising activities on waste classification. The value of
is greater than or equal to 1, and
represents that the government has not carried out waste classification education to help residents understand relevant knowledge.
is the resident’s classification proficiency, and its value is equal to the cumulative number of residents’ waste classification.
is the unit time cost of waste classification.
Incentives by government
In order to encourage residents to do waste classification, the government will give rewards to residents who implement waste classification. In the meantime, the government will penalize residents who do not classify their waste. Considering real-life conditions, it is difficult for the government to comprehensively supervise residents and to penalize all residents who do not classify. Thus, for better simulation of reality, a probability coefficient is added before the penalty, and its value is randomly generated in each round.
External benefits
Waste classification has important social, economic and environmental benefits. The three benefits generated by residents’ waste classification behavior belong to public goods, which are shared by all residents. In this model, the positive external benefit of waste classification is regarded as an economic benefit of residents, indicated by .
represents the total economic income of residents’ waste classification, where the calculation formula is shown in EquationEquation (4)
(4)
(4) :
Where, is the number of waste classification residents at this moment.
is the total number of residents.
Model of strategy updating
Waste classification is a collective behavior, and the waste classification behavior of the people around you will have an impact on the individual (Park and Ha Citation2014). There is information exchange and sharing among residents. When residents see the high income of their neighbors, reason will urge residents to imitate and learn the behavior of their neighbors. Due to the existence of free riding behavior, the fame and wealth value obtained by residents’ waste classification behavior is not strictly proportional. In this model, two imitation strategies of fame and wealth are considered. Residents are divided into income-driven and fame-driven. Residents will update their strategies according to their behavior preferences. Residents with income or fame preference will simulate the behavior of the neighbor with the highest wealth (fame) with a certain probability, so as to update their strategies. Residents are given different behavior preferences randomly, and the behavior preferences of residents do not change during the entire simulation process. The calculation rule of the resident strategy update probability is shown in EquationEquation (5)(5)
(5) .
Where, is the maximum value of fame or wealth among residents’ neighbors.
is noise parameter.
Results and discussion
Model-interaction rule
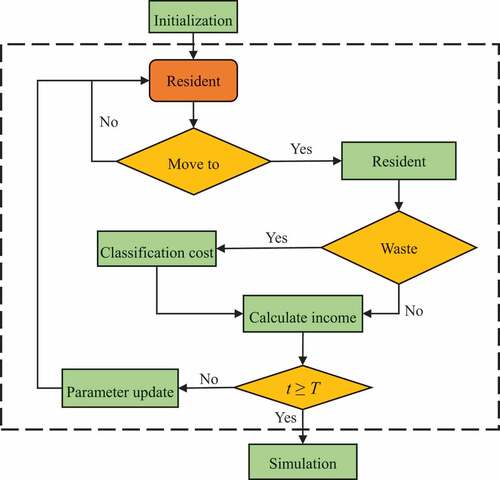
Residents carrying domestic waste are willing to litter and move freely on the road. When residents pass by the wastebin, they can get information about the behavior, income, credit and other information of their neighbors within a certain range. Residents use this as a reference to emulate with certain probability the neighbors’ decision-making behavior and, in turn, decide whether to implement waste classification behavior. When residents arrive at the wastebin for the first time, there is a half probability that they will select waste classification. Residents’ fame and fortune state variables will be automatically updated after the waste classification behavior. The multi-agent simulation process of residents’ waste classification behavior is shown in .
Figure 3. Multi-agent simulation process.
Based on the idea of parallel experiment in computational simulation, the threshold value of initial parameters is set and simulated, and a group of parameters that can directly reflect the actual situation is selected as the initial value. The meaning and initial value of each simulation parameter are shown in . The number of residents who choose waste classification at each time is counted, and the proportion of the number of residents who choose waste classification varies with the simulation time as shown in .
Table 2. Summary of simulation parameters.
Figure 4. Resident classification participation rate under initial conditions.
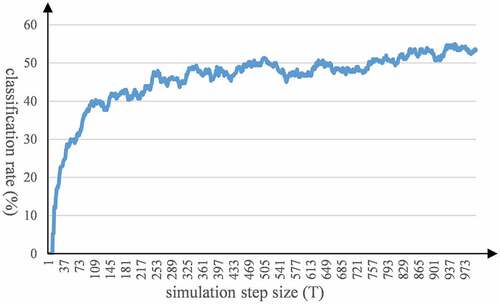
As shown in , under the initial conditions, the participation rate of resident classification grew rapidly in the pre period, and the growth rate slowed down after 1/3 of the simulation. In the middle of the simulation, the classification rate of residents reaches 0.5, and then slowly increased with small fluctuations. By the end of the simulation, the classification rate is about 0.53.
Simulation experiment
In order to explore the influence of different variables on the residents’ waste classification behavior, looking for factors that can promote the residents’ waste classification. In this paper, four scenarios are selected: convenience of classification, reward, penalty, and whether there are adherent enforcers. To examine the changes in the results of the macro-evolution of the MDW classification in four new scenarios by adjusting the parameter sizes or designing new rules.
Experiment 1: the impact of classification convenience on residents’ behavior
Keep other parameters unchanged, and increase the a from 0.5 to 1. The results of the evolution of the resident classification rate over time are shown in . Compared with the initial state, the development trends of the two curves are highly consistent. At the beginning of the simulation, the two curves grew rapidly, entering a stable growth phase simultaneously, and then slowly increasing in fluctuations until the end of the simulation. This is because the improvement of convenience can be perceived by residents in a short period of time, and prompted some residents who did not classify waste for fear of trouble to change their behavior. After residents get used to the new model, it is difficult for residents who have not made behavior changes to make changes without other further measures. Fortunately, the classification behavior of residents who have shifted to waste classification tends to persist due to the increased convenience. This phenomenon is also reflected in the . In the first 1/3 period of simulation, the gap between the two curves increases gradually. In the 2/3 period after simulation, although the two curves are still fluctuating, the difference between them can be maintained at about 0.1 at the same time. Improving the convenience of classification has a stable promoting effect on waste classification, and the final classification rate of residents can be increased to 0.62. According to Formula 2, increasing the government’s propaganda and education from 1 to 2 is equivalent to increasing the convenience of classification from 0.5 to 1. Therefore, it can be reasonably speculated that the promotion of awareness-raising activities will also have a positive impact on residents’ waste classification.
Figure 5. Resident classification participation rate under different scenarios.
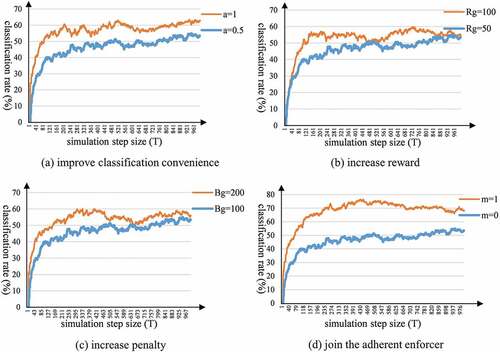
Convenient classification methods can reduce the time and energy of residents classifying waste, and improve willingness to classify waste. Due to the objectivity of environmental changes, the classification effect is persistent and stable. Similarly, residents who lack the knowledge of waste classification will spend a lot of time and energy in waste classification, increasing the cost of waste classification.
Experiment 2: the impact of reward on residents’ behavior
Keep other parameters unchanged, double the Rg from 50 to 100. The evolution results of the resident classification rate over time are shown in . At the beginning of the simulation, compared with the simulation results of the initial conditions, the two curves are highly coincident. That’s probably because reward policies that differ from improvements in the convenience of facilities can be perceived by all residents within a short period of time. In the early implementation of the incentive policy, most residents are still on the side-lines. Residents’ perception of the policy is mainly through the change of external effects after the early waste classification participants have been rewarded. And after multiple rounds of interaction between residents, the economic incentive effect is revealed. After the resident classification rate reaches 0.3, the difference between the two curves appears, and the increased reward makes more residents participate in waste classification. In the middle of the simulation, the two curves intersect and overlap, and then the incentive effect of increasing the reward appears again, and the resident waste classification rate increases to the maximum in the whole simulation cycle. At the end of the simulation, the gap between the two curves continues to narrow and intersect again, showing the same convergence trend.
Increasing rewards improves the income of residents’ waste classification and promotes income-driven residents to classify waste. However, the incentive effect of increasing the reward is not stable enough, and the follow-up motivation is insufficient. Residents’ willingness to classify needs to be further improved.
Experiment 3: the impact of penalty on residents’ behavior
When other parameters remain unchanged and the Bg is doubled from 100 to 200, the evolution result of resident classification rate over time is shown in . In the early period of simulation, the result curve after increasing the penalty is above the initial curve, and the difference between the two curves at the same moment is around 0.1, which reflects the role of increasing penalty in promoting residents’ participation in waste classification. During the mid-simulation period, the curve fluctuates considerably after adding penalties, fluctuating back and forth in the range of 0.5–0.6. In the second half of the simulation, the difference between the two curves at the same moment does not exceed 0.1, and at some moments the two curves are infinitely close or even intersect. The incentive effect of penalty is weaker than in the previous period. The two curves eventually have the same convergence trend.
Similar to improving the incentive effect, increasing penalties can accelerate the pace of residents’ waste classification, realizing the rapid growth of the number of residents participating in waste classification in a short period of time. But with further evolution, it fails to drive more residents to participate in waste classification. In the later period of the simulation, the residents’ participation rate in waste classification fluctuates significantly. Behind this result, the impact of inadequate supervision and random penalties cannot be ignored. Based on the current situation in China, the government is difficult to supervise residents in all aspects. Unable to detect and penalize all residents who do not classify their waste, causing some residents to have a fluke mentality. So, some residents do not carry out waste classification but have not low income. When residents exchange information, such “unclassified high-income” residents will become the object of imitation by other residents, which in turn affects the decisions of some residents.
Experiment 4: the impact of adherent enforcer on residents’ behavior
Add adherent enforcers in the initial model, who will insist on waste classification regardless of the choices of other residents. The specific model rules are: all residents are given the attribute of the degree of enforcement, which is generated randomly and obeys normal distribution. When the degree of enforcement is greater than 1, the residents will become adherent enforcers. When there are adherent enforcers among residents, the evolution result of resident classification rate over time is shown in . Compared with the initial curve, the trend of the two curves is basically consistent, and the difference between the two curves is significant. The difference can be as high as 0.3 at any one time. At the end of the simulation, the difference between the two curves remains above 0.1, and the promotion effect is obvious and persistent. When there are adherent enforcers among the residents, the highest classification rate of residents reaches 0.75, and the final classification rate stabilizes at around 0.7, which is a significant improvement from the initial state.
Unlike both the one-time effect of classification convenience enhancement and the probability problem of supervision penalties, adherent enforcers exist throughout the simulation cycle, and the classification behavior of the adherent enforcers makes their fame and wealth continue to grow positively. The probability of obtaining high income from waste classification in neighbors increases, which drives more “rational” residents to carry out waste classification. Adherent enforcers continue to forcefully guide and promote the establishment of residents’ classification awareness and the cultivation of classification habits. It embodies the “role model effect” that exemplary people bring.
Conclusion and recommendations
Conclusion
MDW seriously restricts the survival and development of cities, and waste management has become a problem that plagues government managers in various countries. In view of the increasingly severe MDW crisis, the repeatedly blocked promotion of waste classification and the depressed enthusiasm of residents for waste classification, based on the quasi-public goods attribute of waste classification, this paper divides residents into fame and income-driven types from the hypothesis of rational behavior. Through multi-agent modeling, the interaction and decision-making of urban residents in the process of waste classification are simulated, and introduce GIS to truly restore the daily classification scenes of residents. Explore the dynamic evolution of urban residents’ classification behavior and the change of residents’ waste classification rate under different situations. The main conclusions of this study are as follows:
The convenience of waste classification knowledge behavior transformation helps improve the occurrence probability of waste classification behavior.
The sustainability of reward is not strong, and the multi-level marginal effect is obviously diminishing.
The short-term effect of penalty is obvious, but the medium and long term effects tend to solidify or degrade.
The guiding role of adherent enforcers is strong and sustainable, which is conducive to cultivating the group consciousness of waste classification.
The results show that different factors have different effects on promoting residents’ waste classification behavior, including strength and duration. The government and the community can use this as a reference to formulate flexible and effective classification policies. Improve residents’ awareness of waste classification and stimulate residents’ enthusiasm for waste classification.
Recommendations
Deeply expand the residential waste classification application platform to ensure that classification technical support is “always online”.
Combine various residential life apps or mini programs to vigorously develop a commercial waste classification platform, embedding the guidelines into various applications, giving residents sufficient classification guidance anytime and anywhere, and create a high-quality waste classification service platform.
(2) Efforts to create the integration of urban sanitation system and renewable resources system, and build the “reverse growth” of the waste classification market.
Government departments should shoulder the responsibility of “management subject” and increase policy encouragement and support. Build a large information cooperation platform dominated by the government, with extensive participation of enterprises, social organizations and the public and guide the market players and social forces in the recycling of renewable resources into the field of waste classification.
(3) Strive to build a community waste classification grid and promote the long-term development of reward and penalty mechanisms.
Relying on the community grid micro-governance system, integrate the waste classification work into the community grid work, and realize the refinement, full coverage and normalization of waste classification management. Establish “personal electronic archives” for residents’ waste classification, master the dynamics of residents’ waste classification at any time, and realize all-round and three-dimensional dynamic management.
Acknowledgments
The authors would like to thank Jiajia Xia, Tianyu Wan for their helpful suggestions and technology support.
Disclosure statement
No potential conflict of interest was reported by the author(s).
Data availability statement
The data used to support the findings of this study are available from the corresponding author, Xingxing Liu, upon reasonable request.
Additional information
Funding
Notes on contributors
Qing Yang
Qing Yang is a leading professor in the discipline of Technology Economics and Management at Wuhan University of Technology, where he has been engaged in crisis management complex system, decision support system, risk analysis and policy evaluation, etc.
Mengyuan Luo
Mengyuan Luo is a master student at the School of Safety Science and Emergency Management of Wuhan University of Technology. Her research direction is intelligent management of complex systems.
Xingxing Liu
Xingxing Liu is an associate professor in Wuhan University of Technology. His current research interests include computational experiments, space analysis and safety science.
References
- Abdelradi, F. 2018. Food waste behaviour at the household level: A conceptual framework. Waste Manage. 71:485–493. doi:10.1016/j.wasman.2017.10.001.
- Babaei, A. A., N. Alavi, G. Goudarzi, P. Teymouri, K. Ahmadi, and M. Rafiee. 2015. Household recycling knowledge, attitudes and practices towards solid waste management. Resour. Conserv. Recycl. 102:94–100. doi:10.1016/j.resconrec.2015.06.014.
- Camerer, C. F., and E. Fehr. 2006. When does “Economic Man” dominate social behavior? Science 311 (5757):47–52. doi:10.1126/science.1110600.
- Castro, B. M., Y. D. A. D. Melo, N. F. D. Santos, B. Aldc, R. C. Noya, and R. M. Salles. 2021. Multi-agent simulation model for the evaluation of COVID-19 transmission[J]. Comput. Biol. Med. 136:104645. doi:10.1016/j.compbiomed.2021.104645.
- Chen, L. Q., and M. Gao. 2021. Novel information interaction rule for municipal household waste classification behavior based on an evolving scale-free network. Resour. Conserv. Recycl. 168 (12):105445. doi:10.1016/j.resconrec.2021.105445.
- Chen, F., X. X. Li, J. Ma, Y. J. Yang, and G. J. Liu. 2018. An exploration of the impacts of compulsory source-separated policy in improving household solid waste-sorting in pilot megacities, China: A case study of Nanjing. Sustainability 10 (5):1327–1327. doi:10.3390/su10051327.
- Cong, X. H., L. Wang, L. Ma, and M. Skibnewski. 2021. Exploring critical influencing factors for the site selection failure of waste-to-energy projects in China caused by the “not in my back yard” effect. Eng. Constr. Archit. Manage. 28 (6):1561–1592. doi:10.1108/ECAM-12-2019-0709.
- Cui, T. N., X. B. Su, and Y. J. Zhang. 2021. Study on compulsory classification management and behavior synergy of municipal solid waste. Sustainability 13 (11):6265. doi:10.3390/su13116265.
- Domina, T., and K. Koch. 2022. Convenience and frequency of recycling. Environ. Behav. 34 (2):216–38. doi:10.1177/0013916502034002004.
- Ehsan, H. 2021. Multi-agent machine learning in self-organizing systems. Inf. Sci. 581:194–214. doi:10.1016/j.ins.2021.09.013.
- Gu, W., D. Liu, and C. Wang. 2021. Energy recovery potential from incineration using municipal solid waste based on multi-scenario analysis in Beijing. Environ. Sci. Pollut. Res. 28 (21):27119–27131. doi:10.1007/s11356-021-12478-9.
- Guo, S., and L. Chen. 2022. Why is China struggling with waste classification? A stakeholder theory perspective. Resour. Conserv. Recycl. 183:106312. doi:10.1016/j.resconrec.2022.106312.
- Guo, H., X. Nie, T. Shu, X. Li, and B. Bai. 2021. Global warming potential of typical rural crisis waste treatment modes in China: A case study in Ankang. Environ. Sci. Pollut. Res. 28 (34):47149–47161. doi:10.1007/s11356-021-13983-7.
- He, J. X., and B. Q. Lin. 2019. Assessment of waste incineration power with considerations of subsidies and emissions in China. Energy Policy 126 (1):190–199. doi:10.1016/j.enpol.2018.11.025.
- Ibranhim, M. H., and S. H. Law. 2014. Social capital and Co2 emission—output relations: A panel analysis. Renewable Sustainable Energy Rev. 29 (7):528–534. doi:10.1016/j.rser.2013.08.076.
- Kang, P., G. H. Song, M. Xu, R. Miller Travis, H. K. Wang, H. Zhang, G. Liu, Y. Zhou, J. S. Ren, R. Y. Zhong, et al. 2021. Low-carbon pathways for the booming express delivery sector in China. Nat. Commun. 12 (1):450. doi:10.1038/s41467-020-20738-4.
- Kaza, S., L. Yao, P. Bhada-Tata, and F. Van Woerden. 2018. What a waste 2.0: A global snapshot of solid waste management to 2050. World Bank Publications.
- Li, K. L. 2021. Analysis and suggestions on classification and recycling of urban domestic waste. IOP Conf. Ser. 647 (1):012177. doi:10.1088/1755-1315/647/1/012177.
- Li, X. R., F. Bi, Z. D. Han, Y. Qin, H. S. Wang, and W. X. Wu. 2019. Garbage source classification performance, impact factor, and management strategy in rural areas of China: A case study in Hangzhou. Waste Manage. 89:313–321. doi:10.1016/j.wasman.2019.04.020.
- Li, Z., Q. Deng, J. Bai, Y. Li, Y. Wang, N. Liu, and Y. Gong. 2022. Management system for engineering and decoration waste: An exploratory study in Shenzhen. J. Environ. Manage. 314:115085. doi:10.1016/j.jenvman.2022.115085.
- Lu, H. M., and R. Sidortsov. 2019. Sorting out a problem: A co-production approach to household waste management in Shanghai, China. Waste Manage. 95:271–277. doi:10.1016/j.wasman.2019.06.020.
- Lü, X., D. Wu, X. Sue, X. Wang, and J. Cheng. 2018. From rational man to behavioral man: The behavioral turn of public policy. Adv. Psychol. Sci. 26 (12):2249. doi:10.3724/sp.j.1042.2018.02249.
- Ma, Y., M. A. Koondhar, S. K. Liu, H. L. Wang, and R. Kong. 2020. Perceived value influencing the household waste sorting behaviors in rural China. Int. J. Environ. Res. Public Health 17 (17):6093. doi:10.3390/ijerph17176093.
- Maria, J., D. A. Combariza Bayona, and K. Sripada. 2021. Mercury exposure among E-waste recycling workers in Colombia: Perceptions of safety, risk, and access to health information. Int. J. Environ. Res. Public Health 18 (17):9295. doi:10.3390/ijerph18179295.
- Meng, X. Y., X. C. Tan, Y. Wang, Z. G. Wen, Y. Tao, and Y. Qian. 2019. Investigation on decision-making mechanism of residents’ household solid waste classification and recycling behaviors. Resour. Conserv. Recycl. 140:224–234. doi:10.1016/j.resconrec.2018.09.021.
- Miafodzyeva, S., and N. Brandt. 2013. Recycling behaviour among householders: Synthesizing determinants via a meta-analysis. Waste Biomass Valorization 4 (2):221–235. doi:10.1007/s12649-012-9144-4.
- Na, H. S., and A. Banerjee. 2019. Agent-based discrete-event simulation model for no-notice natural disaster evacuation planning. Comput. Ind. Eng. 129:44–55. doi:10.1016/j.cie.2019.01.022.
- Nguyen, T. T. P., D. J. Zhu, and N. P. Le. 2015. Factors influencing waste separation intention of residential households in a developing country: Evidence from Hanoi. Vietnam Habitat Int. 48 (8):169–76. doi:10.1016/j.habitatint.2015.03.013.
- Nie, Y. Y., Y. J. Wu, J. B. Zhao, J. Zha, X. J. Chen, T. Maraseni, and G. R. Qian. 2018. Is the finer the better for municipal solid waste (MSW) classification in view of recyclable constituents? A comprehensive social, economic and environmental analysis. Waste Manage. 79:472–480. doi:10.1016/j.wasman.2018.08.016.
- Park, J., and S. Ha. 2014. Understanding consumer recycling behavior: Combining the theory of planned behavior and the norm activation model. Fam. Consum. Sci. Res. J. 42 (3):278–291. doi:10.1111/fcsr.12061.
- Peng, H., N. Shen, H. Q. Ying, and Q. W. Wang. 2021. Factor analysis and policy simulation of domestic waste classification behavior based on a multiagent study—Taking Shanghai’s garbage classification as an example. Environ. Impact. Assess. Rev. 89:106598. doi:10.1016/j.eiar.2021.106598.
- Qiao, M. M., and S. Y. Hua. 2021. On the problems and countermeasures of source classification management of municipal solid waste by local governments. IOP Conf. Ser. Earth Environ. Sci. 687 (1):012168. doi:10.1088/1755-1315/687/1/012168.
- Rafia, A., H. Keisuke, and H. K. Kiyo. 2009. Willingness to pay for waste management improvement in Dhaka city, Bangladesh. J. Environ. Manage. 90 (1):492–503. doi:10.1016/j.jenvman.2007.12.012.
- Rano, P. 2020. Digital economy: Features and development trends. ACADEMICIA 10 (2):197–202. doi:10.5958/2249-7137.2020.00032.4.
- Research Group of the Development Research Center of the State Council. 2019. Survey on China’s People’s Livelihood. Beijing: China Development Press.
- Shamshad, K., A. Raheel, R. S. Turab, A. B. Nazir, and I. Muhammad. 2021. Technologies for municipal solid waste management: Current status, challenges, and future perspectives. Chemosphere 288 (P1):132403. doi:10.1016/j.chemosphere.2021.132403.
- Sukholthaman, P., and A. Sharp. 2016. A system dynamics model to evaluate effects of source separation of municipal solid waste management: A case of Bangkok, Thailand. Waste Manage. 52:50–61. doi:10.1016/j.wasman.2016.03.026.
- Sun, H., L. L. Hu, W. C. Shou, and J. Wang. 2021. Self-organized crowd dynamics: Research on earthquake emergency response patterns of drill-trained individuals based on GIS and multi-agent systems methodology[J]. Sensors 21 (4):1353. doi:10.3390/s21041353.
- Wan, M., T. Qu, M. N. Huang, L. H. Li, and G. Q. Huang. 2020. Cloud-based product-service systems platform for household solid waste classification management. IET Collab. Intell. Manuf. 2 (2):66–73. doi:10.1049/iet-cim.2019.0062.
- Wan, C., G. Q. Shen, and A. Yu. 2015. Key determinants of willingness to support policy measures on recycling: A case study in Hong Kong. Environ. Sci. Policy 54:409–418. doi:10.1016/j.envsci.2015.06.023.
- Wang, M. X., Z. Li, L. Chen, P. Liu, R. Zhang, W. Liu, Y. Ma, Y. J. Wang, and X. Li. 2020. Energy conservation and carbon reduction potential for solid waste in China. Environ. Sci. Pollut. Res 27 (33):42158–42167. doi:10.1007/s11356-020-10571-z.
- Wang, W. J., and X. Y. You. 2020. Benefits analysis of classification of municipal solid waste based on system dynamics. J. Clean. Prod. 279 (5–8):123686. doi:10.1016/j.jclepro.2020.123686.
- Wei, X. X., L. Shen, Z. Liu, L. Luo, and Y. Chen. 2020. Comparative analysis on the evolution of ecological carrying capacity between provinces during urbanization process in China. Ecol. Indic. 112:106179. doi:10.1016/j.ecolind.2020.106179.
- Wen, X. F., Q. M. Luo, H. L. Hu, N. Wang, Y. Chen, J. Jin, Y. L. Hao, G. Y. Xu, F. M. Li, and W. J. Fang. 2014. Comparison research on waste classification between China and the EU, Japan, and the USA. J. Mater. Cycles Waste Manage. 16 (2):321–334. doi:10.1007/s10163-013-0190-1.
- Yan, M., P. Agamuthu, and J. Waluyo. 2020. Challenges for sustainable development of waste to energy in developing countries. Waste Manag. Res. 38 (3):229–231. doi:10.1177/0734242X20903564.
- Yang, Q., L. He, X. X. Liu, and M. Y. Cheng. 2018. Bayesian-based conflict conversion path discovery for waste management policy implementation in China. Int. J. Conflict Manage. 29 (3):347–375. doi:10.1108/IJCMA-09-2017-0109.
- Yang, Q., J. M. Wang, X. X. Liu, and J. J. Xia. 2020b. MAS-based interaction simulation within asymmetric information on emergency management of urban rainstorm disaster. Complexity 2020 (2):1–13. doi:10.1155/2020/1759370.
- Yang, B. X., C. Zhang, S. Y. Qi, Y. X. Luo, Y. F. Luo, and Y. D. Wang (2020a) Evaluation model of residents’ waste classification participation degree based on investigation in Changzhi city. IOP Conf. Ser. Earth Environ. Sci. 450:012062. doi:10.1088/1755-1315/450/1/012062.
- Yang, Q., C. Zuo, X. X. Liu, Z. C. Yang, and H. Zhou. 2020c. Risk response for municipal solid waste crisis using ontology-based reasoning. Int. J. Environ. Res. Public Health 17 (9):3312. doi:10.3390/ijerph17093312.
- Zhang, S. L., D. Y. Hu, T. Lin, W. Li, R. Zhao, H. W. Yang, Y. B. Pei, and L. Jiang. 2021. Determinants affecting residents’ waste classification intention and behavior: A study based on TPB and A-B-C methodology. J. Environ. Manage. 290:112591. doi:10.1016/j.jenvman.2021.112591.
- Zhang, D. L., G. Q. Huang, X. L. Yin, and Q. H. Gong. 2015. Residents’ waste separation behaviors at the source: Using SEM with the theory of planned behavior in Guangzhou, China. Int. J. Environ. Res. Public Health 12 (8):9475–9491. doi:10.3390/ijerph120809475.
- Zhang, B., K. H. Lai, B. Wang, and Z. H. Wang. 2018. From intention to action: How do personal attitudes, facilities accessibility, and government stimulus matter for household waste sorting? J. Environ. Manage. 233:447–458. doi:10.1016/j.jenvman.2018.12.059.
- Zhang, L. P., and Z. H. Zhang. 2016. Source classification of municipal domestic waste: The dilemma of collective action of residents and its overcoming. Wuhan Univ. J. (Philos. Social Sci.) 69 (6):50–56. In Chinese. doi:10.14086/j.cnki.wujss.2016.06.005.