
 ?Mathematical formulae have been encoded as MathML and are displayed in this HTML version using MathJax in order to improve their display. Uncheck the box to turn MathJax off. This feature requires Javascript. Click on a formula to zoom.
ABSTRACT
Aiming at the challenge of bad odors emanating from rotting perishable kitchen waste in summer within the garbage collection chain, the fan-pad system, which is widely used in agricultural facility systems, was applied to the design of community bins. In this regard, a community bin based on a fan-pad operating mechanism was developed. Computational fluid dynamics (CFD) was then used to numerically analyze the cooling effect of the community bin. Under conditions comprising of an outdoor temperature of 35 °C, an installation height of the wet curtain of the cooling system h1, an installation height of the fan h2, and varying distance d between the trash can and the wet curtain, and the average temperature T of 16 temperature measurement points was analyzed. Design-Expert software was used to design the Box-Behnken Design (BBD) experiment, and regression analysis was carried out. Under the optimized parameter combination, the average temperature T of the temperature measurement point was 24.82 °C by simulation. Through field test verification, it was established that the maximum relative error between the temperature of each measuring point and the simulation result was 1.54%, and the average temperature T fluctuated within the range of 0.5 °C of the simulation value.
Implications Statement: By creatively integrating the agricultural apparatus with our daily community bin, our research presents great interdisciplinary originality and potential in wide application. Meanwhile, our research also gives a new solution to saving the energy wasted by community dust room based on air conditioner cooling. We hold the believe that our research can arrest great attention of scholars, managers, and people interested in sanitation apparatus. Additionally, our research also provides more theoretical and technical support for the design and application of sanitation collecting apparatus
Introduction
Owing to improvement of people’s disposable income, the output of kitchen waste has increased in recent years, accounting for more than half of domestic waste (FAO Citation2018; Guo et al. Citation2019; Li et al. Citation2016; Luo and Wong Citation2019; Ma and Liu Citation2019). Kitchen waste has a complex composition comprising of proteins, fats, carbohydrates, and inorganic salts (Sindhu et al. Citation2019). Therefore, it is easy to rot and produce odors, especially in the high-temperature conditions occurring during summer. According to the odor-producing mechanism of kitchen waste (Huang et al. Citation2016; Technical specifications for food waste treatment Citation2012), the rancidification rate of kitchen waste is slow in a short period of time when the temperature is around 25°C, and fermentation leading to formation of odors is abstract (He et al. Citation2012; Xiaojie et al. Citation2019; Zhao et al. Citation2011). The main mode of collection of kitchen waste consists of several households in a community placing their kitchen waste at a designated community bin after which it is transported to the waste disposal site regularly (Bi, Tai, and Xu Citation2016; Yang et al. Citation2015). Therefore, designing a community cooling bin is of great significance to improving the living environment.
The fan-pad cooling system mainly comprises of a wet curtain device, a ventilation device, and a water circulation device. The working principle is such that the water flow soaks the wet curtain, and the fan draws out air to form indoor negative pressure, after which the water on the wet curtain evaporates and absorbs heat to achieve the cooling effect (Martínez et al. Citation2016; Sethi and Sharma Citation2007). The fan-pad system has a simple structure and relatively low cost and is widely used in China’s agriculture sector (Banik and Ganguly Citation2017; Chalill, Chowdhury, and Karthikeyan Citation2021; Xu et al. Citation2021). At the same time, numerical simulation based on computational fluid dynamics (CFD), which is an effective method to study changes in flow field, is widely used in simulation research for greenhouse environments (Chen et al. Citation2015; Franco et al. Citation2011; He et al. Citation2018; Kim et al. Citation2017; Norton et al. Citation2007). There have been a lot of research reports on the application of fan-pad system in greenhouse and construction and other related fields (Ahmadi Babadi, Khorasanizadeh, and Aghaei Citation2022; Bjerg et al. Citation2002; Blanes-Vidal et al. Citation2008; Curi et al. Citation2017; Fang, Yao, and Lei Citation2019; Liu, Wang, and Zhang Citation2013; Norton et al. Citation2010; Porras-Amores et al. Citation2019; Reichrath and Davies Citation2002) Dimitris et al. (Citation2018) used CFD to simulate the ventilation effect of chicken coop under different environmental conditions and determined the optimal environmental level for broiler growth. Seo et al. (Citation2012) used CFD to simulate the distribution of air flow field and temperature field in the pigpen, and analyzed that reducing the inlet area could improve the uniformity of the flow field in the pigpen. Bartzanas et al. (Citation2007) used CFD to conduct indoor ventilation research on four different turbulence models, and confirmed the importance of the choice of the closure model for turbulence modeling.
CFD has been used to numerically calculate and optimize the temperature field of greenhouses based on the fan-pad system (Fu et al. Citation2020; Huang and Zhao Citation2013). However, there is limited research on temperature fields for small spaces such as community bins. In this study, a community bin was designed, and a fan-pad cooling system was installed in the community bin to realize the normal temperature storage of kitchen waste. The purpose of this paper was to apply the fan-pad system in the agricultural field to the environmental field to cool the community bin. CFD simulation method was used to optimize the design parameters, and community bins were fabricated and field experimental data was collected for verification. To the best of our knowledge, it is the first time that evaporative cooling technology has been used in a community bin.
Materials and methods
External structure
An ordinary 240 L trash can was placed inside the community bin. The community bin consisted of a trash discharge port and trash can entrance, which were normally closed under non-working conditions. The entrance of the trash can was a manual door, which enabled sanitation workers to push the trash can in and out of the community bin. A fan-pad system was installed on the side of the community bin, one side of which was a wet curtain device, and the other side was a ventilation device. The trash can could block the flow of air, so the fan-pad system was placed behind the trash can side. Air flowing from the back of the trash can caused evaporation of water contained in the wet curtain, thereby reducing the average temperature difference in the community bin. The air flow direction is shown in . The fan used electricity to realize the function of discharging the air contained in the community bin.
Figure 1. Schematic diagram of air flow direction.
Going by the number of people in the residential quarters of Pukou District, Nanjing, the daily output of kitchen waste was calculated, and a community bin was designed for ordinary residential communities. Considering conditions such as floor space and actual capacity, three types of community bins with different volumes were designed. is a schematic diagram showing the shape and structure of the community bin, which could hold one, two, and three 240 L trash cans respectively. The community bin used stainless steel as the skeleton material, and the inner surface was coated with thermal insulation coating. The fan-pad system was installed on the left and right sides of the community bin. The manual door on the front of the community bin served as the entrance of the trash can, and the garbage discharge port was an automatic reset movable door panel. The dimensions of the community bins and fan-pad systems for the three options are shown in .
Figure 2. Schematic diagram of community bins structure.
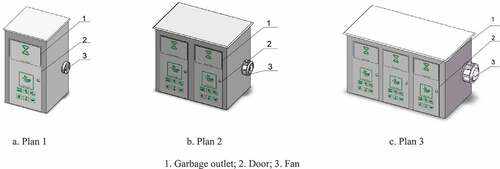
Table 1. Size of community bins and fan-pad systems.
Parameter calculation
The fan-pad system has been widely used in the agriculture sector and has had corresponding design standards developed. The cooling requirement of the community bin was different from that of the greenhouse, but the cooling principle was the same. Therefore, referring to the Chinese national standard NY/T 2133–2012 (Citation2012), the parameterized design of the community bin was completed. The calculation process is as follows:
(1) Cooling load of community bin
– Cooling load of community bin, W;
– Instantaneous heat transfer into the community bin through the enclosure structure, W;
– Solar radiant heat that entered the community bin instantaneously, W;
(2) The air intake of the fan-pad device
– The air intake of the fan-pad system, m3/h;
– Heat capacity at constant pressure of air quality discharged from community bin, [J/(kg•°C)]. Possible value (Citation2012) is 1030 J/(kg•°C);
– The density of air discharged from the community bin, kg/m3. Possible value (Citation2012) is 1.2 kg/m3.
– The temperature of the air discharged from the community bin, °C.
– The temperature of the air entering the community bin, °C.
(3) System exhaust volume of wet curtain
– The exhaust air volume of the fan-pad device, m3/h.
– The amount of air infiltrated through the enclosure, m3/. It was estimated to be 5% to 10% of the air intake of the fan-pad.
(4) Flow area of the wet curtain
– Flow area of the wet curtain, m2.
– Curtain wind speed, m/s. The recommended wind speed passing through the 100 mm thick wet curtain was 1.25 m/s.
According to meteorological data, the average summer temperature in Nanjing was close to 30°C (Miao, Pan, and Xu Citation2008), and the temperature fluctuates around 35°C for 10–20 days (Sun, Pu, and Zhang Citation2010). Therefore, in order to ensure the practicability of the trash can, the cooling system parameters of the three schemes were calculated under the condition of 35°C. The calculation results were shown in .
Table 2. Cooling system parameters of community bins.
Solution optimization
The cooling of the fan-pad system mainly relied on the evaporation of water to absorb heat, so it was necessary to consider the water consumption, the distance from which residents drop garbage, and the manufacturing cost of the community bin.
The calculation formula of the evaporation water volume of the wet curtain was as follows:
– Internal air density,
=353/(273+ Tin), kg/m3;
– External moisture content per kilogram of dry air, kg/kg;
– The moisture content per kilogram of dry air after passing through the wet curtain, kg/kg;
– Ventilation, m3/h.
According to the requirements of the Chinese national standard CJJ/T 102–2004 (Citation2004), the configuration of the garbage containers in the residential quarters needs to meet this standard. The daily discharge of domestic garbage and the number of community bins was calculated as shown in EquationEq. 2–6(2-6)
(2-6) (Citation2004):
– The number of trash cans that should be configured;
– The number of people living in the collection area;
– Amount of garbage discharged per capita per day, t/person
d;
– Coefficient of variation in the amount of waste discharged per person per day,
=1.1 ~ 1.5;
– Coefficient of change of resident population,
=1.02 ~ 1.05;
– Average density of garbage, t/m3;
– Coefficient of variation of average garbage density,
=0.7 ~ 0.9;
– Garbage removal cycle, d/time;
– Volume of a single trash can, m3/pair. The 240 L trash can was selected for this calculation;
B – Fill factor of trash can, B = 0.75 ~ 0.9.
According to data (An et al. Citation2014; Luo, Kaur, and Wong Citation2019; Zhou et al. Citation2020), the average daily output of domestic waste was about 1.2 kg/person, of which kitchen waste accounted for more than 50%. Considering an average household size of 3 persons/household, the amount of kitchen waste stored in the community bin schemes was calculated. The residential quarters selected had 6, 10, and 18 floors. Going by the formula shown in EquationEqs. (2(2-2)
(2-2) –Equation6
(2-6)
(2-6) ), the configuration plan of the Chinese community bins in the residential quarters was obtained, as shown in .
Table 3. Disposition scheme of community bins in residential area.
According to EquationEq. (2(2-2)
(2-2) –Equation5
(2-5)
(2-5) ), under similar temperature and relative humidity conditions, the moisture evaporation of the fan-pad system was observed to be directly proportional to the ventilation. The ratio of cost and water consumption of the three plans of community bins were analyzed as shown in . The evaporated water consumption ratio for plans 1,2, and 3 was 1:4:7, respectively, such that the evaporation water consumption of plan 3 was higher than that of plan 1 and plan 2. The surface area ratio of community bin for plan 1, 2, and 3 was 1:1.78:2.66, respectively. The surface area per unit volume of plan 1 was larger than that of plan 2 and plan 3. The number of community bins was calculated considering data presented in . Plan 1 was densely distributed and did not meet the garbage container setting standards. It was finally determined from comprehensive analysis of the pros and cons of the plan that plan 2 was the best suited for this study, and hence was used to carry out simulation optimization and experimental exploration.
Table 4. The ratio of cost and water consumption of the three plans of community bins.
CFD simulation design
Simulation model
The cooling mechanism of the fan-pad system consisted mainly of ventilation, whereby the trash can would block the airflow. Therefore, the simplification of the simulation model did not consider the placement of garbage in the trash cans. It can be simplified as a whole according to the shape of the trash can. Since the volume difference between the fan-pad system and the community bin could not be ignored, the simulation model retained the thickness of the wet curtain wall and the fan.
Boundary conditions
The cooling mode of the fan-pad system was mechanical-forced ventilation, which comprised of an incompressible fluid. The CFD model adopted the turbulence model of the standard k-ε. The fluid medium was air, the boundary conditions were set for the fan as a speed outlet (outlet), the wet curtain as a pressure inlet (inlet), and the top and surroundings were walls (wall). The specific parameter settings are shown in .
Table 5. Simulation parameters table.
Simulation test design
Taking community bin plan 2 as the research object, an ANSYS-Fluent fluid simulation module was used to simulate the cooling effect of the community bin, and the simulation results of the steady-state temperature field were analyzed. According to the working principle of the fan-pad system, the layout of the system affected the cooling. Due to difference in the density of hot and cold air, the installation height of the wet curtain and the fan affected the airflow direction. In addition, the trash can blocked the airflow movement, so that the distance between the trash can and the wet curtain also affected the cooling effect. In the case of the same external environmental conditions, three relevant factors of the community bin were selected as the research objects, and the average temperature T of the temperature measurement point was tested and analyzed. As shown in , the three factors were the installation height of the wet curtain h1 (factor A), the installation height of the ventilator h2 (factor B), and the distance d between the trash can and the wet curtain (factor C).
Figure 3. Schematic diagram of model influencing factors.
In accordance with Chinese national standard CJ∕T 280–2008 (Citation2020), the height of the 240 L trash can was (950 ± 50) mm. Owing to the principle of hot air rising over cooler air as a function of variation in density, the hot air in the trash can circulated upward toward the fan which served as the hot air outlet. In order to prevent the occurrence of turbulent gas flow, the installation height of the wet curtain and the fan needed to consider the height of the community bin and the trash can. Therefore, the installation height of the fan had to be higher than the middle of the trash can. The wet curtain was the inlet of cold air, and its installation height could not be higher than the installation height of the fan. The distances between the wet curtains and the selection range for obtaining the level of simulation test factors are shown in .
Table 6. Test factors and levels.
The study adopted the experimental design method of Design Expert softwareV12 to design the experimental plan. Since the temperature of garbage was difficult to detect directly, the temperature around the trash can was used as the basis for judging the cooling effect. In order to ensure the representativeness of the distribution of temperature measurement points, according to the structural characteristics of the community bin, the temperature measurement points were arranged on each side of the two trash cans with a height of z1 = 0.2 m and z2 = 0.9 m, as shown in . displays the front view of the community bin diagram, while displays the left view. As shown in , temperature measuring points 1–8 were located on the front view surface of the trash can, and temperature measuring points 9–16 were located on the rearview surface of the trash can. The temperature simulation value of the temperature measurement point was obtained by using the post-processing module (CFD-Post).
Figure 4. Distribution of temperature measuring points.
Result analysis
Processing and analysis of temperature measurement point data
The simulation was carried out by changing the three-dimensional simplified model of the community bin, and the average temperature T/°C of the temperature measurement point was taken as the test result. The analysis used the Box-Behnken Design (BBD) module in Design Expert softwareV12 for data processing, variance analysis on the temperature test results, and optimization of test factors. The test results are shown in .
Table 7. Schemes of experimental design.
Using the test plan and test results to perform multiple regression fitting calculations, the mathematical model relationship between the average temperature T/°C of the temperature measurement point and the test factors was:
– Installation height of wet curtain h1/mm;
– Installation height of fan h2/mm;
– Distance between trash can and wet curtain d/mm.
The experimental analysis results could be obtained from the formula shown in EquationEq. (4(2-4)
(2-4) –Equation1
(2-1)
(2-1) ) and the analysis of variance. As shown in , the results of the analysis of variance show that the P value of the average temperature regression model was less than 0.0001, indicating that the model was statistically significant. The analysis of variance table showed that the lack of fit term P > .05 which indicated that the model had a high degree of fit. The correction coefficient of determination R2 was 0.9880 > 0.8000, indicating that the experimental value could be explained by the model. Among them, for the influencing factors of the average temperature, factors A, B, C, AB were extremely significant. Moreover, BC, AC were significant, and the interaction of factors A and B was even more obvious, and this was due to the air flow route having great effect on the fan-pad system.
Table 8. Results of ANOVA.
In order to visually analyzed the influence of the interaction of various factors on the cooling effect, the method of controlling variables was adopted, whereby the value of one of the factors was fixed, and the Design Expert software was used to obtain response surface graphs of the average temperature. The analysis results are shown in .
Figure 5. Response surface diagram of interaction between different factors.
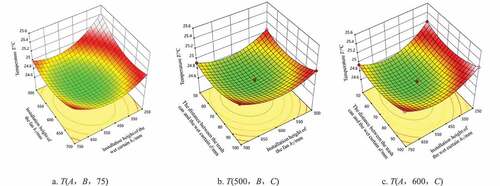
It can be seen from that when the distance d between the trash can and the wet curtain was constant, the average temperature T decreased first and then increased as the installation heights h1 and h2 of the wet curtain and fan increased. When the installation height of these two factors was at the lowest value, the circulation rate of hot air in the trash can was slow, and the temperature T reached the highest. The installation height of the wet curtain had a more obvious influence on the temperature than the installation height of the fan. It can be seen from that when the fan installation height h2 remained unchanged, the average temperature T decreased first and then increased as the distance d between the wet curtain and the trash can increased. It can be seen from that when the installation height h1 of the wet curtain remained unchanged, the average temperature T decreased first and then increased as the distance between the wet curtain and the trash can increased.
The solution module was optimized by using the optimization numerical module of Design Expert software, and the optimal parameter combination for the lowest temperature that satisfied the constraints was: installation height of wet curtain of 541.835 mm, installation height of fan of 605.470 mm, and distance between trash can and wet curtain of 69.206 mm. If the distance d between the wet curtain and the trash can decreased, air circulation would be blocked and the temperature distribution would be uneven. If the distance d between the wet curtain and the trash can increased, the overall temperature would rise. Therefore, the value of d was near the median value. Air convection was better for cooling, so the fan and the wet curtain were installed at similar heights and were both near the median of the factor level. Through the above analysis, it could be concluded that the optimization parameter results were consistent with the change trend of the response surface. The average temperature under this combination was 24.684°C, which met the cooling needs of the kitchen trash can.
Optimal parameter combination test analysis
In order to further verify the reliability of the parameters, the optimal combination parameters were analyzed using simulation experiments. Taking the rounded value of optimal combination parameters, the installation height of the wet curtain h1 was 550 mm, the installation height of the fan h2 was 600 mm, and the distance d between the trash can and the wet curtain was 70 mm. A simulation model was established to analyze the internal temperature of the community bin. According to the simulation results, the temperature distribution and error bars of the temperature measurement points are shown in , where the average temperature was 24.82°C and the highest temperature was 25.12°C. The even-numbered temperature measurement point was located at z1 = 0.2 m, and the odd-numbered temperature measurement points was located at z2 = 0.9 m. Affected by the density of the cold and hot airflow, the temperature presented a high and low distribution state. Temperature measurement points 7, 8, 15, 16 were located on the right side of the trash can ②, which were closing to the fan, and the temperature was relatively high; temperature measurement points 1, 2, 9, and 10 were located on the left side of the trash can ①, which were closing to the wet curtain, and the temperature was lower. The airflow between the two trash cans did not change significantly, so the temperature fluctuation range of temperature measurement points 3–6 and 11–14 was relatively small.
Figure 6. Temperature simulation value and error bar diagram of temperature measuring point.
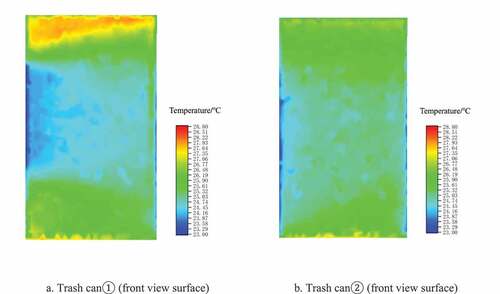
In order to make the simulation results clearer, the temperature distribution cloud map on the surface of the trash can was analyzed. is a cloud diagram of temperature distribution on the front view surface of the trash cans. is the front view surface of trash can①, is the front view surface of trash can②. The air entered through the wet curtain and was exhausted by the ventilator. Due to the effect of the ventilator, the pressure inside the community bin was negative. Therefore, it was obvious from the temperature cloud chart that the temperature of the trash can ① near the wet curtain was relatively low, at about 24°C. The small triangle area near the top of the trash can had uneven temperature due to the low air velocity near the wet curtain. The temperature of the trash can on the right was slightly higher, basically keeping it at 25°C, but the overall temperature distribution was even. Since there was an air flow area between the two trash cans, there was a lower temperature.
Figure 7. Cloud map of temperature distribution on the front view surface of the trash cans.
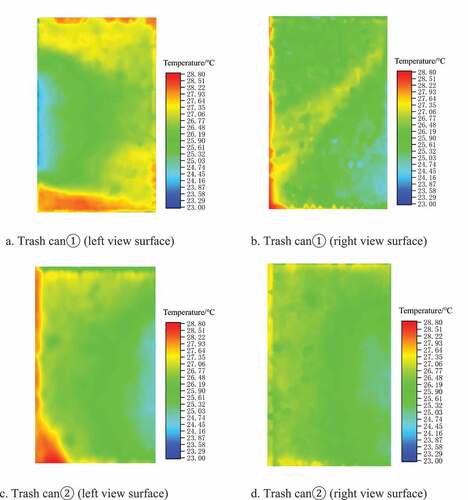
The temperature around the trash can changed as the distance from the air duct changed, so the temperature distribution cloud diagrams of the left and right sides of the two trash cans were analyzed one by one. is the temperature cloud diagram on the left surface of trash can①, is the temperature cloud diagram on the right surface of trash can①, is the temperature cloud diagram on the left surface of trash can②, is the temperature cloud diagram on the right surface of trash can②. The temperature on the left side of the trash can in was slightly higher due to the airflow. The temperature on the right side of the two trash cans in was evenly distributed. The overall cloud map distribution was consistent with the data analysis, and the overall design structure of the community bin met the requirements.
Figure 8. Cloud map of temperature distribution on the side view surface of the trash cans.
Verification test
In order to verify the simulation results of the community bin, the installation heights h1 and h2 of the cooling device wet curtain and fan were adjusted, and the distance d between the trash can and the wet curtain was consistent with the optimized combination parameters. The test model of the kitchen waste bin is shown in . The test site was located in Nanjing Agricultural University. The environment temperature was 35°C, and wind speed was 0.2 m/s, and the humidity was 15%. The cooling system was turned on. After the temperature in the community bin was stable, a handheld thermometer was used to monitor the temperature of each temperature measurement point, repeating the test three times, and the average value was calculated. Among them, the average values of the three tests were 25.18°C, 24.83°C, and 25.21°C, which were kept within the range of 0.5°C of the simulated average temperature. Taking the average value of 16 temperature measurement points in three experiments, according to the temperature distribution and error bar graph 10, the relative error between the measured value and the simulated value was within 2%, and the maximum relative error was 1.54%. The temperature distribution of the temperature measurement points in was consistent with the simulation temperature change trend of the optimized combination in , indicating that the internal temperature distribution of the community bin was closed to the simulation effect and met the cooling requirements.
Figure 9. Test model and setup of community bin.
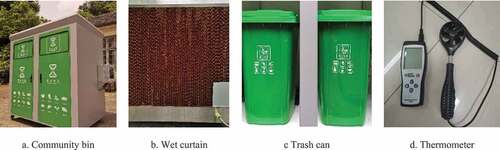
Figure 10. Temperature distribution and error bar diagram of temperature measuring points.
Conclusion
This research proposed a fan-pad cooling community bin, which aimed to slow down the rate of decomposition of kitchen waste in summer and ensure preservation for further utilization. Using computational fluid dynamics CFD to carry out simulation test analysis on the cooling system of the community bin, and after rounding according to the optimal combination of the Design Expert software, the average temperature of the temperature measurement point was 24.82°C. This met the cooling demand, and the internal temperature distribution of the community bin was uniform.
According to the analysis of the field test results, the measured average temperature was within 0.5°C of the simulated value, and the maximum relative error between the measured temperature and the simulated temperature at the measuring point was 1.54%. The cooling effect achieved by this community bin is of great significance to the clean collection and storage of kitchen waste as well as improvement of the living environment.
Disclosure statement
No potential conflict of interest was reported by the author(s).
Data availability statement
The datasets generated during and/or analyzed during the current study are not publicly available due to privacy reasons, but are available from the corresponding author on reasonable request.
Additional information
Funding
Notes on contributors
Xueru Zhu
Xueru Zhu is a post-graduate student, mainly engaged in intelligent research and biomass conversion research.
Hua Li
Hua Li is a professor, doctoral supervisor, mainly engaged in precision planting and harvesting equipment and biomass conversion technology equipment research.
Jufei Wang
Jufei Wang is a post-graduate student, mainly engaged in biomass conversion research.
Samuel Mbugua Nyambura
Samuel Mbugua Nyambura is a post-graduate student, mainly engaged in biomass conversion research.
Jialiang Xu
Jialiang Xu is a post-graduate student, mainly engaged in biomass conversion research.
Bohong Li
Bohong Li is a post-graduate student, mainly engaged in intelligent research.
References
- Ahmadi Babadi, K., H. Khorasanizadeh, and A. Aghaei. 2022. CFD modeling of air flow, humidity, CO2 and NH3 distributions in a caged laying hen house with tunnel ventilation system. Comput. Electron. Agric. 193:106677. doi:10.1016/j.compag.2021.106677.
- An, Y., G. M. Li, W. Q. Wu, J. Huang, W. He, and H. Zhu. 2014. Generation, collection and transportation, disposal and recycling of kitchen waste: A case study in Shanghai [J]. Waste Manage. Res. 32 (3):245⁃248. doi:10.1177/0734242X14521685.
- Banik, P., and A. Ganguly. 2017. Performance and economic analysis of a floricultural greenhouse with distributed fan-pad evaporative cooling coupled with solar desiccation. Sol. Energy 147:439–47. doi:10.1016/j.solener.2017.03.057.
- Bartzanas, T., C. Kittas, A. A. Sapounas, and C. Nikita-Martzopoulou. 2007. Analysis of airflow through experimental rural buildings: Sensitivity to turbulence models[J]. Biosyst. Eng. 97 (2):229–39. doi:10.1016/j.biosystemseng.2007.02.009.
- Bi, Z., J. Tai, and B. Xu. 2016. The current food waste management situation in China[J]. Environ. Eng. 34 (S1):765–68. (in Chinese with English abstract).
- Bjerg, B., K. Svidt, G. Zhang, S. Morsing, and J. O. Johnsen. 2002. Modeling of air inlets in CFD prediction of airflow in ventilated animal houses[J]. Comput. Electron. Agric. 34 (1):223–35. doi:10.1016/S0168-1699(01)00189-2.
- Blanes-Vidal, V., E. Guijarro, S. Balasch, and A. G. Torres. 2008. Application of computational fluid dynamics to the prediction of airflow in a mechanically ventilated commercial poultry building[J]. Biosyst. Eng. 100 (1):105–16. doi:10.1016/j.biosystemseng.2008.02.004.
- Chalill, S. M., S. Chowdhury, and R. Karthikeyan. 2021. Prediction of key crop growth parameters in a commercial greenhouse using CFD simulation and experimental verification in a pilot study. Agriculture 11 (7):658. doi:10.3390/agriculture11070658.
- Chen, J., F. Xu, D. Tan, Z. Shen, L. Zhang, and Q. Ai. 2015. A control method for agricultural greenhouses heating based on computational fluid dynamics and energy prediction model[J]. Appl. Energy 141:106–18. doi:10.1016/j.apenergy.2014.12.026.
- Classification of Municipal Solid Waste and Its Evaluation Standards. 2004. CJJ/T 102-2004[S].
- Curi, T. M. R. D., D. J. D. Moura, J. M. Massari, M. Mesquita, and D. F. Pereira. 2017. Computational dynamics(CFD) application for ventilation studies in broiler houses. Eng. Agríc. 37 (1):1–12. doi:10.1590/1809-4430-eng.agric.v37n1p1-12/2017.
- Dimitris, F., C. Baxevanou, T. Bartzanas, and C. Kittas. 2018. Numerical study of mechanically ventilated broiler house equipped with evaporative pads[J]. Comput. Electron. Agric. 149:101–09. doi:10.1016/j.compag.2017.10.016.
- Fang, Y., Z. Yao, and S. Lei. 2019. Air flow and gas dispersion in the forced ventilation of a road tunnel during construction[J]. Undergr. Space 4 (2):168–79. doi:10.1016/j.undsp.2018.07.002.
- FAO. 2018. FAO world fertilizer trends and outlook to 2018 [EB/OL]. http://www.fao.org/3/a-i4324e.pdf.
- Franco, A., D. L. Valera, A. Peña, and A. M. Pérez. 2011. Aerodynamic analysis and CFD simulation of several cellulose evaporative cooling pads used in Mediterranean greenhouses. Comput. Electron. Agric. 76 (2):218–30. doi:10.1016/j.compag.2011.01.019.
- Fu, P., S. Luo, W. Yang, et al. 2020. CFD simulation optimization of airflow and temperature field in vertically ventilated pig house[J]. Heilongjiang Anim. Sci. Vet. Med. 18 (9):34–38, 160–161. (in Chinese with English abstract).
- Greenhouse fan-pad cooling system design specification. 2012. NY/T 2133-2012[S].
- Guo, H. W., Y. Zhao, A. Damgaar, Q. Wang, W. Lu, H. Wang, and T. H. Christensen. 2019. Material flow analysis of alternative biorefinery systems for managing Chinese food waste [J]. Resour. Conserv. Recl. 149:197⁃209.
- He, M., Y. Sun, D. Zou, H. Yuan, B. Zhu, X. Li, and Y. Pang. 2012. Influence of temperature on hydrolysis acidification of food waste[C]//Tsinghua University, Basel Convention Coordinating Centre for Asia and the Pacific (BCRC in Beijing China), National Center of Solid Waste Management of Ministry of Environmental Protection of China, and Solid Waste Branch of Chinese Society for Environmental Sciences. Seventh International Conference on Waste Management and Technology (ICWMT 7), 85–94.
- He, X., J. Wang, S. Guo, J. Zhang, B. Wei, J. Sun, and S. Shu. 2018. Ventilation optimization of solar greenhouse with removable back walls based on CFD[J]. Comput. Electron. Agric. 149:16–25. doi:10.1016/j.compag.2017.10.001.
- Huang, Q., and Y. Zhao. 2013. A simulation on temperature field and dynamic characters of a forced ventilated greenhouse in summer[J]. J. Agric. Mechanization Res. 35 (1):30–33. (in Chinese with English abstract).
- Huang, X., J. Zhang, F. Wang, W. Z. He, and G. M. Li. 2016. Research progress in resource utilization of kitchen waste and its Process Pollution Control[J]. Chem. Ind. eng. prog. 35 (9):2945–51. (in Chinese with English abstract).
- Kim, R., S.-W. Hong, I.-B. Lee, and K.-S. Kwon. 2017. Evaluation of wind pressure acting on multi-span greenhouses using CFD technique, Part 2: Application of the CFD model. Biosyst. Eng. 164:257–80. doi:10.1016/j.biosystemseng.2017.09.011.
- Li, Y. Y., Y. Y. Jin, J. H. Li, Y. Chen, Y. Gong, Y. Li, and J. Zhang. 2016. Current situation and development of kitchen waste treatment in China [J]. Procedia. Environ. Sci. 31:40⁃49. doi:10.1016/j.proenv.2016.02.006.
- Liu, Z., X. Wang, and A. Zhang. 2013. Construction ventilation scheme optimization of underground main powerhouse based on CFD: Frontiers of green building, materials and civil engineering III, PTS 1-3[Z]. Kao J. C. M., Sung W. P., Chen R. 3rd International Conference on Green Building, Materials and Civil Engineering (GBMCE 2013), Taiwan, China, 368–370, 619–623.
- Luo, L. W., G. Kaur, and J. W. C. Wong. 2019. A mini⁃review on the metabolic pathways of food waste two ⁃ phase anaerobic digestion system [J]. Waste Manage. Res. 37 (4):333⁃346. doi:10.1177/0734242X18819954.
- Luo, L. W., and J. W. C. Wong. 2019. Enhanced food waste degradation in integrated two ⁃ phase anaerobic digestion: Effect of leachate recirculation ratio [J]. Bioresour. Technol 291:121813. doi:10.1016/j.biortech.2019.121813.
- Ma, Y. Q., and Y. Liu. 2019. Turning food waste to energy and resources towards a great environmental and economic sustainability: An innovative integrated biological approach [J]. Biotechnol. Adv. 37 (7):107414. doi:10.1016/j.biotechadv.2019.06.013.
- Martínez, P., J. Ruiz, C. G. Cutillas, P. J. Martínez, A. S. Kaiser, and M. Lucas. 2016. Experimental study on energy performance of a split air-conditioner by using variable thickness evaporative cooling pads coupled to the condenser. Appl. Therm. Eng. 105:1041–50. doi:10.1016/j.applthermaleng.2016.01.067.
- Miao, Q., W. Pan, and X. Xu. 2008. Characteristic analysis of summer themperature in nanjing during 56 years[J]. J. Trop. Meteorol. 24 (6):737–42. (in Chinese with English abstract).
- Ministry of Housing and Urban-Rural Development of the People’s Republic of China. 2020. General technical requirements for plastic trash cans: CJ/T 280-2020[S].
- Norton, T., J. Grant, R. Fallon, and D.-W. Sun. 2010. A computational fluid dynamics study of air mixing in a naturally ventilated livestock building with different porous eave opening conditions[J]. Biosyst. Eng. 106 (2):125–37. doi:10.1016/j.biosystemseng.2010.02.006.
- Norton, T., D.-W. Sun, J. Grant, R. Fallon, and V. Dodd. 2007. Applications of computational fluid dynamics (CFD) in the modelling and design of ventilation systems in the agricultural industry: A review[J]. Bioresour. Technol. 98 (12):2386–414. doi:10.1016/j.biortech.2006.11.025.
- Porras-Amores, C., R. Mazarron Fernando, I. Canas, and P. Villoría Sáez. 2019. Natural ventilation analysis in an underground construction: CFD simulation and experimental validation[J]. Tunn. Undergr. Space Technol. 90:162–73. doi:10.1016/j.tust.2019.04.023.
- Reichrath, S., and T. W. Davies. 2002. Using CFD to model the internal climate of greenhouses: Past, present and future[J]. Agronomie 22 (1):3–19. doi:10.1051/agro:2001006.
- Seo, I.-H., I.-B. Lee, O.-K. Moon, S.-W. Hong, H.-S. Hwang, J. P. Bitog, K.-S. Kwon, Z. Ye, and J.-W. Lee. 2012. Modelling of internal environmental conditions in a full-scale commercial pig house containing animals[J]. Biosyst. Eng. 111 (1):91–106. doi:10.1016/j.biosystemseng.2011.10.012.
- Sethi, V. P., and S. K. Sharma. 2007. Survey of cooling technologies for worldwide agricultural greenhouse applications. Sol. Energy 81 (12):1447–59. doi:10.1016/j.solener.2007.03.004.
- Sindhu, R., E. Gnansounou, S. Rebello, P. Binod, S. Varjani, I. S. Thakur, R. B. Nair, and A. Pandey. 2019. Conversion of food and kitchen waste to value-added products[J]. J. Environ. Manage. 241:619–30. doi:10.1016/j.jenvman.2019.02.053.
- Sun, Y., M. Pu, and B. Zhang. 2010. Analysis of high temperature days anomaly in Nanjing[J]. Sci. Meteorol. Sinica 30 (2):279–84. (in Chinese with English abstract).
- Technical specifications for food waste treatment. 2012. CJJ 184-2012[S].
- Xiaojie, W., P. Zhang, S. Xinyu, Z. H. A. O. Youcai, Y. Zheng, and L. I. U. Changqing. 2019. Effects of temperature and time on the storage characteristics of sludge and food waste[J]. Chin. J. Environ. Eng. 13 (7):1735–42.
- Xu, F., H.-F. Lu, Z. Chen, Z.-C. Guan, Y.-W. Chen, G.-W. Shen, and Z. Jiang. 2021. Selection of a computational fluid dynamics (CFD) model and its application to greenhouse pad-fan cooling (PFC) systems. J. Clean. Prod. 302:127013. doi:10.1016/j.jclepro.2021.127013.
- Yang, X., T. Lin, J. Shi, et al. 2015. A preliminary study on the disposal and utilization of restaurant -kitchen-waste in Shanghai[J]. Shanghai Agric. Sci. Technol. 1:26–27, 38. (in Chinese with English abstract).
- Zhao, S., D. Li, X. Dai, J. Qi, and J. Wang. 2011. The influence of temperature on acid production during anaerobic fermentation of kitchen garbage[J]. Environ. Pollut. Prev. 33 (3):44–47. (in Chinese with English abstract).
- Zhou, J., M. Wang, G. Wang, L. Ma, L. Luo, and J. W. Wong. 2020. Research status and prospect of food waste utilization technology[J]. Biotic Resour. 42 (1):87–96. (in Chinese with English abstract).