
 ?Mathematical formulae have been encoded as MathML and are displayed in this HTML version using MathJax in order to improve their display. Uncheck the box to turn MathJax off. This feature requires Javascript. Click on a formula to zoom.
ABSTRACT
Thermal-optical analysis (TOA) has long been used to quantify organic carbon (OC) and elemental carbon (EC) on quartz-fiber filter samples collected in national ambient air monitoring networks. In the routine analysis of samples from the Chemical Speciation Network (CSN), we observed a considerable fraction of filter punches that remain gray or black in color after TOA was completed, suggesting the presence of EC that was not fully evolved at the highest temperature specified by the IMPROVE_A protocol (840°C). In this work, we explored the operational conditions necessary to evolve and quantify such residual EC. First, four heavily loaded CSN samples were analyzed to evaluate modifications to the IMPROVE_A protocol. We found that adding a higher temperature step at 930°C more effectively evolved the residual EC than did lengthening the duration of the 840°C step. Compared with the standard IMPROVE_A results, the modified protocol evolved additional EC of 1.08 to 4.45 µg cm−2 in mass, or 0.12 to 0.50 µg m−3 in concentration. This excess EC accounts for 27.1% to 45.3% of the total EC and 7.6% to 25.1% of the total carbon by standard IMPROVE_A. We then analyzed over 2600 samples from CSN using the extended IMPROVE_A protocol with higher maximum temperature (930°C). A total of 168 samples (6.4% of the total samples analyzed) contained measurable EC at the 930°C step. The average fraction of the evolvable residual EC mass in total EC is 5.7%, and up to 28% for samples with high total EC mass loading (i.e., 95th percentile and above).
Implications: Our results suggest that CSN EC measured by the standard IMPROVE_A protocol should be considered a lower limit, and that a higher maximum heating temperature can be used to better quantify EC from CSN sites impacted by fresh urban emissions.
Introduction
“Elemental carbon” (EC) and “black carbon” (BC) are ambiguously defined (Bond and Bergstrom Citation2006) but important components of fine particulate matter (PM2.5) that affects public health (Pope and Dockery Citation2006), visibility (Watson Citation2002), as well as the earth’s climate (IPCC, Citation2014). Atmospheric EC is commonly considered to be produced by incomplete combustion of biomass and fossil fuel at high temperatures (Glassman, Nishida, and Sidebotham Citation1994) and is often used as a tracer in source characterization applications (Briggs and Long Citation2016). Ground-based air monitoring networks such as the Interagency Monitoring of Protected Visual Environments (IMPROVE) and Chemical Speciation Network (CSN) provide long-term records of EC mass concentrations operationally defined by thermal-optical analysis (TOA) of PM2.5 collected on 24-hr integrated filter samples. The IMPROVE network aims to monitor and improve visibility in remote pristine environments in protected federal areas, including national parks (Malm et al. Citation1994). CSN was established in 2000 to support the PM2.5 National Ambient Air Quality Standard (NAAQS) by monitoring urban air quality nationwide (Solomon et al. Citation2014). As such, data from the two networks show distinct characteristics of PM2.5 composition and EC concentrations (Hand et al. Citation2012).
TOA is a conventional method used by IMPROVE and CSN to separate the carbonaceous component of PM2.5 into organic carbon (OC) and EC. TOA involves thermal desorption of volatile and semi-volatile OC in an inert helium environment and oxidation of EC in an oxidative environment, followed by an optical correction for pyrolysis of OC. TOA results depend not only on the sample composition, but also on the analytical protocol and instruments used for analysis (e.g., Schauer, Citation2003; Schmid et al. Citation2001; Watson, Chow, and Chen Citation2005; Zhang et al. Citation2021). Among the various TOA protocols that have been developed over the years, the NIOSH thermal-optical transmission (TOT) and IMPROVE thermal-optical reflectance (TOR) are two of the most widely applied methods.
The NIOSH TOT protocol was derived from Birch and Cary (Citation1996) and was originally intended to measure EC as a diesel PM tracer for occupational exposure (NIOSH Citation2016). The IMPROVE TOR protocol was developed by the Desert Research Institute (DRI) to measure carbon on filter samples collected within the IMPROVE network, with sites primarily in rural Class I areas (Chow et al. Citation2007, Citation1993). CSN initially adopted the NIOSH method for TOA in 2000 (Peterson and Richards Citation2002). During 2007–2009, CSN carbon measurement went through a transition period with changes in the sampler type, analytical method, and analytical laboratory (Spada and Hyslop Citation2018). Since late 2009, CSN TOA has been performed by the DRI laboratory using the IMPROVE_A analysis protocol, in a step toward a harmonized carbon analysis approach for IMPROVE and CSN.
Starting with samples collected in October 2018, the Air Quality Research Center (AQRC) at the University of California at Davis (UCD) took over the analysis for CSN due to contractual change. During routine analysis, UCD noticed a considerable fraction of filter punches remained gray/black in color after TOA, indicating EC is not fully evolved by the IMPROVE_A protocol. Upon further inspection, these samples also exhibit other characteristics in common, including much lower final laser reflectance and transmittance signals compared to a clean filter punch. In addition, the FID signals did not return to the baseline value at the conclusion of the IMPROVE_A protocol. As per the laboratory standard operating procedure (DRI Citation2015; UCD Citation2019), laboratory technicians apply an analysis flag (“m5” from the DRI lab and “ME-2” from the UCD lab) to a sample with gray/black punch after TOA to indicate the existence of residual EC. The frequency of this flag is quite different between the IMPROVE and CSN networks; for example, in year 2017, DRI flagged only 0.1% (26 out of 18,195) of IMPROVE quartz filter samples with “m5”, compared to nearly 5% (644 out of 13,754) of CSN samples. In addition, the flags were concentrated at particular sites in CSN (discussed in Section 3), suggesting a common source of the residual EC. The much higher percentage of CSN samples with residual EC indicates a potential bias associated with using a harmonized carbon analysis method for samples from the two networks given the contrasting sources and composition characteristics.
This work focuses on quantifying residual EC on CSN samples. In the following sections, we present results from testing two modifications to the IMPROVE_A protocol on four selected CSN samples. The optimal operating parameters are determined by comparing the modified analyses against the standard IMPROVE_A analyses. Based on these results, we developed an extended IMPROVE_A protocol with a higher maximum temperature at 930°C. The extent of the residual EC on CSN samples is investigated by analyzing over 2600 CSN samples with the extended IMPROVE_A protocol.
Testing modifications to the IMPROVE_A protocol
TOA of CSN samples at the UCD carbon analysis laboratory is performed using Sunset Laboratory Model 5 L Thermal/Optical Carbonaceous Aerosol Analyzers (Sunset Laboratory Inc., Tigard, OR) implementing the IMPROVE_A protocol. Specifically, a ~ 0.6 cm2 circular punch is removed from each 25 mm diameter quartz filter sample and placed in the sample oven for analysis. Following the thermal program set by IMPROVE_A (), the filter punch is first heated in an inert (100% He) atmosphere where various OC subfractions are volatilized at 140°C (OC1), 280°C (OC2), 480°C (OC3) and 580°C (OC4), respectively. The system is then switched to an oxidizing atmosphere (He with 10% O2) where EC subfractions are combusted at 580°C (EC1), 740°C (EC2), and 840°C (EC3). The liberated carbon compounds are converted to methane (CH4) and sent to a flame ionization detector (FID). The residence time at each temperature step is event-driven, ranging between 150 s and 580 s; after 150 s, the program advances to the next temperature step when the FID signal returns to baseline, when the FID signal remains constant for more than 30 s, or when the residence time reaches 580 s, whichever comes first (Chow et al. Citation2007). Upon heating under the He atmosphere, a fraction of OC pyrolyzes into EC-like substances, which is accounted for using optical correction by reflectance.
Table 1. Parameters of the IMPROVE_A protocol and the modifications used in the experiment.
As noted earlier, analysis of CSN samples using IMPROVE_A resulted in approximately 5% of samples with residual EC by visual inspection. To address this issue, we explored two modifications to the standard IMPROVE_A protocol in an attempt to further oxidize the residual EC: (1) a prolonged residence time at the highest heating temperature (Tmax = 840°C) of IMPROVE_A, and (2) an additional, higher temperature step at the end of the standard IMPROVE_A protocol. Tmax is important because some forms of carbon are difficult to oxidize and may require a higher temperature during the oxidative mode (NIOSH Citation2016). Experiments conducted by Fung (Citation1990) suggested that pure graphite can be oxidized rapidly and completely by MnO2 at 850°C. It’s noteworthy that Tmax of IMPROVE_A (840°C) is ~ 10–100°C lower than different NIOSH-type protocols in the literature (Watson, Chow, and Chen Citation2005). In particular, Tmax of the NIOSH protocol formerly used by CSN in 2000–2009 was 920°C, 80°C higher than Tmax of IMPROVE_A (Solomon et al. Citation2014).
Due to the destructive nature of TOA and limited sample area, we tested an IMPROVE_A-type protocol that implements both modifications in a single analysis. Specifically, in the modified protocol, EC3 analysis step was extended to 1160 s, twice the longest time (580 s) the program is allowed to stay at each temperature step set by IMPROVE_A. In addition, after the completion of the EC3 step, the sample oven temperature was set to increase to 930°C for 580 s. This additional step in the oxidative mode is referred to as the EC4 step hereafter. The temperature of 930°C was adopted from the NIOSH930 protocol, one of the NIOSH-type protocols with a higher Tmax (Brandelet et al. Citation2017; Panteliadis et al. Citation2015).
Four CSN 24-h PM2.5 quartz samples were analyzed to evaluate the effectiveness of the modifications made to the protocol in evolving the residual EC. These samples, collected from the CSN site 53–077-0009 (Yakima – 4th Ave, WA), were selected based on their initial sample deposit color and the color of the filter punch after standard IMPROVE_A analysis (). Their EC mass loadings ranged from 2.4 to 14.8 µg cm−2, much lower than the upper detection limit of 30 µg cm−2 for EC as specified in the Sunset instrument operating manual. shows clear visual evidence of residual EC after standard IMPROVE_A analysis, as the punches (column b) are only slightly lighter in color compared to the original sample deposits (column a). shows the IMPROVE_A analysis thermogram of sample #4 as an example. Consistent with the dark color of the filter punch, the filter reflectance at the end of the heating sequence is at a much lower value compared to the typical value for a clean filter punch shown by the dashed black line in .
Figure 1. Visuals of the CSN PM2.5 quartz filter samples before analysis with one punch taken (left column), first filter punches after standard IMPROVE_A analysis (middle column) and second filter punches after modified IMPROVE_A analysis (right column).
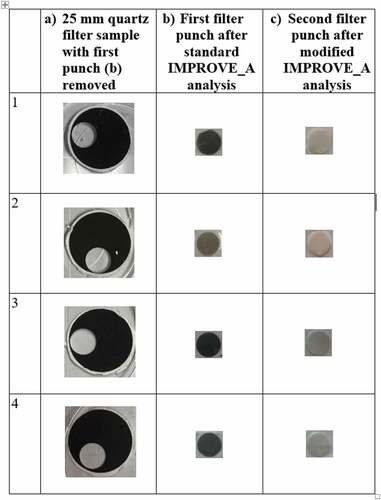
Figure 2. Example of thermal-optical analysis thermogram with the (a) standard and (b) modified IMPROVE_A protocol for sample #4 (). Reflectance (solid line) and FID (shaded dark green area) readings are normalized to their initial values and internal calibration peak, respectively. The programmed temperature set points (in °C) are shown in different colors on the laser reflectance trace. Reflectance of a clean quartz filter is shown as the dashed black line. Reflectance and FID readings are in arbitrary units (a.u.).
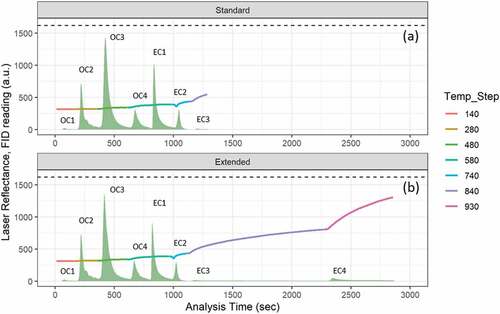
Second punches from these four samples were analyzed with the modified protocol on the same Sunset carbon analyzer; the color of the filter punches after the modified analysis is much lighter (, column c). Carbon thermograms of sample #4 from the standard and modified IMPROVE_A analyses are shown side-by-side in for direct comparison. The two thermograms are nearly identical in terms of the time sequence of evolved carbon peaks and the laser reflectance profile up to the end point of the standard analysis. The EC3 step in the standard analysis lasted for only 150 s, despite the increasing filter reflectance trace suggesting EC was still evolving. Examination of the raw data revealed that the FID did not fully return to baseline, but remained constant at nine counts above the baseline value from 110 to 150 seconds into the EC3 stage; this low FID signal triggered advancement of the analytical program.
In the modified protocol, the EC3 stage was extended ~8 times longer, from 150 s to 1160 s. The EC3 FID signal tailed off throughout the prolonged analysis time. The reflectance reading was 48% higher at the end of the 1160s-EC3 step compared to the original analysis, corresponding to an increase of EC3 mass loading from 0.19 µg cm−2 to 1.31 µg cm−2. After the oven temperature was raised to 930°C, the reflectance reading increased at a more rapid rate, while a well-defined FID peak (EC4 peak) also formed. The final reflectance reading in the modified analysis was 62% higher than at the end of the EC3 step, corresponding to an additional 1.44 µg cm−2 EC (EC4) evolved during this added higher temperature step. It is important to note that the laser reflectance was still ~20% lower than typical clean filter reflectance at the end of the EC4 step, suggesting some residual EC remained un-oxidized even after the prolonged analysis and higher heating temperature in the modified protocol.
Similar results were obtained from the modified analyses of all four samples. shows the cumulative evolved carbon mass (left panels) and the cumulative evolved sample absorbance (Abse, right panels) as a function of analysis time using the standard (solid lines) and modified (dotted lines) IMPROVE_A protocols. Here, the cumulative evolved carbon mass at each second of analysis is calculated from the calibrated, integrated FID signal expressed as mass of carbon per unit area of filter (µg cm−2). The cumulative evolved sample absorbance is defined as , where Tinitial is the initial laser transmittance and T is the transmittance measured at each second of analysis. Abse is the inverse of sample absorbance, and increases as a result of dark materials evolving from the filter.
Figure 3. Cumulative evolved carbon mass (left panels) and cumulative evolved sample absorbance (right panels) of the standard and modified IMPROVE_A analyses of each sample as a function of analysis time. Both sets of traces are color-coded by the programmed temperature set points (in °C).
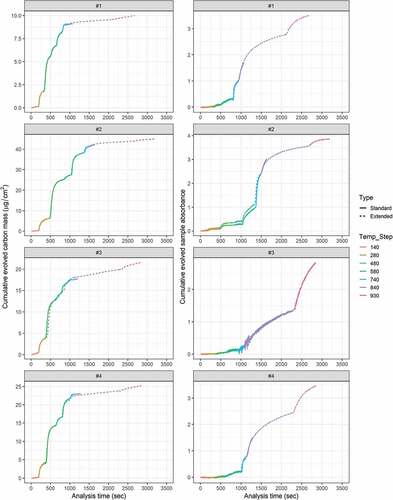
As shown in , the evolved carbon mass and sample absorbance profiles of the paired analyses (standard and modified) are nearly identical throughout the standard IMPROVE_A analysis. At the end of the standard analysis, both signals are still rising slightly, but low FID signals triggered the next step. The modified analysis evolved more dark carbon material from the sample punch at the same Tmax as the standard IMPROVE_A protocol plus at an additional higher temperature step. For the four filters analyzed, the additionally evolved EC mass ranges from 1.08 to 4.45 µg cm−2, accounting for 27.1% – 45.3% of the total EC and 7.6% to 25.1% of the TC determined by standard IMPROVE_A. More significantly, the evolved sample absorbance quantified by the modified protocol is 1.3 to 4.9 times higher than that determined by the standard protocol.
Overall, our results from analyzing four representative high EC CSN samples using a modified IMPROVE_A-type protocol demonstrate that more EC evolves with an increased maximum temperature or a prolonged residence time of the EC3 step (by more than 8 times). A prolonged residence time has two obvious drawbacks. First, the low FID signal-to-noise ratios in the long EC3 step result in a highly uncertain measurement of EC3. Second, to maintain high throughput, on the order of 1000 samples per month for CSN, an overly long analysis time is not operationally or economically feasible. The average analysis time for CSN samples is already close to 30 min using the standard IMPROVE_A protocol, and this modified protocol would increase the analysis time by 20–27 minutes. In contrast, the higher EC4 temperature more effectively removes residual EC than the prolonged analysis at the lower EC3 temperature, as is evident in the higher increasing rate in the cumulative evolved carbon mass and Abse during the EC4 stage (). In addition, adding a higher temperature step to the end of the IMPROVE_A heating cycle simply results in a new subfraction of evolved EC that can be reported as “EC4”, while the original EC1-EC3 subfractions are the same as those from the standard analysis, which allows for direct comparison with historical data. In section 3, we present results from analysis of over 2600 CSN quartz filter samples, using the IMPROVE_A protocol with an additional temperature step at 930°C (EC4) while all other IMPROVE_A parameters remain unchanged (referred to as the IMPROVE_A_930 protocol). The duration of the 930°C step is the same as other steps, ranging between 150 s and 580 s.
Quantifying residual EC on CSN samples
As detailed in Zhang et al. (Citation2021), a total of 4073 CSN quartz filter samples collected in 2017 were analyzed by both UCD and DRI prior to the carbon analysis laboratory change that took place in late 2018, providing a comprehensive dataset for instrument and laboratory inter-comparisons. In addition, to investigate the extent of the residual EC in CSN, 2632 out of the 4073 samples, collected between 2017-6-24 and 2017-9-14 at 145 sites within CSN, were analyzed by UCD in 2017–2018 using the IMPROVE_A_930 protocol. Separate punches from these CSN samples were later analyzed with the standard IMPROVE_A protocol by the DRI carbon laboratory, which included visual inspection of the punches after TOA. The visual inspection is viewed as a qualitative way to determine the presence of residual EC, and DRI’s independent visual flagging is compared with our quantitative EC4 measurement in the following discussions.
The method detection limit (MDL) of the EC4 fraction is determined based on measurements of 409 blank (unexposed) quartz-fiber filters. The MDL of EC4 is 0.12 µg/cm2, calculated as three times the standard deviation of the measured values. We found that a total of 168 samples contain measurable EC4 above the MDL with 63 samples above three times the MDL, accounting for 6.4% and 2.4% of the total samples analyzed, respectively. There is an overall weak correlation between EC4 and EC for samples with EC4 above 3*MDL (r2 = 0.16), likely due to multiple sources contributing to the total EC mass. In the following analysis, we calculated total EC mass loadings by including EC4 and binned the data into 20 groups based on total EC mass loading percentiles; each bin consists of 132 filter samples. This minimizes any systematic bias associated with low EC loading samples when reporting percentage contribution from EC4. shows the fraction of samples with detectable EC4 increases with increasing EC mass loading on the sample. Specifically, no EC4 was detected on samples with EC mass loading lower than 25th percentile, corresponding to EC mass loadings less than 3.8 µg cm−2. In contrast, EC4 was detected more frequently at higher EC mass loading bins (85th percentile and above). In the highest EC mass bin, nearly half the samples have detectable EC4. shows the sample-by-sample EC4 contribution to the total EC mass. For samples with EC4 measured below the MDL, the EC4 mass fraction is generally below 5% and could mostly be measurement noise (). For samples with detectable EC4, the average contribution of EC4 mass to total EC is 5.7%, with the highest contribution of ~28% in the highest EC mass loading bin.
Figure 4. Fractions of samples that have (a) measured EC4 above the method detection limit by extended IMPROVE_A analysis and (b) residual EC identified visually on punch after standard IMPROVE_A analysis. Sample counts are sorted by the EC mass loadings and are plotted for each 5th percentile bin.
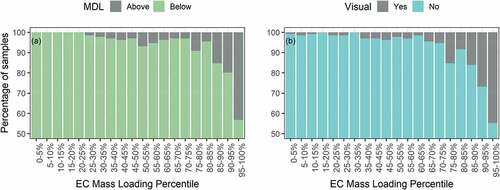
Figure 5. Mass fraction of EC4 in total EC as a function of EC mass loading bins. Each point represents one filter sample and is colored by (a) whether EC4 is above or below the method detection limit (MDL) by extended IMPROVE_A analysis or (b) whether residual EC was identified visually on punch after standard IMPROVE_A analysis. Points in each bin are jittered to avoid over-plotting.
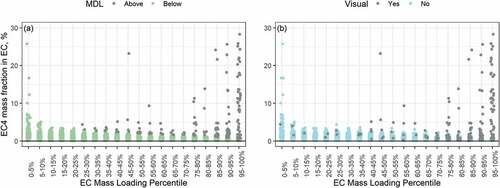
Similar but not identical distributions were found in the visual inspections for residual EC (). In general, there is a higher degree of consistency between the direct measurement and visual inspection of EC4 in the samples with higher EC mass loading, e.g., higher than 40th percentile. However, as evident in both figures, the two approaches exhibit some inconsistencies in determining the residual EC in the low to mid EC mass loading range. For instance, when EC mass loading is below 40th percentile, there are considerable number of samples flagged by visual inspection as having residual EC but with EC4 measured below MDL, or vice versa. Such inconsistency may be attributed to the inaccurate measurement of near-MDL level of EC4 mass loadings, the subjective nature of visual inspection, and the extra manual step required to note the observation.
Implications and suggestions for future work
The disagreement of measured EC by different TOA protocols (e.g., NIOSH vs. IMPROVE_A) have been investigated extensively. Previous protocol inter-comparison studies suggested that EC measured by NIOSH and IMPROVE_A can differ by up to an order of magnitude and attributed the cause of the disagreement to the different optical correction methods and the peak inert mode temperature (Tmax during the helium mode) adopted by the two protocols (e.g. Cheng et al. Citation2014; Chow et al. Citation2001; Subramanian, Khlystov, and Robinson Citation2006; Wu et al. Citation2016). However, Chan et al. (Citation2019) compared long-term EC and OC measurements from three monitoring networks at a collocated site and observed systematically lower TC, OC and EC measurements by IMPROVE_A when compared to those by ECT9, a protocol with heating temperature in the oxidation mode held constant at 900°C for 420s. One possibility is that the higher Tmax of ECT9 than IMPROVE_A protocol can partially explain their observations, which is consistent with our experimental results suggesting that increasing the IMPROVE_A Tmax releases more EC (and TC) from the filters. This possible cause for the EC disagreement by different TOA protocols has been largely overlooked by previous studies, and future inter-protocol comparisons focusing on Tmax are warranted to assess its impact on EC quantification.
It is beyond the scope of this work yet worthwhile for future work to better understand the sources of residual EC (or EC4) on the CSN samples. From a brief inspection of the CSN database, lists the top 15 CSN sampling sites that have detectable EC4 on the collected samples. Notably, 100% of samples from two of these sites (Akron – 5 Points, OH (39-153-0023) and Charleston NCore, WV (54-039-0020)) contain detectable EC4. On average, EC4 consists of 14% and 16% of total EC at these two sites, respectively. Both sites appear to be near diesel-engine emission sources. The Akron site is located less than 100 m north of a railroad track, while the Charleston site is located in a chemical industrial area and approximately 800 m north of the Kanawha River, where traffic of diesel powered fleets is frequent. Including EC4 measurements in source apportionment analysis for heavily EC loaded samples may provide additional insight into the origin of the residual EC.
Table 2. CSN sampling sites that have high frequency of samples with measurable EC4 above the method detection limit.
Conclusion
For over a decade, carbon measurement for the CSN network has been implementing thermal-optical reflectance method with the IMPROVE_A analytical protocol, which was developed for measurement of OC and EC from filter samples collected in remote pristine areas. During routine analysis of CSN samples, which are mostly from urban areas with higher filter loadings, we observed evidence of EC not being fully evolved by the IMPROVE_A analysis for approximately 5% of the samples. To explore conditions for further evolving the residual EC, we tested two modifications to the standard IMPROVE_A protocol on four CSN samples. Increasing the maximum heating temperature from 840°C to 930°C or above appears to be an operationally feasible approach to mitigate the issue of underestimating EC by IMPROVE_A. Out of the 2632 CSN samples analyzed by the extended protocol, additional EC evolved at the 930°C step was above the detection limit on 168 samples (6.4%), contributing up to 28% of the total reported EC. In addition, even after this higher temperature step, visual inspection of the punches suggested that some residual EC remained un-oxidized. Thus, the standard IMPROVE_A protocol’s under-reporting of EC from CSN samples may be even greater than has been estimated in this paper. Our results demonstrate a potential negative bias in EC quantification using IMPROVE_A protocol that have been overlooked in previous protocol inter-comparison studies and provide remedy for this issue by adding a higher temperature step to the existing IMPROVE_A protocol.
Acknowledgment
This work was supported in part by the Environmental Protection Agency (EPA) (contract number EP-D-15-020). The conclusions are those of the authors and do not necessarily reflect the views of the sponsoring agency.
Disclosure statement
No potential conflict of interest was reported by the author(s).
Data availability statement
The data that support the findings of this study are available from the corresponding author, XZ, upon request.
Additional information
Funding
Notes on contributors
Xiaolu Zhang
Xiaolu Zhang is an associate project scientist in the Air Quality Research Center at the University of California Davis. Her current research focuses on characterizing carbon measurement techniques for PM2.5 filter samples to ensure data quality and consistency for long-term ambient monitoring network. Prior to joining AQRC, Xiaolu worked as a post-doctoral researcher in Department of Civil and Environmental Engineering at UC Davis and earned her PhD degree in Earth and Atmospheric school at Georgia Institute of Technology.
Krystyna Trzepla
Krystyna Trzepla was the Laboratory Manager for the Air Quality Research Center at the University of California Davis until her retirement in 2020. Ms. Trzepla provided support for all research studies involving monitoring particles in the atmosphere, with special emphasis on the application of elastic lidar system for monitoring spatial distribution and elemental analyses by X-Ray Fluorescence and Proton Elastic Scattering.
Warren White
Warren White is a mathematician with the Air Quality Monitoring Team at the University of California at Davis, with broad air quality interests and experience. He currently focuses on carbon and light absorption measurements by particle speciation networks.
Nicole Pauly Hyslop
Nicole Pauly Hyslop is the Associate Director for Quality Research in the Air Quality Research Center at the University of California Davis. Dr. Hyslop conducts research to characterize data quality to gain a better understanding of the sources of error in the measurements and improve quality assurance protocols to identify and reduce errors.
References
- Anon. AR5 climate change 2014: Synthesis report — IPCC, [online] https://www.ipcc.ch/site/assets/uploads/2018/05/SYR_AR5_FINAL_full_wcover.pdf.
- Birch, M. E., and R. A. Cary. 1996. Elemental carbon-based method for monitoring occupational exposures to particulate diesel exhaust. Aerosol Sci. Technol. 25 (3):221–41. doi:10.1080/02786829608965393.
- Bond, T. C., and R. W. Bergstrom. 2006. Light absorption by carbonaceous particles: An investigative review. Aerosol Sci. Technol. 40 (1):27–67. doi:10.1080/02786820500421521.
- Brandelet, B., C. Rose, C. Rogaume, and Y. Rogaume. 2017. Investigation of the organic carbon ratio analysis on particles from biomass combustion and its evolution in three generations of firewood stoves. Biomass Bioenergy 99:106–15. doi:10.1016/j.biombioe.2017.03.002.
- Briggs, N. L., and C. M. Long. 2016. Critical review of black carbon and elemental carbon source apportionment in Europe and the United States. Atmos. Environ. 144:409–27. doi:10.1016/j.atmosenv.2016.09.002.
- Chan, T. W., L. Huang, K. Banwait, W. Zhang, D. Ernst, X. Wang, J. G. Watson, J. C. Chow, M. Green, C. I. Czimczik, et al. 2019. Inter-comparison of elemental and organic carbon mass measurements from three North American national long-term monitoring networks at a co-located site. Atmos. Meas. Tech. 12:4543–60. doi:10.5194/amt-12-4543-2019.
- Cheng, Y., K. B. He, F. K. Duan, Z. Y. Du, M. Zheng, and Y. L. Ma. 2014. Ambient organic carbon to elemental carbon ratios: Influence of the thermal-optical temperature protocol and implications. Sci. Total Environ. 468-469:1103–11. doi:10.1016/j.scitotenv.2013.08.084.
- Chow, J. C., J. G. Watson, L.-W. A. Chen, M. C. O. Chang, N. F. Robinson, D. Trimble, and S. Kohl. 2007. The IMPROVE_A temperature protocol for thermal/optical carbon analysis: Maintaining consistency with a long-term database. J. Air Waste Manage. Assoc. 57 (9):1014–23. doi:10.3155/1047-3289.57.9.1014.
- Chow, J. C., J. G. Watson, D. Crow, D. H. Lowenthal, and T. Mrrifield. 2001. Comparison of IMPROVE and NIOSH carbon measurements. Aerosol. Sci. Technol 34:23–34. doi:10.1080/027868201300081923.
- Chow, J. C., J. G. Watson, L. C. Pritchett, W. R. Pierson, C. A. Frazier, and R. G. Purcell. 1993. The DRI thermal/optical reflectance carbon analysis system: Description, evaluation and applications in U.S. Air quality studies. Atmos. Environ. 27A (8):1185–201. doi:10.1016/0960-1686(93)90245-T.
- DRI. 2015. SOP 2-226r1: DRI model 2015 multiwavelength thermal/optical carbon analysis (TOR/TOT) of aerosol filter samples - method IMPROVE_A. Reno, NV: Desert Research Institute. http://vista.cira.colostate.edu/improve/wp-content/uploads/2016/07/IMPROVEA_Model2015_2-226r1_20160125final.pdf.
- Fung, K. 1990. Particulate carbon speciation by MnO2 oxidation. Aerosol Sci. Technol. 12 (1):122–27. doi:10.1080/02786829008959332.
- Glassman, I., O. Nishida, and G. Sidebotham. 1994. Critical temperatures of soot formation. In Soot formation in combustion: Mechanisms and models, ed. H. Bockhorn, 316–24. New York: Springer-Verlag.
- Hand, J. L., B. A. Schichtel, M. Pitchford, W. C. Malm, and N. H. Frank. 2012. Seasonal composition of remote and urban fine particulate matter in the United States. J. Geophys. Res. 117:DO5209. doi:10.1029/2011JD017122.
- Malm, W. C., J. F. Sisler, D. Huffman, R. A. Eldred, and T. A. Cahill. 1994. Spatial and seasonal trends in particle concentration and optical extinction in the United States. J. Geophyiscal Res. 99 (D1):1347–70. doi:10.1029/93JD02916.
- NIOSH. 2016. Method 5040 Issue 4: Elemental carbon (diesel exhaust). In NIOSH manual of analytical methods (NMAM), 5th ed., DL-1–DL-41. Cincinnati: National Institute of Occupational Safety and Health.
- Panteliadis, P., T. Hafkenscheid, B. Cary, E. Diapouli, A. Fischer, O. Favez, P. Quincey, M. Viana, R. Hitzenberger, R. Vecchi, et al. 2015. ECOC comparison exercise with identical thermal protocols after temperature offset correction - instrument diagnostics by in-depth evaluation of operational parameters. Atmos. Meas. Tech. 8:779–92. doi:10.5194/amt-8-779-2015.
- Peterson, M. R., and M. H. Richards. 2002. Thermal-optical-transmittance analysis for organic, elemental, carbonate, total carbon, and OCX2 in PM2.5 by the EPA/NIOSH method, Presentation at the Symposium on Air Quality Measurement Methods and Technology in San Francisco, CA, 13–15 November 2002, J. Air Waste Manage. Assoc., Pittsburgh, PA, USA, Session 5, Paper #83.
- Pope, C. A., and D. W. Dockery. 2006. Health effects of fine particulate air pollution: Lines that connect. J. Air Waste Manage. Assoc. 56 (6):709–42. doi:10.1080/10473289.2006.10464485.
- Schauer, J. J., B. T. Mader, J. T. DeMinter, G. Heidemann, M. S. Bae, J. H. Seinfeld, R. C. Flagan, R. A. Cary, D. Smith, B. J. Huebert, et al. 2003. ACE-Asia intercomparison of a thermal-optical method for the determination of particle-phase organic and elemental carbon. Environ. Sci. Technol. 37 (5):993–1001. doi:10.1021/es020622f.
- Schmid, H. P., L. Laskus, H. J. Abraham, U. Baltensperger, V. M. H. Lavanchy, M. Bizjak, P. Burba, H. Cachier, D. Crow, J. C. Chow, et al. 2001. Results of the “Carbon conference” international aerosol carbon round robin test: Stage 1. Atmos. Environ. 35 (12):2111–21. doi:10.1016/S1352-2310(00)00493-3.
- Solomon, P. A., D. Crumpler, J. B. Flanagan, R. K. M. Jayanty, E. E. Rickman, and C. E. McDade. 2014. U.S. National PM2.5 chemical speciation monitoring networks—CSN and IMPROVE: Description of networks. J. Air Waste Manage. Assoc. 64 (12):1410–38. doi:10.1080/10962247.2014.956904.
- Spada, N. J., and N. P. Hyslop. 2018. Comparison of elemental and organic carbon measurements between IMPROVE and CSN before and after method transitions. Atmos. Environ. 178:173–80. doi:10.1016/j.atmosenv.2018.01.043.
- Subramanian, R., A. Y. Khlystov, and A. L. Robinson. 2006. Effect of peak inert-mode temperature on elemental carbon measured using thermal-optical analysis. Aerosol Sci. Technol. 40:763–80. doi:10.1080/02786820600714403.
- UCD. 2019. CSN standard operating procedure #402: Thermal/optical reflectance (TOR) carbon analysis using a sunset carbon analyzer. Davis: University of California. https://www.epa.gov/sites/production/files/2019-11/documents/ucd_sop402_tor_carbon_analysis_final_srsedit.pdf.
- Watson, J. G. 2002. Visibility: Science and regulation. J. Air Waste Manag. Assoc. 52 (6):628–713. doi:10.1080/10473289.2002.10470813.
- Watson, J. G., J. C. Chow, and L.-W. A. Chen. 2005. Summary of organic and elemental carbon/black carbon analysis methods and intercomparisons. Aerosol Air Qual. Res. 5 (1):65–102. 205AD. doi:10.4209/aaqr.2005.06.0006.
- Wu, C., X. H. H. Huang, W. M. Ng, S. M. Griffith, and J. Z. Yu. 2016. Inter-comparison of NIOSH and IMPROVE protocols for OC and EC determination: Implications for inter-protocol data conversion. Atmos. Meas. Tech. 9:4547–60. doi:10.5194/amt-9-4547-2016.
- Zhang, X., K. Trzepla, W. White, S. Raffuse, and N. P. Hyslop. 2021. Intercomparison of thermal–optical carbon measurements by Sunset and Desert Research Institute (DRI) analyzers using the IMPROVE_A protocol. Atmos. Meas. Tech. 14:3217–31. doi:10.5194/amt-14-3217-2021.