
 ?Mathematical formulae have been encoded as MathML and are displayed in this HTML version using MathJax in order to improve their display. Uncheck the box to turn MathJax off. This feature requires Javascript. Click on a formula to zoom.
ABSTRACT
Recent research has pointed out many reasons why the building downwash formulation in AERMOD needs to be updated due to: overly simplified equations for building wake development; equations that do not account for porous or streamlined structures; a discontinuity in the streamline equation; and over predictions when compared to field observations for buildings with a large footprint. Because of these issues, a research study was initiated in late 2016 with an overall objective of improving the building downwash algorithms in PRIME. The research study involved the use of wind tunnel modeling to develop a database of wind speed and turbulence intensity measurements downwind of various rectangular solids and streamlined (i.e., tanks and towers) structures. Based on those measurements, new equations (PRIME2) were developed to better describe the turbulence increase and velocity deficit in building wakes for these structure types. The PRIME2 building wake equations for turbulence intensity increase and velocity deficit were shown to agree better with wind tunnel observations than the current PRIME equations in AERMOD. The new equations were documented in a journal article and were added to AERMOD’s PRIME subroutine. A new version of AERMOD was then compiled with the new enhanced turbulence and wind speed equations (PRIME2) for evaluation. The key feature of the PRIME2 equations is that building wake enhanced turbulence decays rapidly back to ambient levels above the top of the building versus the current PRIME theory that has constant enhanced turbulence extending up to the height of the wake. This paper provides details on the implementation of the PRIME2 code into AERMOD, PRIME plume rise enhancements, the field databases used to evaluate PRIME2, and the evaluation of PRIME2 against three field databases. The paper shows that AERMOD with the PRIME2 building downwash equations and other enhancements provides the overall best agreement with field observations.
Implications: While AERMOD/PRIME is supposed to provide accurate and unbiased estimates (within a factor of two), recent research has identified several problems with the current building downwash theory in AERMOD and comparisons against field observations have shown significant under and overpredictions. One major problem is that the current theory has the wake effect extending well above the top of the building while new research shows that the wake effect decays rapidly above the top of the building. This could lead AERMOD to underpredict or overpredict ground-level concentrations. Based on recent wind tunnel tests, a new building downwash theory has been developed and documented in a Journal article. This theory has been added to the PRIME building downwash algorithm in AERMOD and is currently included as an Alpha option in AERMOD. This paper evaluates that new theory against field observations and demonstrates that the updated theory provides better agreement with field observations than the current AERMOD. This paper points out that research and development of model building downwash improvements should be an ongoing process to help ensure a “sustainable” future where these improvements can ultimately provide a model with unbiased performance and thereby allow for responsible industrial development. This study has shown that improvements can be made in a rather quick manner and be included as Alpha options in EPA model updates. The next challenge is to transition these options from Alpha to Beta options and then finally to a default status.
Introduction
AERMOD (American Meteorological Society/U.S. Environmental Protection Agency Regulatory Model) is the U.S. Environmental Protection Agency’s (EPA) recommended model (Cimorelli et al. Citation2005) for assessing compliance with National Ambient Air Quality Standards (NAAQS). Included in AERMOD is a formulation for predicting the effect of building wakes on plume rise and dispersion referred to as PRIME (Plume Rise Model Enhancements) (Schulman et al. Citation2000). Petersen, Guerra, and Bova (Citation2017) published a critical review of PRIME and documented several problems. First, they found that PRIME assumes that the turbulence increase and velocity decrease in the wake is constant up to the height of wake (Schulman et al. Citation2000) and presented wind tunnel and CFD (Computational Fluid Dynamics) simulation results showing that the turbulence increase and velocity deficit actually decrease quickly back to ambient levels above the top of the building. They also showed that the equations for predicting streamlines in the wake have a discontinuity, there is no equation to account for a corner vortex (Banks et al. Citation2000) which quickly brings the plume to ground-level and provided references showing AERMOD overpredicts for certain building configurations by factors of 2 to 8.
Perry et al. (Citation2016) conducted a wind tunnel study on the effect of elongated buildings on plume dispersion and found that the plume centerline is shifted laterally when the building is at an angel to the approach flow. They also found that when the building is oriented at 45 degrees to the approach flow, the plume descends more rapidly to ground level than for a building perpendicular to the approaching flow. The latter effect is attributed to the corner vortex (Banks et al. Citation2000). These effects are not treated in PRIME.
Monbureau et al. (Citation2018) reported on a study designed to improve PRIME’s ability to accurately model complex building downwash scenarios based on wind tunnel model studies and large eddy simulations (Foroutan et al. Citation2018). Based on that work, they recommended three modifications to the building downwash algorithms in PRIME and one modification to the building pre-processor program (EPA Citation1995, Citation2019) to improve the building dimension inputs for elongated buildings. The PRIME improvements that were recommended to be included in upcoming AERMOD revisions included: change the plume cavity calculation so there is no discontinuity between the end of the cavity and start of the re-emitted plume; use a more representative wind speed for concentration calculations; and increase the minimum ambient vertical turbulent intensity to the value recommended by Weil (Citation1996). These changes were tested against wind tunnel observations and demonstrated that longitudinal ground-level concentrations profiles followed the shape and magnitude of wind tunnel observations.
These articles point out many reasons why the PRIME formulation in AERMOD needs to be updated which include: a building downwash formulation based on research carried out over two decades ago (Schulman et al. Citation2000); formulation developed based on a limited number of “solid” building shapes (Snyder and Lawson Citation1994); equations that are not suitable for porous, streamlined, wide or elongated structures; and large over predictions when compared to observations from recent and past field databases (Petersen, Guerra, and Bova Citation2017). Based on these issues, a research study was initiated in late 2016 with the following overall objectives: 1) correct the known problems in the theory; 2) incorporate and advance the current state of science; 3) expand the types of structures that can be accurately handled (e.g., streamlined, porous, long, wide); 4) properly document and verify the model formulation and code for the updated PRIME (referred to as PRIME2); and 5) develop methods with EPA to facilitate implementing model improvements in a more expeditious manner. Since then, the US EPA has implemented a framework that allows for the inclusion of new updates to the model in a staged approach (EPA Citation2021).
Similar to the development of AERMOD (Cimorelli et al. Citation2005) and the formation of the AERMIC committee (American Meteorological Society and EPA Regulatory Model Improvement Committee), the PRIME2 subcommittee of the Air and Waste Management Association’s (A&WMA) Atmospheric Modeling and Meteorology Committee was formed to: (1) establish a mechanism to review, approve and implement new science into the model for this and future improvements; and (2) provide a technical review forum to improve the PRIME building downwash algorithms. Collaboration with EPA’s Office of Research and Development (ORD) and Office of Air Quality Planning and Standards (OAQPS) was also an objective which was met during the course of the research project and continues. The expectation from the A&WMA modeling community as represented by the Atmospheric Modeling and Meteorology Committee was that future model improvements could be implemented in a more expeditious manner.
The initial research involved the use of wind tunnel modeling to develop a database of wind speed and turbulence intensity measurements downwind of various solid and streamlined structures. Based on those measurements, new equations (PRIME2) were developed to better describe the turbulence intensity increase and velocity deficit in the building wake. The new PRIME2 building wake equations for predicting turbulence intensity increase and velocity deficit agreed better with wind tunnel observations than with the current PRIME equations in AERMOD. The new equations were documented by Petersen and Guerra (Citation2018) and were added to AERMOD’s PRIME subroutine. A new version of AERMOD was then compiled with the new enhanced equations (PRIME2) for evaluation.
The development and evaluation of the PRIME2 equations are described in detail in Petersen and Guerra (Citation2018). The key features of the PRIME2 equations which agree well with wind tunnel observations are summarized below. The PRIME2 equations have the turbulence intensity increase and velocity deficit in the building wake decay rapidly back to ambient levels above the top of the building while the current PRIME equations (Schulman, Strimaitis, and Scire Citation2000) have the turbulence intensity increase and velocity deficit constant up to the height of the wake. PRIME2 has the lateral turbulence intensity increase in the wake less than vertical turbulence intensity increase; whereas PRIME has them nearly identical. The PRIME2 equations also use the approach turbulence and wind speed computed at plume height as input values versus PRIME that uses a constant and arbitrary height for these input values of half the wake height at 15 R downwind of the building where R is a building length scale. Since plume transport and dispersion occur at plume height, wind speed and turbulence inputs at this height are more appropriate versus a constant height not related to the plume height. PRIME2 includes equations for turbulence intensity increase and velocity decrease for streamlined structures (i.e., cooling towers and tanks) which are less than those for rectangular solids and the turbulence intensity increase decreases as approach roughness increases. The PRIME equation does have turbulence intensity changing with approach roughness but no observations were provided to support the methodology; whereas the PRIME2 equations were compared with wind tunnel observations with different approach roughness conditions and showed good agreement.
This paper discusses the process of taking PRIME2 from the research phase to a regulatory default option. Based on EPA’s current framework (EPA Citation2021), one of the requirements before a model enhancement can be used as a default option is that the new theory be documented in a peer reviewed Journal. The Petersen and Guerra (Citation2018) paper was step 1 in that process where the development of the new building downwash equations are documented. This paper represents the next step, where the theory is installed in AERMOD, and model predictions are evaluated against field observations. The paper provides details on the implementation of the PRIME2 equations and other enhancements into AERMOD, an evaluation of PRIME plume rise predictions and a potential improvement, the field databases used to evaluate PRIME2 and AERMOD, and the evaluation of PRIME2 and AERMOD against the field databases.
Implementation of PRIME2 and other AERMOD enhancements
Before a model can used to assess compliance with NAAQS, it must meet requirements outlined in EPA’s Guideline on Air Quality Models (EPA Citation2017). These requirements include: (1) a complete test dataset must be included with the model submission; (2) the model must be useful to typical users; and (3) the model submission must include a robust comparison with air quality data. To meet these requirements, AERMOD was modified such that the PRIME2 enhanced calculations of turbulence and wind speed could be used instead of the current PRIME equations. Several other modifications were included for model evaluation purposes as discussed below. Then documentation on the model changes and model options was prepared along with the source code and a compiled operating version. PRIME2 was then evaluated against the air quality data as discussed in this paper. That information was provided to EPA and after their internal evaluation PRIME2 and other options were inserted into their working version of AERMOD. In early 2021, EPA released AERMOD version 21112 that includes the PRIME2 turbulence increase and velocity deficit equations, other options discussed below, and the building downwash enhancements recommended by Monbureau et al. (Citation2018). These building downwash enhancements were grouped into two categories. The first is referred to as the ORD building downwash options based on a research initiative led by EPA’s ORD. The second is referred to as the AWMA building downwash options which are based on the A&WMA’s PRIME2 subcommittee’s work with the authors and the new PRIME2 wake equations documented in Petersen and Guerra (Citation2018).
EPA (Citation2021) provides the information needed to run AERMOD with the PRIME2 and/or ORD options. Both PRIME2 and ORD options are considered ALPHA options at this time. ALPHA options are defined as experimental and developmental options not available for regulatory use. After ALPHA options are tested and peer reviewed, they can become BETA options which may be used as an alternate model and ultimately may be promulgated as approved for regulatory use (EPA Citation2021). The long-term goal is for the PRIME2 enhanced calculations of turbulence wind speed to be approved as a regulatory option.
To run an ALPHA or BETA option, a keyword first needs to be specified (EPA Citation2021). For the PRIME2 (AWMA) options the keyword is AWMADWNW. For the ORD options, the keyword is ORDWNW. Both keywords can be specified. Once a keyword is specified, the following parameters can be set (EPA Citation2021). Any of the parameters can be selected with some restrictions as noted below.
AWMAUEFF This parameter controls the height at which the wind speed is calculated for computing concentrations for the main plume. With this parameter set, the plume centerline height is used for this calculation. The PRIME algorithm currently uses the wind speed at stack height. This parameter was set for all PRIME2 runs.AWMAENTRAIN Changes the β entrainment coefficient for PRIME plume rise from the default value of 0.60 to 0.35. This parameter was set for selected PRIME2 and AERMOD runs. It should be noted that when AERMOD is run with this parameter set the keyword AWMADWNW also needs to be specified.AWMAUTURBHX Enables PRIME2 enhanced calculations of turbulence and wind speed using the PRIME plume rise at the downwind distance X, for all calculations as discussed in Petersen and Guerra (Citation2018). This option uses the final momentum plume rise height to initially compute effective wind speed (UEFF), effective vertical turbulence (SWEFF), effective lateral turbulence (SVEFF), effective potential temperature gradient (TGEFF), and initial ambient turbulence intensities in y and z direction (ambiy and ambiz) and then uses the PRIME computed plume rise at each downwind distance for all “EFF” computations. Also, this option computes mean wind speed, vertical turbulence, and lateral turbulence at a 30 m height for use in computing best fit constants used in the PRIME2 equations. All parameters are hourly averages.AWMAUTURB An earlier version of the PRIME2 enhanced calculations of turbulence and wind speed discussed in EPA (Citation2021) and not recommended for use because unnecessary simplifying assumptions were used.STREAMLINED Uses alternate formulations for turbulence increase and velocity deficit associated with the AWMUTURB and AWMATURBHX options with modifications for streamlined structures (i.e., cooling towers and tanks). When specified, all structures in the AERMOD building input file are treated as streamlined structures. If this parameter is not specified, all structures in the AERMOD building input file are treated as rectangular solids.ORDCAV Redefines the point downwind at which the vertical and lateral dispersion coefficients begin to grow with downwind distance from the lee edge of the building to the end of the cavity (Monbureau et al. Citation2018). PRIME considers a cavity plume and a reemitted plume to simulate two distinct regions with a weighted distribution of mass between the two plumes. The cavity and re-emitted plumes initially have the same lateral and vertical dispersion on the leeward side of the building. The re-emitted plume grows with downwind distance while currently the dispersion of the cavity plume remains unchanged throughout the cavity which creates a discontinuity of the two plumes at the near-wake boundary and results in an unrealistic reduction in ground level concentrations. This option sets the dispersion coefficients for the two plumes equal to each other at the cavity edge eliminating the discontinuity between the two plumes.ORDTURB Redefines the maximum value of the nondimensional vertical turbulence intensity in the wake, reduced from the current value of 0.07 in PRIME to 0.06 based on Weil (Citation1996).ORDUEFF Redefines the height at which the wind speed is specified for use in the calculation of concentrations for the main plume. This option uses the average of the wind speed between the height of the receptor and the plume centerline. Only ORDUEFF or AWMAEFF can be selected, not both.If no keyword is specified, the current AERMOD building downwash formulation is used (PRIME).
AERMOD version 21112 (or 19191 as noted) was used for the model evaluation discussed in this paper. Various model scenarios were evaluated using the keywords and parameters discussed above. The parameters were selected for evaluation purposes on the basis of having technical merit.
Evaluation of PRIME plume rise predictions
An evaluation of PRIME2 versus the field databases described below was carried out using AERMOD version 19191. The evaluation which is discussed later in the paper showed that PRIME2 tended to overpredict concentrations by more than a factor or two when compared to field observations for the Alaska North Slope database. One reason for that could be that the PRIME plume rise model (Schulman et al. Citation2000) is underpredicting plume rise. A review of the literature showed that PRIME plume rise-type algorithms (i.e., integral models) have only been evaluated against water flume or wind tunnel observations for an isolated stack (Contini et al. Citation2011; Ooms Citation1972; Petersen Citation1987).
The PRIME plume rise algorithm is a numerical solution to the basic equations for conservation of mass, energy, and momentum. To solve the equations, two entrainment constants (α and β) are needed. Based on Hoult and Weil (Citation1972), α is set equal to 0.11 in PRIME. It should be noted that α is most important in the initial phase of plume rise before the plume bends over. Based on Hoult and Weil (Citation1972), β in PRIME was set equal to 0.6. β is more important when the plume is bent over and when the plume velocity and ambient velocity are similar. Petersen (Citation1987) found that other researchers had α varying between 0.057 and 0.08 and β values varying from 0.5 to 1.3. More recently, Contini et al. (Citation2011) measured plume heights from 41 different cases in a neutrally stratified crossflow and 19 cases in a stably stratified crossflow. The experiments were carried out in a towing water tank facility. For the integral model he found through a best fit analysis that α = 0.015 (± 0.05) compared to the 0.1 value used in PRIME and β = 0.65 (± 0.07) compared to the 0.6 values used in PRIME. Kukkonen et al. (Citation2014) used an integral plume rise model to evaluate dispersion from wild-land fires. He justified using α = 0.08 and β = 0.7 based on wind tunnel experiments. Briggs (Citation1975, Citation1984) presents detailed information on an analytical plume rise model and recommended entrainment coefficients based on comparisons with wind tunnel and field observations. Briggs constants are not appropriate for integral models as shown in Contini et al. (Citation2011).
Since these two entrainment constants affect the predicted plume rise and have been determined based on plume rise observations in non-building wake flows, additional research was carried out to assess whether the current constants used in PRIME are appropriate to characterize plume rise in building wakes and whether new constants would improve model performance.
Two wind tunnel data bases (Huber and Snyder Citation1982; Petersen and Reifschneider Citation2006) were identified where plume rise observations were obtained when building downwash effects are important. While Perry et al. (Citation2016) did collect plume rise data in a building wake, the release was horizontal, and the results are not appropriate for this analysis.
The Huber/Snyder database consisted of vertical concentration profiles measured at several downwind distances for stack height to building height (Hs/Hb) ratios ranging from 1.2 to 2.5. Exhaust density ratio varied from 1 to 0.5 and the ratio of exit velocity (Vs) to wind speed (Us) at stack top varied from 0.7 to 8.4. The simulated building height (Hb) was 50 m full scale and the building height to width-to-length ratio (Hb:W:L) was 1:2:1. The building was placed directly upwind of the stack and centered on the stack.
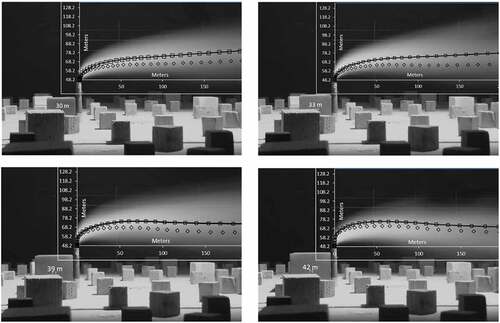
The Petersen and Reifschneider (Citation2006) database consisted of the plume visualizations shown in . Four cases were evaluated where the full-scale stack height (Hs) was 48.2 m and Hb was varied from 30 to 42 m. For all cases, Us = 10.8 m/s, Vs = 44.6 m/s, D = 2.59 m, ambient temperature (Ta) = 298.15 K; and stack temperature (Ts) = 304.52 K. The building was placed directly upwind of the stack and centered on the stack for all cases and Hb:W:L was 1:2:1.
Figure 1. Plume rise visualizations showing current PRIME predicted plume rise (diamond) and PRIME predicted plume rise with the entrainment constant β = 0.35 (square with line). The full scale stack height is 48.2 m and building height varies from 30 to 42 m.
AERMOD_v19191 was run for each case and predicted plume rise values were obtained from the diagnostic file. Observed plume rise values were then compared to the predicted ones. The PRIME entrainment constants, α and β, in AERMOD_v19191 were varied as follows to determine the constants that produce the best agreement with observations. All changes were made to increase the plume rise (i.e., smaller coefficients) because an initial evaluation showed the PRIME was underpredicting plume rise.
Case 1: Current AERMOD: α = 0.11; β = 0.6
Case 2: α = 0.06; β = 0.6
Case 3: α = 0.06; β = 0.3
Case 4: α = 0.11; β = 0.35
Case 5: α = 0.11; β = 0.45
Changing α from 0.11 to 0.6 had a minor effect (1–2%) on increasing the predicted plume rise while changing β had a more significant affect. The best agreement was observed when β = 0.35. The results for those cases will be discussed in more detail. The purpose of this work was not to find the optimal coefficients but to determine whether better plume rise predictions could be obtained. Additional research will be needed to find the optimum coefficients.
shows the results for the Petersen and Reifschneider (Citation2006) database. A qualitative assessment of the figure shows that the current PRIME predictions tend to fall below the plume centerline for all cases except the 42 m high building case where PRIME shows good agreement. The predicted plume rise with the new entrainment coefficient is closer to the plume centerline for all other cases. The reason for a different conclusion for the 42 m building is likely because Hs/Hb = 1.2 and the stack is just slightly above the building top. For this case, the PRIME predicted plume rise near the stack is much higher due to the algorithm in AERMOD that predicts wind speed reductions above the building. Close to the building top, the wind speed reduction is the greatest which in turn results in higher plume rise. Overall, these results suggest that the current PRIME plume rise algorithm is underestimating plume rise except for very short stacks and that a new entrainment constant could provide better agreement.
shows the results for the Huber/Snyder database for all cases with a R ≥ 1.5, where R is Vs/Us. The figure shows the neutrally buoyant and buoyant plume rise results versus R for Hs/Hb = 1.2 and the results versus density ratio (buoyancy) for Hs/Hb = 1.5 and R = 1.5. The cases with R = 0.7 had significant stack-tip downwash effects and were excluded from the analysis. The figure shows that when R = 1.5 the new entrainment coefficient does not consistently provide better agreement with observations. For these cases, the plume rise is low, and some stack-tip downwash may still be present. For the cases with a higher R, the new entrainment coefficient consistently provides better agreement with observations. The overall average predicted to observed ratios for all cases in was 0.98 with β = 0.35 and 0.91 using the current PRIME entrainment value (β = 0.6).
Figure 2. Observed normalized plume rise (Z/Hs) from the Huber et al. (Citation1982) database for the cases where the velocity ratio (R) is 1.5 or greater compared to PRIME predicted normalized plume rise using the existing entrainment coefficient (β = 0.6) and updated entrainment coefficient (β = 0.35).
These results suggest that a new entrainment constant can provide better agreement with plume rise observations and that additional research in this area is warranted. To assess the effect on concentration predictions, AERMOD was modified so that when the parameter AWMAENTRAIN is set, β is set equal to 0.35. The effect of this parameter on AERMOD concentration estimates is discussed later in this paper.
Field databases
Three field databases were selected to evaluate model performance: Bowline Point; Alaska North Slope; and Balko, Oklahoma. These databases were selected because building downwash effects dominate the dispersion. Two of the databases (Bowline Point and Balko) had hourly field observations for a year or more making them ideal for evaluating models for regulatory type applications. The Alaska database was unique in that hourly concentrations at many receptors were measured at various downwind distances for 44 hours of tracer gas releases. While there are other building downwash database bases available from EPA’s Support Center for Regulatory Air Modeling (SCRAM) website, one was a wind tunnel modeling database and two were databases where the building cavity was dominating the dispersion. The details on all the other databases are summarized in EPA (Citation2019). Future research will consider adding additional databases to the evaluation.
A description of each database used in this evaluation is provided below.
Alaska North Slope
This database consisted of 44 hours of buoyant SF6 releases from a 39-m-high turbine stack which was adjacent to one of two turbine units as shown in . The two turbine units are 34 m tall, 24 m wide and 39 m long and are the tallest structures in the facility (Guenther, Lamb, and Allwine Citation1989) with most of the other buildings having heights of 20 m or less. shows the key buildings and stack that were used for input to AERMOD. The source parameters are listed in . Tracer gas samples were collected over seven arcs from 50 to 3000 m downwind. For model comparison purposes, the maximum values in selected arcs were tabulated which resulted in a total of 154 observations. Meteorological data included wind speed, wind direction, temperature, sigma-theta, and sigma-w from an on-site tower at a 33 m height. All experiments were conducted during daylight hours. Stability conditions were generally neutral or slightly stable. Atmospheric stability and wind speed profiles were affected by the smooth snow-covered tundra surface with negligible levels of solar radiation. The wind direction varied from NNE through ESE and the wind speeds ranged from 5 to 16 m/s. All model input files for this database can be found at the following link on EPA’s SCRAM website under the AERMOD Modeling System’s “Model Evaluation Data Bases.”
Table 1. Source parameters for Alaska North Slope.
Figure 3. Major buildings and stack inputs for the Alaska North Slope database. The surrounding buildings were neglected in the analysis and most had heights of 20 m or less.
https://www.epa.gov/scram/air-quality-dispersion-modeling-preferred-and-recommended-models#aermod
This database is unique in that the field sampling program was designed to measure plume impact during each hour because the monitors were portable and could be located based on the wind direction. For the other databases (i.e., Bowline and Balko), the only hours that showed plume impact was when the wind direction was blowing toward the receptors.
Bowline point
The Bowline Point database (Schulman and Hanna Citation1986) represents a full year (January 1981 through December 1981) of hourly data for a moderately buoyant source reflective of electric utility plants, which tests the models under a wide variety of meteorological conditions. Bowline Point is located on the western shore of the Hudson River approximately 37.5 miles north of the Battery at the southern tip of Manhattan. It consisted of two existing units that burn either natural gas or oil that produced a combined output of approximately 1,139 MW. Unit 1 began operation in September 1972 and Unit 2 began operation in May 1974. SO2 emissions were monitored over the course of a year (EPA Citation2003).
The SO2 monitors included: Bowline Point, Boat Ramp, Met Tower, and Parking Lot. These four monitors were located at distances from 251 to 848 m from the plant. The Bowline Point (Receptor 1) and Boat Ramp (Receptor 3) monitors recorded the highest and greater number of high concentration values than the other two monitors and were located directly downwind of the buildings. These are the two monitors that were used to evaluate PRIME2. Receptor 1 is 848 m southeast of the stack and Receptor 3 is 376 m southeast of the stack. The other monitors were excluded from the analysis because the measured concentrations were low and one of the other monitors was located in a direction were building downwash effects would not be significant. The other was located in an infrequent wind direction to provide an indicator of background concentrations.
The source parameters for Bowline Point are provide in . shows heights of the key buildings and stacks that were input into AERMOD. All model input files for this database can be found at the following link on EPA’s SCRAM website under the AERMOD Modeling System’s “Model Evaluation Data Bases.”
Table 2. Source parameters for bowline point.
Figure 4. Google 3D image of the bowline point powerplant with key buildings and stack heights.
https://www.epa.gov/scram/air-quality-dispersion-modeling-preferred-and-recommended-models#aermod
Balko, Oklahoma natural gas compressor station
Panek et al. (Citation2020) describes the Pipeline Research Council International (PRCI) ambient NO2 AERMOD performance assessment and model improvement project. The project developed a comprehensive dataset based on 13 months of monitoring (December 1, 2015 through December 31, 2016) at a compressor station near Balko, Oklahoma. The dataset included ambient monitoring of ozone (O3) and oxides of nitrogen (NOx and NO2), meteorological data, and reciprocating engine emissions. The main purpose of the Panek et al. (Citation2020) study was to compare predicted and observed NO2 concentrations. This includes the added complexity of predicting the conversion of NOx to NO2 which also requires the O3 observation. For this evaluation, only the NOx observations were used for model testing purposes since only building downwash effects are being evaluated and not plume chemistry.
NOx observations from the following monitoring stations (receptors) were used in this evaluation:
Receptor 1: Referred to as the Field Monitor which is 425 m due north;
Receptor 2: Referred to as the North Fence Monitor which is 149 m due north;
Receptor 3: Referred to as the East Fence Monitor which is 101 m to the east; and
Receptor 4: Referred to as the Tower Monitor which is 187 m WSW.
All distances are relative to stack C9. The stack parameters are listed in . Due to unforeseen circumstances, C10 did not operate during the monitoring program. EGEN and the Boiler operated intermittently. shows the key buildings and stack that were used as inputs in AERMOD.
Table 3. Source parameters for the Balko, OK field database.
Figure 5. Google image of the showing key dimensions of major buildings and stack for the Balko compressor station database. The main emitting stack location (C9) is also shown.
Other inputs included: hourly meteorological surface data from the 13 months of hourly on-site tower data supplemented by the Automated Surface Observing System (ASOS) station in Guymon, OK to complete periods of missing data (34 miles WNW of Balko); upper air soundings from Dodge City, KS (89 miles NE of Balko); hourly background O3 based on selecting the ambient monitor upwind of the sources for each hour; and hourly background NO2 concentrations for each hour also based on selecting the upwind monitor concentration. According to Panek et al. (Citation2020), this dataset has been made publicly available for use by EPA and the modeling community to further assess and improve AERMOD performance. This database can be obtained from the authors upon request.
Evaluation of PRIME2 performance
PRIME2 performance with and without the new plume rise entrainment coefficient was evaluated against the field databases to determine if PRIME2 estimates are better than current AERMOD estimates. The following sub-sections discuss the methodology, model evaluation for each database, overall model performance and a summary of the results.
Methodology
The model evaluation was designed to address the following questions (EPA Citation2003):
Does the new model provide good model predictions for the “right reason?”
How well does the new model predict the peak ground level concentrations that are used to assess compliance with NAAQS?
Is model performance significantly better than that of the current AERMOD with PRIME?
Regarding the first question, the PRIME2 theory is based on new analytical equations for turbulence increase and velocity deficit that agree well with wind tunnel observations (Petersen and Guerra Citation2018). The new entrainment coefficient is based on comparisons between wind tunnel and PRIME plume rise predictions.
Regarding the second question, the Robust Highest Concentration (RHC) was computed, and quantile-quantile (Q-Q) plots were created. Only hourly concentrations were evaluated as that is the most stringent air quality standard for most pollutants. The RHC represents a smoothed estimate of the highest concentrations, based on a tail exponential fit to the upper end of the concentration distribution (Cox and Tikvart Citation1990; Perry et al. Citation2005). This performance metric was computed for all databases using the following equation:
where n is number of values used to characterize the upper end of concentration distribution, is the average of the n-1 largest concentrations, C(n) is the nth largest value, and n = 26 for all databases as recommended by Cox and Tikvart (Citation1990). Even though the Alaska database had only 154 observations, 26 was used to be consistent with Perry et al. (Citation2005). RHC is a preferred statistic because it represents a high-end estimate while eliminating the influence of individual outliers.
Quantile-quantile (Q-Q) plots are created by sorting by rank the predicted and observed concentrations from a set of predictions initially paired in time and space. The sorted list of predicted concentrations is then plotted by rank against the observed concentrations also sorted from highest to lowest values. The observed and predicted pairs are no longer paired in time or space for the Alaska database and but are paired in space but not time for the Bowline Point and Balko databases. While scatter plots, which use data paired in time and space, provide a more rigorous test of model performance, EPA (Citation2003) found that these plots generally show very poor agreement due to model input uncertainties. Therefore, the Q-Q plot has been deemed a more pragmatic procedure for evaluating model performance especially for evaluating regulatory models.
According to Perry et al. (Citation2005), a good model should produce a concentration distribution (Q-Q plot) parallel to the slope of the measured distribution (one-to-one line) and produce high-end concentrations (RHCs) that are similar to that of the observations. Other methods could have been used for comparing the performance of the models but the focus here is on estimates at the high end of the concentration distribution. For this evaluation, the best model will have a Q-Q distribution that is closest to the 1:1 line based on visual examination and a ratio of predicted to observed RHC values closest to 1.0.
AERMOD model scenarios
AERMOD version 21112 was run for all databases according to the following scenarios:
AERMOD: Run in the default mode with the current PRIME building downwash algorithms.
AERMOD+Ent: Run in the default mode with the current PRIME building downwash algorithms with the PRIME plume rise entrainment constant β = 0.35 instead of the current value of 0.6. For this run the keyword AWMADWNW is used and the parameter AWMAENTRAIN is used.
PRIME2: Run with PRIME2 building downwash equations. For this run the keywords AWMADWNW and ORDDWNW are used and the parameters AWMAUEFF, AWMAUTURBHX and ORDCAV are used.
PRIME2+ Ent: Run with the PRIME2 building downwash theory and the PRIME plume rise entrainment constant β = 0.35. For this run the keywords AWMADWNW and ORDDWNW are used and the parameters AWMAUEFF, AWMAUTURBHX, AWMAENTRAIN and ORDCAV are used.
Model evaluation – Alaska North Slope
shows the Q-Q plot and predicted and observed RHC values for the four model scenarios based on 154 hourly average values. The Q-Q plot shows that the current AERMOD predictions parallel the 1:1 line with a slight tendency to overpredict. AERMOD+Ent also parallels the 1:1 line and tends to underpredict. PRIME2 consistently overpredicts by more than a factor two and PRIME2+ Ent shows better agreement but still overpredicts by a factor of 1.6 to 2.
Figure 6. Q-Q plots and predicted and observed robust highest concentrations (RHC) for the Alaska North Slope database.
The RHC results in show a similar trend. The current AERMOD has the best agreement with a ratio of predicted to observed RHC values of 1.06. AERMOD+Ent has the 2nd best agreement with a RHC ratio of 0.88. PRIME2+ Ent has a ratio of 1.59 while PRIME2 has a ratio of 3.08. Cleary for this database PRIME2 is not performing as well as AERMOD. The addition of the new entrainment coefficient did improve PRIME2 performance but not enough to outperform AERMOD.
Model evaluation – Bowline point
shows the Receptors 1 and 3 Q-Q plots and predicted and observed RHC values for the four model scenarios based on 8760 hourly average values. Frequently the predictions and observations for the receptors are combined so the results are not paired in space or time; however, unpairing in space like was done here provides the advantage of assessing the model performance at different distances downwind. In addition, when combining receptors, the top end of the distribution and RHC values will be dominated by only one receptor (i.e., the receptor with the highest concentrations).
Figure 7. Q-Q plots and predicted and observed robust highest concentrations (RHC) for the bowline point database, receptors 1 and 3.
The Q-Q plot for Receptor 1, which is 848 m southeast of stack 1, shows that the current AERMOD tends to underpredict concentrations above approximately 400 µg/m3 and overpredicts below that value. AERMOD+Ent overpredicts for concentrations above 200 µg/m3 and agrees well at lower values. PRIME2 agrees best for observations greater than 500 µg/m3 and overpredicts by more than a factor of 2 for at lower concentrations. PRIME2+ Ent show good agreement above 500 µg/m3 and tends to overpredict by a factor of approximately 1.5 at lower concentrations. None of the predictions parallel the 1:1 line.
The Q-Q plots for Receptor 3, which is 376 m southeast of stack 1, shows that the current AERMOD tends to agree well with observations for high concentrations (above ~450 µg/m3) and tends toward overpredicting by a factor of at 2 lower concentrations. AERMOD+Ent underpredicts at high concentrations and trends toward overpredicting at lower concentrations. PRIME2 consistently overpredicts by more than a factor of 1.5 to 2.0. PRIME2+ Ent shows the overall best agreement at high concentrations and tends to overpredict at lower concentrations.
The RHC results in for Receptor 1 show that PRIME2+ Ent has the best agreement with a RHC ratio of 1.13. PRIME2 has a ratio of 1.46 and AERMOD a ratio of 0.65 each tending to over and underpredict by about the same amount. AERMOD+Ent has a RHC ratio of 0.55. For Receptor 3 PRIME2+ Ent has a RHC ratio of 0.94 and AERMOD has a ratio of 0.92, both cases showing similar agreement. PRIME2 has a ratio of 1.11, also good agreement. AERMOD+Ent has a ratio of 0.80.
shows the geometric mean of RHC ratios for both receptors. A geometric mean is used because extreme values do not affect the mean as much. Note: the geometric mean is calculated by multiplying the numbers altogether and then taking the nth root of the multiplied numbers, where n is the total number of data values. Hereafter, the “geometric mean or the RCH values” will be referred as the “average ratio.” Cleary for this database, PRIME2+ Ent performs best with an average ratio of 1.03. PRIME2 has the second-best overall agreement with an average ratio of 1.27. AERMOD and AERMOD+Ent on the other hand tend to under predict with average ratios of 0.77 and 0.66.
Table 4. Summary of the ratio of predicted to observed RHC values for each database and the geometric mean RHC by database.
Model evaluation – Balko, Oklahoma
show the Receptors 1–4 Q-Q plots and predicted and observed RHC values for the four model scenarios based on 9528 hourly average values. As with Bowline Point, the analysis is paired in space but not time. The Q-Q plot for Receptor 1 which is 525 m due north of the stack shows that all model scenarios tend to underpredict with PRIME2 showing the least underprediction tendency and AERMOD+Ent the greatest underprediction tendency. The Q-Q plot for Receptor 2, which is 149 m due north of the stack, shows a similar trend as Receptor 1 except the underprediction tendency is even greater for all model scenarios. PRIME2 still has the least underprediction tendency. The Q-Q plots for Receptor 3, which is 101 m east of the stack, show significant scatter with PRIME2+ Ent showing the overall best agreement with more points close to the 1:1 line. PRIME2 and AERMOD have many predictions above the 1:1 line while AERMOD+Ent has the most predictions below the 1:1 line. For Receptor 4, which is 187 m WSW of the stack, the Q-Q plot for PRIME2 shows the best overall agreement while the other model scenarios tend to underpredict with the AERMOD+Ent scenarios showing the greatest underprediction tendency.
Figure 8. Q-Q plots and predicted and observed robust highest concentrations for the Balko, OK database, receptor 1 (Field Monitor).
Figure 9. Q-Q plots and predicted and observed robust highest concentrations for the Balko, OK database, receptor 2 (North Fence).
Figure 10. Q-Q plots and predicted and observed robust highest concentrations for the Balko, OK database, receptor 3 (East Fence).
Figure 11. Q-Q plots and predicted and observed robust highest concentrations for the Balko, OK database, receptor 4 (Tower Monitor).
The RHC results in show similar trends. For Receptor 1, PRIME2 show the best agreement with a RHC ratio of 0.88. The other scenarios have ratios ranging from 0.39 to 0.56. For Receptor 2, PRIME2 again shows the best agreement with a RHC ratio of 0.63. The other scenarios have ratios ranging from 0.30 to 0.40. For Receptor 3, PRIME2+ Ent show the best agreement with a RHC ratio of 0.99. AERMOD+Ent has a similar ratio of 0.97. PRIME2 and AERMOD have respective ratios of 1.30 and 1.34. For Receptor 4, PRIME2 shows the best agreement with a RHC ratio of 1.01. The other scenarios have ratios ranging from 0.39 to 0.78.
shows the geometric mean of RHC ratios for all receptors. For this database, PRIME2 performs best with an average ratio of 0.91. PRIME2+ Ent has the second-best agreement with an average ratio of 0.65. AERMOD also tends to underpredict with an average ratio of 0.61. For AERMOD+Ent the average ratio falls to 0.46.
Overall model performance
shows the geometric mean of RHC ratios for all databases and for all databases except Alaska North Slope. The reason to exclude Alaska North Slope is that it is a different type of database than Bowline Point or Balko. 43 hours of data were collected at many receptors whereas the other databases had about one year of data collected at a limited number of receptors.
Table 5. Summary of ratio of predicted to observed RHC values for each receptor and the geometric mean over all receptors.
Considering all databases, PRIME2 and PRIME2+ Ent had the best (closest to 1.0) average ratios of 1.2 and 0.84. The average AERMOD ratios were 0.70 and 0.56 showing a tendency to underpredict. With Alaska excluded, PRIME2 shows the best agreement with an average ratio of 1.03 and the average ratio drops to 0.75 for PRIME2+ Ent. The average AERMOD RHC ratios decreased to 0.66 and 0.52.
Summary and conclusions
This paper has discussed how the PRIME2 equations (Petersen and Guerra Citation2018) for predicting turbulence increase and velocity deficit and other enhancements were included in AERMOD as ALPHA options and provides detailed information on what keywords and parameters are needed to run AERMOD with the PRIME2 equations and other enhancements. One of the enhancements is the value set for the PRIME plume rise entrainment constant, β. A new value was recommended for the entrainment constant β based on research presented in this paper. The research showed that PRIME plume predictions with the β = 0.35 versus the current constant of 0.6 shows overall better agreement with plume rise observations. The other enhancements are the height of the wind speed used for computing ground-level concentration, the method used for computing concentrations in the cavity, and the constant used for the maximum ambient vertical turbulence intensity. The other enhancements are based on research carried out by Monbureau et al. (Citation2018). These enhancements are available as ALPHA options in AERMOD 21112 for research purposes only at this time and cannot be used for permitting applications. Before these ALPHA options can used for regulatory applications, additional evaluations against field databases are needed. After additional evaluations are carried out, the ALPHA options may become BETA options which is next step prior to the options becoming accepted for routine regulatory use.
Four different model scenarios were evaluated in this paper against three field databases, Alaska North Slope, Bowline Point and Balko, Oklahoma. The model scenarios are referred to as AERMOD, AERMOD+Ent, PRIME2, and PRIME2+ Ent. The first Scenario is the current AERMOD version 21112, the second AERMOD with the new entrainment constant (β = 0.35), the third AERMOD with the PRIME2 wake equations and ORD cavity enhancement, and the fourth AERMOD with the PRIME2 equations, ORD cavity enhancement and new entrainment constant. The model evaluation demonstrated that the PRIME2 scenario with or without the new entrainment constant provide a predicted to observed RHC geometric mean for all databases closest to one. PRIME2 with the current entrainment constant tended to overpredict with a predicted to observed geometric mean RHC of 1.2 and PRIME with the new entrainment coefficient tended to underpredict with a predicted to observed geometric mean RHC of 0.84. AERMOD underpredicted the observed RHC values with geometric mean predicted to observed RHC ratios of 0.70 and 0.56 with and without the new entertainment coefficient.
These results show that PRIME2 provides overall better agreement with observed RHCs than the current AERMOD thus meeting one the criteria for updating PRIME2 from an ALPHA option to a BETA option. Another criterion is whether PRIME2 gives favorable results for the right reason. This criterion is also met because the PRIME2 predictions of turbulence increase and velocity deficit agree well with wind tunnel observations whereas the PRIME equations show poor agreement (Petersen and Guerra Citation2018).
While this paper has shown that improvements have been made in AERMOD’s model prediction capability based on overall geometric mean RHCs, other research needs have also been identified. One of these includes building dimension inputs that currently are calculated by BPIPPRM, Building Profile Input Program for PRIME, (EPA Citation1995; Schulman et al. Citation1997). shows how the building dimension inputs are often incorrect and can make the building much larger than is realistic (Petersen and Guerra Citation2021). BPIPPRM calculates an effective length and width for the structure in indicated by the gray shaded area. Monbureau et al. (Citation2018) recommends that the building length be set to the length of the segment from B to C in with the width set to the BPIPPRM width. This approach provides more realistic inputs for cases like the one shown in . EPA has developed an updated BPIPPRM program that incorporates these updates (EPA Memorandum Citation2019). At the moment, this version of BPIPPRM cannot be used for regulatory purposes but it is available for testing and research purposes only.
Figure 12. Diagram showing the actual building and BPIP calculated building.
Other areas of AERMOD that need additional research and improvement (Monbureau et al. Citation2018; Petersen, Guerra, and Bova Citation2017) are as follows: treatment of the corner vortex that creates additional building downwash; plume centerline shift for buildings oriented diagonal to the flow; computation of streamlines in the building wake; and treatment of lattice and platform type structures.
Research and development of model building downwash improvements should be an ongoing process to help ensure a “sustainable” future where these improvements in model performance mitigate excessive under or over predictions in the regulatory model and allow for an optimum balance between the emissions associated with industrial development and protecting ambient air quality as advocated by Petersen and Guerra (Citation2021). This study has shown that improvements can be made in a rather quick manner and be included as ALPHA options in EPA model updates. The next challenge is to transition these options from ALPHA to BETA options and then finally to a default status. It should be noted that while changes to one algorithm in PRIME that correct a known error may show better agreement with observations it is possible that errors still exist in other algorithms, as mentioned herein, that compensate and may be part of the real reason for the better agreement. This provides further justification for the need for additional research and development to evaluate and improve the downwash algorithms if warranted.
Acknowledgment
The authors wish to acknowledge the financial and technical support from the American Petroleum Institute’s (API) Air Model Group as well as the technical support and review from the PRIME2 subcommittee of the Atmospheric Modeling and Meteorology Committee of the A&WMA.
Disclosure statement
No potential conflict of interest was reported by the author(s).
Data availability statement
All model input files and field observations for the Bowline Point and Alaska database can be found at the following link on EPA’s Support Center for Regulatory Air Modeling (SCRAM) web site under the AERMOD Modeling System’s “Model Evaluation Data Bases.”
https://www.epa.gov/scram/air-quality-dispersion-modeling-preferred-and-recommended-models#aermod.
All model input files and field observations for the Balko, OK database are available from the corresponding author, [RLP], upon reasonable request.
Additional information
Funding
Notes on contributors
Ron L. Petersen
Ron L. Petersen, Ph.D., CCM. President of Petersen Research and Consulting LLC. Dr. Petersen serves as Chair of the PRIME2 subcommittee of the Air and Waste Management Association’s (A&WMA) Atmospheric Modeling and Meteorology Committee.
James O. Paumier
James O. Paumier, Consultant. Mr. Paumier worked at an engineering and environmental consulting firm that had contracts with EPA in the maintenance and enhancement of the AERMOD Dispersion Modeling System.
Sergio A. Guerra
Sergio A. Guerra, Ph.D. Deputy Director for Stationary Sources, Air Pollution Control Division Of Colorado Department of Public Health and Environment. Dr. Guerra serves as the Chair of the Atmospheric Modeling and Meteorology Committee of the A&WMA.
References
- Banks, D., R. N. Meroney, P. P. Sarkar, Z. Zhao, and F. Wu. 2000. Flow visualization of conical vortices on flat roofs with simultaneous surface pressure measurement. J. Wind Eng. Ind. Aerodyn. 84 (1):65–85. doi:10.1016/S0167-6105(99)00044-6.
- Briggs, G. A. 1975. Plume rise prediction. Lectures on Air Pollution and Environmental Impact Analyses, Workshop Proceedings, 59–111. Boston: American Meteorological Society.
- Briggs, G. A. 1984. Plume rise and buoyancy effects. In Atmospheric science and power production, DOE/TIC-27601, ed. D. Randerson, 327–66. Technical Information Center, Office of Scientific and Technical Information, United States Department of Energy.
- Cimorelli, A. J., S. G. Perry, A. Venkatram, J. C. Weil, R. J. Paine, R. B. Wilson, R. F. Lee, W. D. Peters, and R. W. Brode. 2005. AERMOD: A dispersion model for industrial source applications. part I: General model formulation and boundary layer characterization. JAM 44:682–93.
- Contini, D., A. Donateo, D. Cesari, and A. G. Robins. 2011. Comparison of plume rise models against water tank experimental data for neutral and stable crossflows. J. Wind Eng. Ind. Aerodyn. 9 (5):539–53. doi:10.1016/j.jweia.2011.02.003.
- Cox, W., and J. Tikvart. 1990. A statistical procedure for determining the best performing air quality simulation model. Atmos. Environ. 24A (9):2387–95. doi:10.1016/0960-1686(90)90331-G.
- EPA. 1995. User’s guide to the building profile input program. EPA-454/R-93-038, U.S. Environmental Protection Agency, Office of Air Quality Planning and Standards, Technical Support Division, Research Triangle Park, North Carolina.
- EPA. 2003. AERMOD: Latest features and evaluation results. EPA-454/R-03-003, U.S. Environmental Protection Agency, Office of Air Quality Planning and Standards, Technical Support Division, Research Triangle Park, North Carolina.
- EPA. 2017. Guideline on air quality models, Appendix W to 40 CFR part 51. U.S. Environmental Protection Agency, Research Triangle Park, North Carolina. https://www.epa.gov/sites/production/files/2020-09/documents/appw_17.pdf.
- EPA. 2019. AERMOD model formulation and evaluation. EPA-454/R-19-014, U.S. EPA Office of Air Quality Planning and Standards, Research Triangle Park, NC.
- EPA. 2021. User’s guide for the AMW/EPA regulatory model (AERMOD). EPA-454/B-21-001, U.S. Environmental Protection Agency, Research Triangle Park, North Carolina.
- EPA Memorandum. 2019. Release of BPIPPRM, version 19191_DRFT, for public review and comment. August 21. https://www3.epa.gov/ttn/scram/models/relat/BPIPPRM_19191_DRFT-Trans_Memo.pdf.
- Foroutan, H., W. Tang, D. K. Heist, S. G. Perry, L. H. Brouwer, and E. M. Monbureau. 2018. Numerical analysis of pollutant dispersion around elongated buildings: An embedded large eddy simulation approach. Atmos. Environ. 187:117–30. doi:10.1016/j.atmosenv.2018.05.053.
- Guenther, A., B. Lamb, and E. Allwine. 1989. Building wake dispersion at an Arctic industrial site: Field tracer observations and plume model evaluations. Atmos. Environ. 24A:2329–47.
- Hoult, D. P., and J. C. Weil. 1972. Turbulent plume in a laminar cross flow. Atmos. Environ. V6 (8):513–31. doi:10.1016/0004-6981(72)90069-8.
- Huber, A., and W. Snyder. 1982. Wind tunnel investigation of the effects of a rectangular-shaped building on dispersion of effluents from short adjacent stacks. Atmos. Environ. 16 (12):2837–48.
- Kukkonen, J., J. Nikmo, M. Sofiev, K. Riikonen, R. Petaja, A. Virkkula, L. Levula, S. Schobesberger, and S. D. Webber. 2014. Applicability of an integrated plume rise model for the dispersion from wild-land fires. Geosci. Model Dev. 7 (6):2663–81. doi:10.5194/gmd-7-2663-2014.
- Monbureau, E. M., D. K. Heist, S. G. Perry, L. H. Brouwer, H. Foroutan, and W. Tang. 2018. Enhancements to AERMOD’s building downwash algorithms based on the wind-tunnel and embedded-LES modeling. Atmos. Environ. 17:321–30. doi:10.1016/j.atmosenv.2018.02.022.
- Ooms, G. 1972. A new method for the calculation of the plume path of gases emitted by a stack. Atmos. Environ. 6 (12):899–909. doi:10.1016/0004-6981(72)90098-4.
- Panek, J. A., J. M. McCarthy, A. Z. Huth, and C. Nowak. 2020. PRCI ambient NO2 AERMOD performance assessment and model improvement project: Modeled to observed comparison. J. Air Waste Manage. Assoc. 70 (5):504–21. doi:10.1080/10962247.2020.1743382.
- Perry, S. G., A. J. Cimorelli, R. J. Paine, R. W. Brode, J. C. Weil, A. Venkutram, R. B. Wilson, R. F. Less, and W. D. Peters. 2005. AERMOD: A dispersion model for industrial sources applications. Part II. Model performance against 17 field study databases. J. Appl. Meteorol. 44 (5):694–708. doi:10.1175/JAM2228.1.
- Perry, S. G., D. K. Heist, L. H. Brouwer, E. M. Monbureau, and L. A. Brixey. 2016. Characterization of pollutant dispersion near elongated buildings based on wind tunnel simulations. Atmos. Environ. 142:286–95. doi:10.1016/j.atmosenv.2016.07.052.
- Petersen, R. 1987. Performance evaluation of integral and analytical plume rise algorithms. JAPCA 37 (11):1314–19. doi:10.1080/08940630.1987.10466327.
- Petersen, R. L., and S. A. Guerra. 2018. PRIME2. Development and evaluation of improved building downwash algorithms for rectangular and streamlined structures. J. Wind Eng. Ind. Aerodyn. 173:67–78. https://doi.org/10.1016/j.jweia.2017.11.027.
- Petersen, R. L., and S. A. Guerra. 2021. Development and implementation of new building downwash options in AERMOD. EM Magazine, A&WMA, April.
- Petersen, R. L., S. A. Guerra, and A. S. Bova. 2017. Critical review of the building downwash algorithms in AERMOD. J. Air Waste Manage. Assoc. 67 (8):826–35. http://www.tandfonline.com/doi/full/10.1080/10962247.2017.1279088.
- Petersen, R., and J. Reifschneider. 2006. Wind tunnel modeling evaluation for the Mirant Potomac power generating station. CPP Report 05-3527, CPP, Inc, Windsor, CO.
- Schulman, L. L., and S. R. Hanna. 1986. Evaluation of downwash modifications to the industrial source complex model. J. Air Pollut. Control Assoc. 36 (3):258–64. doi:10.1080/00022470.1986.10466066.
- Schulman, L. L., D. G. Strimaitis, and J. S. Scire. 1997. Addendum to ISC3 user’s guide: The PRIME plume rise and building downwash model. Submitted by EPRI, May 12. https://www3.epa.gov/ttn/scram/7thconf/iscprime/useguide.pdf.
- Schulman, L., D. Strimaitis, and J. Scire. 2000. Development and evaluation of the PRIME plume rise and building downwash model. J. Air Waste Manage. Assoc. 50 (3):378–90. https://www3.epa.gov/scram001/7thconf/iscprime/tekpapr1.pdf.
- Snyder, W. H., and R. E. Lawson. 1994. Wind-tunnel measurements of flow fields in the vicinity of buildings. Technical Paper Presented at the Eighth Joint Conference on Applications of Air Pollution Meteorology with the A&WMA, Nashville, TN, January 23–28. Accessed January 23–28, 1994. https://cfpub.epa.gov/si/si_public_record_Report.cfm?dirEntryID=41445.
- Weil, J. C. 1996. A new dispersion model for stack sources in building wakes. Technical Paper presented at the Ninth Joint Conference on Applications of Air Pollution Meteorology with the Air & Waste Management Association, Atlanta, GA, January 28–February 2.