
ABSTRACT
The apportionment of the contribution of wood smoke emitted particles to the total concentration of particulate matter in a region has been greatly aided by the development of new analytical methods. These analytical methods quantitatively determine organic marker compounds unique to wood combustion such as levoglucosan and dehydroabietic acid. These markers have generally been determined in 24-hour averaged samples. We have developed an instrument based on the collection of particles on an inert filter, desorption of the organic material in an inert atmosphere with subsequent GC separation and MS detection of the desorbed compounds. The GC-MS Organic Aerosol Monitor (OAM) instrument has been used in three field studies. An unexpected finding from these studies was the quantification of the contribution of secondary organic aerosols from gases present in wood smoke in addition to primary wood smoke emitted particles. The identification of this secondary material was made possible by the collection of hourly averaged data that allowed for the time patterns of black carbon, organic material, and wood smoke marker compounds to be included and compared in a Positive Matrix Factorization (PMF) analysis. Most of the organic markers associated with wood smoke (levoglucosan, stearic acid and dehydroabietic acid) are associated with primary wood smoke emissions, but a fraction of the levoglucosan and stearic acid are also associated with secondary organic material formed from gaseous precursors in wood smoke. Additionally, this secondary material was shown to be present in each in of the three urban area where wood smoke burning occurs. There is a need for additional studies to better understand the contribution of secondary particulate formation from both urban and wildfires.
Implications: This paper presents results from three field studies which show that in addition to the formation of primary particulate matter from the combustion of wood smoke and secondary particulate matter is also formed from the gaseous compounds emitted with the wood smoke. This material is identified in the studies of wood combustion reported here by the identification and quantification of specific organic marker compounds related to wood combustion and is shown to and represents a contributor nearly as large as the primary emitted material and better quantifying the impact of wood combustion on airborne fine particulate matter.
Introduction
The application of source apportionment to the atmospheric pollution has been recently reviewed (Hopke et al. Citation2020). This review points out the infrequency of specific identification of wood smoke emission. The apportionment of the contribution of wood smoke emitted particles to PM2.5 has been greatly aided by the development of analytical methods for the quantitative determination of organic marker compounds unique to wood combustion such as levoglucosan (Lin, Lee, and Eatough Citation2010). However, these markers have generally been measured in 24-hour samples. As a result, organic marker compounds in PM2.5 have generally not been included in field studies where the source apportionment analysis has been conducted on an hourly averaged basis (Cropper et al. Citation2017; Eatough and Farber Citation2009; Eatough et al. Citation2008; Grover and Eatough Citation2008; Hansen et al. Citation2010; Pancras et al. Citation2011, Citation2013) due to limitations in available sampling techniques (Elsasser et al. Citation2012). We have developed an instrument capable of hourly average measurement of PM2.5 organic marker compounds based on collection of particles on an inert filter, desorption of the organic material in an inert atmosphere with subsequent GC separation and MS detection, the GC-MS Organic Aerosol Monitor (OAM) (Cropper et al. Citation2017). The use of hourly averaged data in a PMF source apportionment greatly improves the ability to sort out sources whose presence is depended on the diurnal cycle of both emissions and conversion processes. For example, the identification of sources associated with the combustion of wood which is generally a night event becomes possible where clear identification of this source based on 24 hour data is more difficult. This instrument has now been used by us in three field studies. (Cropper et al. Citation2018, Citation2019; Hansen and Eatough Citation2020) An unexpected finding from these studies was the quantification of the contribution of secondary organic aerosols from gases present in wood smoke in addition to primary wood smoke emitted particles. The identification of secondary material was made possible by the creation of hourly averaged data which allowed the time patterns of black carbon, organic material, and wood smoke marker compounds to be compared in a PMF analysis. Most of the markers associated with wood smoke (levoglucosan, stearic acid and dehydroabietic acid) are associated with primary wood smoke emissions, but a fraction of the levoglucosan and stearic acid can be associated with secondary organic material formed from gaseous precursors in wood smoke. The findings from these three studies are compared here. Because each of the studies has been published, details of the studies are only outlined.
2015 study on the Brigham Young University Campus, Provo, UT (Cropper et al. Citation2018)
Overview
A study was conducted on the Brigham Young University campus during January and February 2015 to identify winter-time sources of fine particulate material in Provo city, Utah Valley, Utah. Hourly average measurements made in the study included:
Fine particulate mass
PM2.5 mass was measured using an R&P model 8599 FDMS (Filter Dynamics Measurement System) Tapered Element Oscillating Microbalance (TEOM) sampler (Chapel Hill, NC). The FDMS TEOM measures all fine particulate mass, including ammonium nitrate and semi-volatile organic material, but does not measure fine particulate water (Grover et al. Citation2004).
Fine particulate cations and anions
A URG model 9000D ambient ion monitor (AIM) was used to measure both gas phase and particulate phase ammonium, sulfate and nitrate species. Dionex IonPac columns were used to quantify both the cation and anion concentrations. Cations analysis were performed with a CS12A-5 μm 3 × 150 mm column, and a AS14A-5 μm 3 × 150 mm column was used for anion analysis. The AIM instrument has already been described in a study involving the composition and secondary formation of fine particulate matter in the Salt Lake Valley (Cropper et al. Citation2017). The only ions present in significant concentrations were nitrate, sulfate, and ammonium ions, with reasonable equivalent balance between the anions and the cations. Ammonium nitrate and ammonium sulfate were the species used in the PMF analysis.
Carbonaceous material
Black carbon (the absorption measured at 800 nm) and ultraviolet (UV)-absorbing carbon (measured at 325 nm) were determined with a dual-wavelength aethalometer (Anderson Instruments, model RTAA-900). Aerosol organic material was estimated from the FDMS-measured PM2.5 minus all the measured PM constituents. Fine particulate crustal material was not measured during the study. Based on past measurements along the Wasatch Front (Long et al. Citation2002, Citation2003), this introduced an error of less than 1 μg/m3 in the organic material estimate.
Gas-phase species
Concentrations of gas-phase ammonia and nitric acid were obtained from the URG model 9000D AIM ion chromatography (IC) data. The concentrations of NOx,NO, and NO2 were measured using a Thermo model 42NOx analyzer. Ozone was measured using a Teledyne model 400S ozone monitor. It was recognized that concentrations of CO would be valuable in the PMF analysis, but this gas-phase primary emission species was not measured. However, CO and NOx were measured at the State of Utah Division of Air Quality North Provo station, located just 1.2 km from the study sampling station. It was assumed that the ratio of CO to NOx would be the same at the two sampling sites. During the time period used in the PMF analysis, CO and NOx were linearly related at the North Provo site, with a slope of 111 ppb NOx/ppm CO and r2 = 0.916. This relationship was used to estimate CO at the BYU sampling site using the NOx concentrations measured at the BYU site.
Organic marker compounds
Organic marker compounds measured included levoglucosan, dehydroabietic acid, stearic acid, pyrene, and anthracene. Measurements were made using the GC-MS OAM that has been previously described (Cropper et al. Citation2017).
PMF analysis
A total of 248 hourly averaged data sets were available for a positive matrix factorization (PMF) analysis of sources of both primary and secondary fine particulate material. A total of nine factors were identified. Details of the PMF analysis have been published (Cropper et al. Citation2018). Identified factors are shown in .
Figure 1. Pie chart of the fraction of the total PM2.5 identified with the nine factors. The Chi2 value is that for the final PMF result.
The major factor was identified as secondary ammonium nitrate and accounted for 40.6% on average of the total PM2.5 mass. A smaller, secondary factor was identified and found to be correlated with the production of ozone, with 100% of the ozone contained in this factor. Additional smaller factors were identified and attributed to diesel and auto traffic based on their time patterns and the presence or lack of significant black carbon. Another small factor contained 100% of the anthracene and appeared during the day on January 19 and 25 and February 12 and 13. The first two days are a Monday holiday and a Sunday and the last two a Thursday and a Friday. This factor is presumable traffic related, but the exact source of the emissions was not identifiable from the results (Cropper et al. Citation2019).
The remaining four factors contained all the levoglucosan, as indicated in . The presence of wood smoke emissions was associated with all the levoglucosan, stearic acid, dehydroabietic acid, and pyrene markers. Thirty-four percent of the levoglucosan was present in the Wood Smoke Factor along with 21% of the dehydroabietic acid. This factor accounted for 4.62 μg/m3 of PM2.5 and 3.89 μg/m3 of the organic material. Two smaller factors associated with wood smoke accounted for 0.13 μg/m3 of PM2.5 and 0.05 μg/m3 of the organic material and all of the stearic acid, and for 0.39 μg/m3 of PM2.5 and 0.05 μg/m3 of the organic material and all of the pyrene and 79% of the dehydroabietic acid. The OM factor accounted for 50% of the organic material and for 21% of the levoglucosan. A comparison of the diel patterns of the Wood Smoke and OM factors is given in , and a comparison of their composition is given in .
Figure 2. Distribution of levoglucosan among the four factors where levoglucosan was present.
Figure 3. Comparison of the diel patterns of the wood smoke and the OM Related Factors. The hash mark under the X axis indicates a weekend. The concentration of BC associated with the Wood Smoke Factor is also given. BC was not present in the Secondary OM Related Factor.
Figure 4. Comparison of the wood smoke and the OM factor compositions.
The composition of both the Wood Smoke and OM Factors, are dominated by levoglucosan and organic material, suggesting that both may be related to emissions from wood smoke. In addition, the black carbon seen in the Wood Smoke factor, , was not present in the OM Factor, suggesting that the OM factor may be secondary in nature. Furthermore, the OM factor was also present dominantly at night. These observations all suggest that the OM Factor is a secondary material formed in wood smoke after it is emitted. It is expected, since wood smoke emissions will dominate over regional gaseous organic compounds during winter inversions in the valley, that the source of the added SOA will be associated with gaseous wood smoke emissions. These observations were not made in the original publication of this PMF study (Cropper et al. Citation2018). However, based on the results of a subsequent study conducted in Salt Lake Valley (Cropper et al. Citation2019) we postulate that this factor is secondary organic material formed from gaseous precursors in the emissions from wood smoke.
2016 study on the Neil Armstrong Campus, West Valley City, Salt Lake Valley, UT (Cropper et al. Citation2010)
A source apportionment study was conducted at the Neil Armstrong Academy campus, 5194 Highbury Pkwy, West Valley City, UT 84120, during January and February 2016. Among the objectives of the study was to identify winter-time sources of fine particulate material in West Valley City, Utah. Fine particulate mass and its composition including organic marker and related gas phase species were all measured on an hourly average basis. The following hourly averaged data were used in the Positive Matrix Factorization (PMF) analysis, fine particulate mass, cations and anions, carbonaceous material (NVOM, Nonvolatile Organic Material measured with a Sunset monitor, SVOM, Semi-Volatile Organic material estimated as the FDMS TEOM total PM2.5 minus species, Aethalometer measured BC and UV carbon), organic marker compounds, gas phase species including NOX, NO, NO2 and CO and mass spectrometric measurements of gas phase methanol and C8 aromatics.
The location of the Armstrong study is substantially different from that of the BYU study. The BYU study was conducted on campus at the edge of a plateau facing the Provo urban area. The campus is surrounded by housing. In contrast, the Armstrong study is an elementary school focused on STEM (science, technology, engineering, and math) education located in the northwestern part of Salt Lake Valley. It is at the northern boundary of the urban area, 7 miles east of the Rio Tinto Kennecott Smelter and Refinery and Power Plant, and 9 miles south of the Salt Lake International Airport with shipping and related industry related to the airport to the north and west side of the campus. The Great Salt Lake is located 10 miles to the north and west of campus and prevailing winds at the sampling site are from this direction.
PMF analysis
A total of 557 hourly averaged data sets were available for a positive matrix factorization (EPA PMF) analysis of sources of both primary and secondary fine particulate material. A total of seven factors were identified. Details of the PMF analysis have been published (Cropper et al. Citation2018). Identified factors are shown in .
Figure 5. Pie chart of the fraction of the total PM2.5 identified with the seven factors.
The major factor was identified as secondary ammonium nitrate and 56.4% on average of the total PM2.5 mass was in the form of ammonium nitrate. About 12% of the PM2.5 mass was identified as diesel fuel related emissions. Another 12% of the PM2.5 mass was associated with auto traffic. Both of these sources were assigned to diesel or auto related based on their time patterns and the presence or lack of significant black carbon. A similar fraction was identified as fugitive emissions from the copper smelter located west of the sampling site based on the presence of SO2 and wind back trajectories.
The remaining four factors contained all of the levoglucosan, as indicated in with 4% being associated with the Diesel Factor. The presence of wood smoke emissions was associated with all the remaining levoglucosan, with 96% of the stearic acid, 96% of dehydroabietic acid, and 92% of the stearic acid.
Figure 6. Distribution of levoglucosan among the four factors where levoglucosan was present.
The factor identified as Wood Smoke, , is present at an average of 0.39 μg/m3, although it is only sporadically present. It is present only in the evening and tends to be present on weekends. The mass of this factor is not well explained by the PMF results (ratio of components to mass of 0.69). It consists of 20% NVOM, 17% SVOM and 3% ammonium nitrate. These characteristics are all typical of a factor dominated by wood smoke emissions. In addition, the presence of levoglucosan (64% of the total) and dehydroabietic acid (96% of the total) in this profile are also consistent with this assumption. The factor also contains 90% of the adipic acid.
This factor accounted for only 0.38 μg/m3 of PM2.5 and 0.26 μg/m3 of the organic material. The much smaller fraction of the Wood Smoke PM2.5 in the Armstrong study can be attributed to the location of the sampling site as discussed previously. The two Secondary Wood Smoke factors accounted for 5.2% of the PM2.5, 3.0% of the organic material and for 21% of the levoglucosan.
A comparison of the diel patterns of the Wood Smoke and the Secondary Wood Smoke OM factors is given in , and a comparison of their composition is given in . As expected, one of the other of the two Secondary Wood Smoke factors is always present along with the Primary Wood Smoke Factor. However, the relative amount of the OM2 Factor, compared to the other factors is significantly higher during the time period of February 13 to 15. Also shown is the concentrations of the Ammonium Nitrate Factor (divided by 3). This factor was present at high concentrations (peaking at 60 μg/m3) during the February 13 to 15-time period but was not present at high concentrations during the other time periods when the OM2 factor was present, . This observation probably accounts for both the high fraction of ammonium nitrate in the Secondary Wood Smoke Factor, and for the seemingly high concentrations of the OM2 factor during April 13 to 15. If the Secondary Wood Smoke was formed in a plume of ammonium nitrate, formation of secondary particles on the existing ammonium nitrate particles would be expected. If we assume that this was the case and correct the Secondary Wood Smoke for the non-wood smoke originated material, we obtain the composition given in the last pie of . This composition is more consistent with the Secondary Wood Smoke composition observed in the BYU study. This assumption results in reducing the concentration of Secondary Wood Smoke formed from wood smoke emitted gases to 0.44 μg/m3.
Figure 7. Comparison of the diel patterns of the wood smoke, the Wood Smoke Secondary OM Related Factors and the concentrations of the Ammonium Nitrate factor. Hash marks under the X axis indicate weekends.
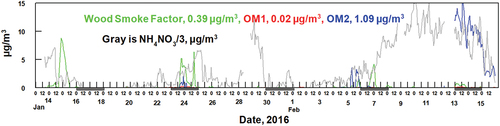
Figure 8. Comparison of the Primary Wood Smoke and Secondary Wood Smoke Factor compositions and the Secondary Wood Smoke Factor composition adjusted for the effect of ammonium nitrate (see text).
2019 study at Bountiful City, Salt Lake Valley, UT (Hansen and Eatough Citation2020)
A combined source apportionment – back trajectory analysis study was conducted during February – April 2019 at the Bountiful sampling site located at Bountiful Viewmont High School, 171 W. 1370 N. Bountiful, UT (EPA AIRS code: 490110004) (Hansen and Eatough Citation2020). The focus of this study was not the PMF identification of sources of PM2.5, but rather the identification of sources of dichloromethane and formaldehyde. Historic data indicates that this site has elevated concentrations of dichloromethane, with concentrations occasionally seen that would result in increased health impacts on the population with respect to the cancer risk due to exposure to dichloromethane. However, the study did produce data relative to the formation of both primary and secondary wood smoke and that will be the focus of this section of the manuscript. A PMF analysis of PM2.5 was conducted to understand the contribution of diesel exhaust to dichloromethane.
PMF analysis
The PMF analysis from the Bountiful data set were limited to focus on identification of primary sources of PM2.5. This constraint was imposed because potential secondary contributors to PM2.5 were not measured during the study. The data available for the PMF analysis was limited to the following:
PM2.5 mass was measured using an R&P Model 8599 FDMS (Filter Dynamics Measurement System) Tapered Element Oscillating Microbalance (TEOM) sampler. The FDMS TEOM measures all fine particulate mass including ammonium nitrate and semi-volatile organic material but does not measure fine particulate water. (Grover and Eatough Citation2008; Grover et al. Citation2008)
Two-hour averaged data for a 7 channel aethalometer.
Two-hour averaged data measured with the GC-MS OAM (Cropper et al. Citation2017). This included levoglucosan, fluorene, pyrene, stearic acid and anthracene.
A total of 14 parameters and 493 two-hour averaged data sets were available for a positive matrix factorization (EPA PMF) analysis of sources of primary fine particulate material. A total of four factors were identified. This included Primary Wood Smoke, Diesel Emissions, Auto Emissions and PM2.5 not accounted for in the PMF analysis. Details of the PMF analysis are available (Hansen and Eatough Citation2020). Identified factors are shown in .
Figure 9. Pie chart of the fraction of the total PM2.5 identified with the four factors.
There are several periods in the data set when concurrent peaks are seen in the missing mass and wood smoke data shown in . The elliptical circles in highlight the more prominent occurrences. It seems reasonable, based on our previous observations, (Cropper et al. Citation2018, Citation2019) to postulate these are due to secondary aerosol formed from gases emitted during the combustion of wood. The estimation of the ratio of primary to secondary wood smoke is difficult because of the lack of direct apportionment of secondary material in this study, the possible presence of other sources during the time periods highlighted, and the uncertainty of where base lines for the observed peaks should be drawn. However, if we assume this ratio is roughly constant, as was observed in our previous studies, the best estimate of the ratio may be made for the data on February 27. Integration of these data with the estimate that the wood smoke factor data identify a reasonable base line give a ratio of secondary to primary wood smoke aerosol of 0.79. This gives the diel pattern for the estimated concentrations of secondary wood smoke aerosol shown in . The remaining aerosol is labeled PM2.5 Other in . This last category will be due to secondary aerosols such as ammonium sulfate or ammonium nitrate. A pie chart of the aerosol composition based on this analysis is shown in .
Figure 10. Comparison of the measured concentrations of PM2.5, the PM2.5 not accounted for in the PMF analysis and the concentrations of the Primary Wood Smoke Factor. Hash marks under the X axis indicate weekends.
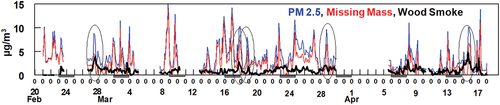
Figure 11. Diel patterns for measured PM2.5, the three factors identified in the PMF analysis and assignment of the remaining unidentified mass into two classes, see text. Hash marks under the X axis indicate weekends.
Figure 12. Pie chart of the PM2.5 composition based on analysis of the PMF results.
Discussion
A comparison of the concentrations of primary and secondary wood smoke identified in the three studies discussed are given in .
Figure 13. A comparison of the results for primary and secondary wood smoke in studies at BYU, Armstrong and Bountiful.
As indicated, both secondary and primary wood smoke were identified in all three studies with the concentrations of secondary wood smoke being comparable too or slightly less than the concentrations observed for primary wood smoke. The significantly lower concentrations of wood smoke at Armstrong as compared to BYU is attributed to the locations of the two sampling sites relative to the urban population. The lower concentrations seen at Bountiful, compared to BYU can be attributed to the Bountiful study being conducted in the spring, rather than in winter.
While all three studies provide consistent evidence for the formation of secondary wood smoke from the gaseous volatile compounds emitted during the combustion of wood, the results given provide no information on the exact chemistry or the kinetics involved in the formation of secondary wood smoke aerosols. There is a need for the further identification of the chemistry associated with the formation of secondary wood smoke aerosols. Studies of similar chemistry associated with wildfire emission would also appear warranted A recent presentation by Garafaldo et al. (Citation2021) on aging in wildfire plumes indicates the formation of secondary wood smoke particulate matter is seen in the aging plume.
Disclosure statement
No potential conflict of interest was reported by the author(s).
Data availability statement
The authors confirm that the data supporting the findings of this study are available within the article and within the references to the three discussed studies [and/or] their supplementary materials.
Additional information
Notes on contributors
Delbert J. Eatough
Delbert J. Eatough is a Professor of Chemistry Emeritus at Brigham Young University.
Nitish Bhardwaj
Nitish Bhardwaj is a graduate student in chemistry at Brigham Young University.
Paul M. Cropper
Paul M. Cropper is a consultant.
Robert A. Cary
Robert A. Cary is President of Sunset Laboratory.
Jaron C. Hansen
Jaron C. Hansen is a Professor of Chemistry at Brigham Young University.
References
- Cropper, P. M., N. Bhardwaj, D. K. Overson, J. C. Hansen, D. J. Eatough, R. A. Cary, R. Kuprov, and M. Baasandor. 2010. Source apportionment analysis of winter 2016 Neil Armstrong Academy data (West Valley City, Utah). Atmos. Environ. 219 (68):1–12.
- Cropper, P., N. Bhardwaj, D. K. Overson, J. C. Hansen, D. J. Eatough, R. A. Cary, R. Kuprov, and M. Baasandor. 2019. PMF analysis of winter 2016 Neil Armstrong Academy Data (West Valley City, UT). Atmos. Environ. 219:116971. doi:10.1016/j.atmosenv.2019.116971.
- Cropper, P. M., D. J. Eatough, D. K. Overson, J. C. Hansen, F. Caka, and R. A. Cary. 2018. Use of a gas chromatography–mass spectrometry organic aerosol monitor for in-field detection of fine particulate organic compounds in source apportionment. J. Air Waste Manage. Assoc. 68 (5):390–402. doi:10.1080/10962247.2017.1363095.
- Cropper, P. M., D. K. Overson, R. A. Cary, D. J. Eatough, J. C. Chow, and J. C. Hansen. 2017. Development of the GC-MS organic aerosol monitor (GC-MS OAM) for in-field detection of particulate organic compounds. Atmos. Environ. 169:258–66. doi:10.1016/j.atmosenv.2017.09.019.
- Eatough, D. J., and R. Farber. 2009. Apportioning visibility degradation to sources of PM 2.5 using positive matrix factorization. J. Air Waste Manage. Assoc. 59 (9):1092–110. doi:10.3155/1047-3289.59.9.1092.
- Eatough, D. J., B. D. Grover, W. R. Woolwine, N. L. Eatough, R. Long, and R. Farber. 2008. Source apportionment of 1h semi-continuous data during the 2005 study of Organic Aerosols in Riverside (SOAR) using positive matrix factorization. Atmos. Environ. 42 (11):2706–19. doi:10.1016/j.atmosenv.2007.07.038.
- Elsasser, M., M. Crippa, J. Orasche, P. F. DeCarlo, M. Oster, M. Pitz, J. Cyrys, T. L. Gustafson, J. B. C. Pettersson, J. Schnelle-Kreis, et al. 2012. Organic molecular markers and signature from wood combustion particles in winter ambient aerosols: Aerosol mass spectrometer (AMS) and high time-resolved GC-MS measurements in Augsburg, Germany. Atmos. Chem. Phys. 12 (14):6113–28. doi:10.5194/acp-12-6113-2012.
- Garofalo, L. A., B. P. Palm, J. A. Thornton, R. P. Pokhrel, S. M. Murphy, S. M. Kreidenweis, and D. K. Farmer. 2021. Emission and evolution of submicron organic aerosol in wildfire smoke: Aerosol mass, chemical composition, and optical properties. Proceedings, Armospheric Optics: Aerosols, Visibility, and the Radiative Balance. Bryce Canyon Utah: Air and Waste Management Association.
- Grover, B. D., and D. J. Eatough. 2008. Source apportionment of one-hour semi-continuous data using positive matrix factorization with total mass (Nonvolatile plus Semi-Volatile) measured by the R&P FDMS monitor. Aerosol Sci. Technol. 42 (1):28–39. doi:10.1080/02786820701787910.
- Grover, B., N. L. Eatough, P. K. Hopke, and D. J. Eatough. 2004. Measurement of fine particulate mass, including the semi-volatile constituents, with a GRIMM monitor. Proceedings of the Symposium on Air Quality Measurement Methods and Technology. Pittsburgh, PA: A&WMA.
- Grover, B., N. L. Eatough, P. K. Hopke, and D. J. Eatough. 2008. Measurement of fine particulate mass, including the semi-volatile constituents, with a GRIMM monitor. Proceedings, Measurements Symposium, Air and Waste Management Association, Paper # 51, Chapel Hill, NC.
- Hansen, J., and D. J. Eatough. 2020. Bountiful city Dichloromethane and Formaldehyde apportionment study, final report to the Utah division of air quality.
- Hansen, J. C., R. W. Woods, B. L. Bates, J. M. Clark, R. Y. Kuprov, P. Mukherjee, J. A. Murray, M. A. Simmons, M. F. Waite, N. L. Eatough, et al. 2010. Semicontinuous PM 2.5 and PM 10 mass and composition measurements in Lindon, Utah, during Winter 2007. J. Air Waste Manage. Assoc. 60 (3):346–55. doi:10.3155/1047-3289.60.3.346.
- Hopke, P. K., Q. Dai, L. Li, and Y. Feng. 2020. Global review of recent source apportionments for airborne particulate matter. Sci. Total Environ. 740:140091. doi:10.1016/j.scitotenv.2020.140091.
- Lin, L., M. L. Lee, and D. J. Eatough. 2010. Review: Recent advances in detection of organic compound markers in fine particulate matters and their use for source apportionment. J. Air Waste Manage. Assoc. 60 (1):3–25. doi:10.3155/1047-3289.60.1.3.
- Long, R. W., N. L. Eatough, N. F. Mangelson, W. Thompson, K. Fiet, R. Eatough, D. J. Smith, C. A. Wilson, and W. E. Pope. 2003. The measurement of PM2.5, INCLUDING SEMI-VOLATILE COMPOnents, in the EMPACT program: Results from the Salt Lake City Study. Atmos. Environ. 37 (31):4407–17. doi:10.1016/S1352-2310(03)00585-5.
- Long, R. W., R. Smith, S. Smith, N. L. Eatough, N. F. Mangelson, D. J. Eatough, C. A. Pope, III, and W. E. Wilson. 2002. Sources of Fine Particulate Material Along The Wasatch Front. Energy Fuels 16 (2):282–93. doi:10.1021/ef010168l.
- Pancras, J. P., M. Landis, G. A. Norris, R. Vedantham, and J. T. Dvonch. 2013. Source apportionment of ambient fine particulate matter in Dearborn, Michigan, using hourly resolved PM component composition data. Sci. Tot. Environ. 448:2–13. doi:10.1016/j.scitotenv.2012.11.083.
- Pancras, J. P., R. Vedanthan, M. S. Landis, G. A. Norris, and J. M. Ondov. 2011. Application of EPA unmix and nonparametric wind regression on high time resolution trace elements and speciated Mercury in Tampa, Florida Aerosol. Environ. Sci. Technol. 45 (8):3511–18. doi:10.1021/es103400h.