
ABSTRACT
Most Caribbean islands do not have air pollution surveillance programs. Those who live in these countries are exposed to ambient air pollution from a variety of sources including motor vehicles, ocean-going vessels, and Saharan dust. We conducted an air sampling exposure study in Grenada to describe daily changes in fine particulate matter (PM2.5) pollution, and during Saharan dust episodes. Further, we assessed the impacts of COVID-19 public health interventions on PM2.5 concentrations in 2020. Four fixed-site PurpleAir monitors were installed throughout Grenada, and one on the neighboring island of Carriacou. PM2.5 was measured between January 6 and December 31, 2020. We classified each of these days based on whether COVID-19 public health mitigation measures were in place or not. Descriptive analyses were performed to characterize fluctuations in PM2.5, and we assessed the impacts of public health restrictions on PM2.5 using multivariate regression. The mean daily PM2.5 concentration in 2020 was 4.4 μg/m3. During the study period, the minimum daily PM2.5 concentration was 0.7 μg/m3, and the maximum was 20.4 μg/m3. Daily mean PM2.5 concentrations more than doubled on Saharan dust days (8.5 vs 3.6 μg/m3; p < 0.05). The daily mean PM2.5 concentrations were estimated to be 1.2 μg/m3 lower when COVID-19 restrictions were in effect. Ambient PM2.5 concentrations in Grenada are relatively low compared to other countries; however, Saharan dust episodes represent an important source of exposure. Low-cost sensors provide an opportunity to increase surveillance of air pollution in the Caribbean, however their value could be enhanced with the development of correction algorithms that more closely approximate values from reference-grade monitors.
Implications: This study describes daily fluctuations in ambient PM2.5 concentrations in Grenada in 2020. Overall, concentrations of PM2.5 were low; however, we found that Saharan dust events cause daily exceedances in PM2.5 above the current 24-hr limits of the World Health Organization. Moreover, the constructed models suggest that public health interventions to reduce the spread of COVID-19 reduced PM2.5 concentrations by 27%.
Introduction
Exposure to ambient particulate matter air pollution increases the risk of many adverse health conditions, including cardiovascular and respiratory diseases (Kim, Kabir, and Kabir Citation2015; Manisalidis et al. Citation2020; Stanaway et al. Citation2018). The International Agency for Research on Cancer has classified ambient particulate matter (PM) as a human carcinogen (Loomis et al. Citation2013). Given the many sources of ambient particulate matter, its ubiquity, and its adverse health impacts, air pollution monitoring is necessary to determine population health impacts. Air pollution monitoring programs play a vital role in effectively guiding air pollution management and supporting policies that can mitigate adverse health impacts.
Situated in the West Indies, in 2020, the tri-island nation of Grenada had an estimated population of 113,000 people (United Nations Citation2019). Grenada's tropical climate is tempered by north-easterly trade winds. It is a relatively small island that is approximately 34 km long and 19 km wide (344 km2) (Britter Citation2021; Central Intelligence Agency Citation2021). Its highest point of elevation is Mount St Catherine at 840 m above sea level (Britter Citation2021). Indeed, most of the island’s population lives less than 10 km from the nearest coastline. Grenada’s air quality is affected by the burning of fossil fuels for the generation of electricity and motor vehicles, open waste burning, as well as pollution from local industries. The near presence of ocean-going vessels is also an important source of air pollution on the island, as ship traffic, especially large cruise ships, impacts the air quality of port cities (Sorte et al. Citation2020).
To date, only two studies have investigated the health impacts of ambient air pollution in Grenada. Akpinar-Elci et al. reported weak correlations between monthly measures of meteorology, dust, and hospital visits for asthma between 2001 and 2005 (Akpinar-Elci et al. Citation2015b). A subsequent cross-sectional study found that bush burning was associated with an increased prevalence of sinusitis symptoms and dry cough (Akpinar-Elci et al. Citation2015a). It has not been possible to implement time-series or case-crossover studies to investigate the health effects from air pollution due to the lack of daily measures of air pollution concentrations.
In addition to the above anthropogenic sources of air pollution, Grenada’s air quality, like other Caribbean nations, is impacted by Saharan dust plumes. Each year, dust is transported across the Atlantic Ocean from the Sahara and Sahel desert regions of North Africa. Dust mass concentration data collected in Barbados (261 km east of Grenada) from 1973 to 2017 suggest that dust transported to the Caribbean peaks between May and September (Zuidema et al. Citation2019). In June 2020, the Caribbean experienced its largest such Saharan dust storm in the last 50 yr, aptly named the “Godzilla” dust storm (Howes Citation2020). These storms, which typically last for 3–4 days, are thought to pose a risk to human health due to short-lived increases in ambient particulate air pollution that includes biotic and toxic constituents (Akpinar-Elci et al. Citation2015b; Garrison et al. Citation2006). To date, there has been no attempt to characterize variations in ambient concentrations of fine particulate matter (PM2.5; particles with an aerodynamic diameter of <2.5 μm) in Grenada during Saharan dust events.
For the above reasons, this air monitoring study was conducted to characterize daily changes in concentrations of ambient PM2.5. In the absence of the funding needed to install reference-grade monitors in Grenada, we installed a series of low-cost PurpleAir monitors to collect ambient concentrations of PM2.5. The popularity of these monitors has increased substantially in recent years as they have been shown to correlate well with reference-grade monitors (Feenstra et al. Citation2019; Malings et al. Citation2020; Stavroulas et al. Citation2020). Currently, there are more than 16,000 PurpleAir monitors installed worldwide (Wallace et al. Citation2021). The US Environmental Protection Agency has also incorporated PurpleAir monitors into their exposure assessments (Clements Citation2021). A number of scientific papers have also reported findings from exposure studies of PurpleAir monitors to characterize increases in PM2.5 from forest fires (Liang et al. Citation2021), firework displays (Mousavi et al. Citation2021), and changes resulting from COVID public health restrictions (Chauhan and Singh Citation2020).
Initially, we undertook an exposure study with the primary aim of collecting the data needed to characterize daily variations in PM2.5 and investigate the impact of Saharan dust events on these concentrations. However, given that we installed monitors on January 6, 2020, just before the emergence of the COVID-19 worldwide pandemic, this also provided us with the opportunity to explore whether PM2.5 concentrations were reduced during the pandemic. A series of studies in other countries have reported decreased concentrations of PM2.5 and NO2 as a result of the adoption of public health measures to reduce the spread of COVID-19 (Ghosh and Ghosh Citation2020). Similar to other countries, the government of Grenada implemented similar public health measures (Ghosh and Ghosh Citation2020).
Materials and methods
Study design
This is an air monitoring study that continuously collected data from low-cost air pollution monitors in Grenada and the neighboring island of Carriacou from January 6 to December 31, 2020. These data were supplemented with meteorological daily data, and information on the public health interventions that were implemented to reduce the spread of COVID-19.
Ambient PM2.5 pollution data were collected from five fixed-site PurpleAir PA-II-SD monitors (PurpleAir Citation2021a). Four of these monitors were installed at different fixed-site locations across Grenada, and the remaining one was installed in Carriacou (). We selected these monitoring locations based on the monitoring requirements of an outdoor power supply and access to a Wi-Fi network. The operation and maintenance of these monitors was overseen by research team members at St George’s University in Grenada. We installed all monitors less than 2 km from the ocean. The first monitor was installed on the roof of a two-story house, in a sparsely housed suburban area on the southern edge of the island (Egmont). The second monitor was installed under the roof of a two-story house, located approximately 1 km from the capital city, St George’s. This location is near a main road that all trucks on the island must use to traverse to and from the capital city of St George’s (Tempe). The third monitor was installed on the roof of a one-story house, in a sparsely housed remote area on the northeastern edge of the island (Bathway). The fourth monitor was installed at ground-level on the tarmac of the Maurice Bishop International Airport on the southwestern edge of the island (Airport). In Carriacou, one monitor was installed on the upper wall on the outside of a split-level house on the northeastern edge of the island, in a low-density housing area (Windward). All monitors were installed so that they were not affected by venting from cooking or air conditioning units.
Figure 1. Geographical locations of the five PurpleAir monitors that were installed on Grenada and Carriacou.
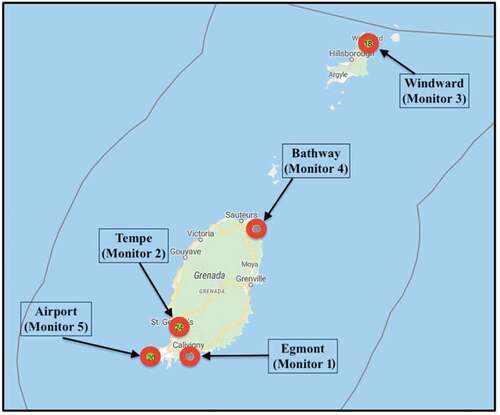
Given that the Tempe monitor is near St George’s (Grenada’s capital) and a main road, this monitoring site was defined as “urban.” As the Egmont, Bathway, and Windward monitors are in sparsely populated areas with little nearby road traffic, these monitoring sites were defined as “rural.” The airport located monitor did not meet the classification criteria for “urban” or “rural,” thus, it was not classified as either.
The five PurpleAir (PA-II-SD) monitors collected continuous measurements of mass concentrations of PM1 (particles with an aerodynamic diameter of <1 μm), PM2.5, and PM10 (particles with an aerodynamic diameter of <10 μm) (PurpleAir Citation2021b). These monitors measure temperature and relative humidity. Each PA-II-SD monitor contains a pair of Plantower PMS5003 laser optical particle counter sensors (Plantower Citation2021). These sensors determine PM concentrations by drawing in samples of air past a laser beam and registering pulses for particles that reflect light onto a detection plate. The length of each pulse determines the particle size, while the number of pulses estimates the number of particles. PurpleAir PM2.5 stationary monitor measurements have been shown to correlate well (R2 values ranging from 0.87 to 0.98) with measurements from higher-quality reference-grade monitors (Feenstra et al. Citation2019; Malings et al. Citation2020; Stavroulas et al. Citation2020).
Hourly mean PM2.5 values from the five monitors were downloaded from the PurpleAir website (www.purpleair.com), and these data were used to calculate daily and monthly summaries. These summaries were derived using continuously collected data provided by two separate channels within each monitor. If there was a fault with one of the channels, PM2.5 concentrations were estimated using the remaining channel that was functioning properly. PurpleAir routinely monitors its devices online to identify problems with the channels in its monitors (PurpleAir Citation2021c). Daily mean concentrations of PM2.5 were only calculated for days with at least 16 hr of monitoring data. PM2.5 values downloaded from the Purple Air monitors were closely inspected to detect anomalous values, and we derived correlations between the monitoring sites to assess concordance across monitoring locations. In addition, we applied the quality assurance method described by Barkjohn et al. to correct for differences in the values obtained from the two channels within the sensors (Barkjohn, Gantt, and Clements Citation2021). Amongst our five PurpleAir monitors, only three could have the quality assurance method applied as the other two each had a channel downgraded throughout the study period. However, these two monitors produced daily trends that correlated highly with the remaining monitors. Of the three eligible PurpleAir monitors, only 2 days in 2020 were flagged for possible exclusion of 359 calendar days (0.05%) using Barkjohn et al.’s quality assessment method (Barkjohn, Gantt, and Clements Citation2021). With the application of the quality assurance method, the corrected annual mean PM2.5 value was 4.349 μg/m3. This represents only a 0.013 μg/m3 difference from the annual mean PM2.5 value (4.362 μg/m3) with no correction factor and that we report herein.
Hourly meteorological data for precipitation, relative humidity, atmospheric pressure, temperature, wind speed, and visibility were obtained from Grenada’s meteorological office (Tamar Citation2021). This office is situated at the Maurice Bishop International Airport. Hourly data were used to construct daily average measures that were used in further analyses. While temperature and relative humidity values were collected from PA-II-SD monitors, they are not always reflective of ambient conditions (PurpleAir Inc Citation2021d). For this reason, we used the data provided by Grenada’s meteorological office. Due to the size of the island, there is little spatial variation in ambient temperature and humidity, and therefore, these data reasonably reflect meteorological conditions at the five monitoring sites.
Identification of Saharan dust days
Each day in the study period was classified as a Saharan dust day or not. The classification was done by using a composite method. This method used the US Naval Research Laboratory (NRL) Navy Aerosol and Prediction System (NAAPS) Global Aerosol Model (NRL Citation2021), daily mean visibility measures from the airport (Tamar Citation2021), and Modern-Era Retrospective Analysis for Research and Applications Version 2 (MERRA-2) derived dust aerosol optical thickness maps (National Aeronautics and Space Administration Citation2019). NRL NAAPS is an aerosol forecast that produces worldwide images of dust surface concentrations around the world at 6-hr intervals (NRL Citation2018). NAAPS is effective at retrospectively identifying Saharan dust days because archived images are available from March 2000 onwards (NRL Citation2018). MERRA-2 is a NASA atmospheric reanalysis (a systematic approach to produce datasets for climate monitoring and research) that assimilates space-based observations of aerosols and represents their interactions with other physical processes within the climate system (National Aeronautics and Space Administration Citation2019; Randles et al. Citation2016).
The following steps were applied to classify each day as either one with Saharan dust exposure or not. Step 1: Days in which the NAAPS global aerosol model had at least one 6-hr interval where a dust surface concentration of ≥20 μg/m3 forecasted over Grenada was initially designated a potential Saharan dust day. Step 2: All days throughout the study period were examined for the reported daily mean visibility. Days with a daily mean visibility of ≤15 km were still considered a potential Saharan dust day, and days with a daily mean visibility >15 km were considered a non-Saharan dust day. A threshold of 15 km was applied as this is the cut-point used by the nearby Trinidadian meteorological office (Gyan et al. Citation2005). Step 3: If there was a clear presence of dust aerosols over Grenada on these potential Saharan dust days, accounting for NAAPS forecasted dust surface concentration and daily mean visibility, they would be classified as Saharan dust days. Days that were not considered potential Saharan dust days but had a daily mean visibility of ≤15 km were also viewed for the presence of dust to confirm the absence of dust over Grenada. Additional details on this methodology are reported in Section S1.1 (Supplemental material).
COVID-19 restrictions data
The government of Grenada implemented a series of public health restrictions starting in March 2020 to reduce the spread of SARS-CoV-2. These restrictions were classified based on physical distancing measures or travel restrictions. Retrospectively, information published in daily newspapers (“NOW Grenada” and the Barbados newspaper “Loop News Barbados”) were used (Loop Barbados News Citation2020; NOW Grenada Citation2021), to construct daily measures of physical distancing regulations. These included daily curfews (designated times of curfew/movement and hours of curfew/movement per day) and social gathering limit measures.
In late March 2020, Grenada closed its international airport to commercial passenger traffic (NOW Grenada, Citation2020c). Daily data on commercial airplane arrivals and departures for Maurice Bishop International Airport were extracted from “FlightStats” (FlightStats Citation2020). In late March 2020, restrictions were placed on ocean-going vessels (cruise ships, freight ships, pleasure craft, and live-aboard vessels), and these policies substantially decreased the number of vessels at Grenadian ports (NOW Grenada Citation2020a, NOW Grenada Citation2020b). Daily data on arrivals and departures were provided by the Marine Department of Grenada Ports Authority (Grenada Ports Authority Citation2020). A dichotomous variable (yes or no) was also constructed to identify when Emergency Powers/Public Health Act regulations were implemented in Grenada. These regulations signal the broad implementation of all COVID-19-related public health interventions on the island, which include curfews, social gathering limits, and travel restrictions, among others.
Statistical analysis
A time-series of ambient PM2.5 concentrations for each of the five installed monitors was constructed to describe daily fluctuations in concentrations at each location. Analysis of variance (ANOVA) models were fit to evaluate differences in the mean concentrations of PM2.5 across different days of the week and by month. Pearson correlation coefficients were derived to describe associations between daily PM2.5 and meteorological measures.
A boxplot was constructed to compare the distribution of PM2.5 concentrations with time of the day, and to investigate differences between rural (Egmont) and urban (Tempe) locations. A two-sample Student’s t-test evaluated differences in the mean concentrations between these locations. Similar methods were followed to contrast PM2.5 concentrations between Saharan dust days to those with no dust.
Impacts of COVID-19 restrictions on ambient concentrations of PM2.5 were evaluated using multivariate regression with each day of the study period serving as a unit of observation.
The dependent variable, the daily ambient concentration of PM2.5, was derived by averaging daily data from across all five monitors. Sensitivity analyses were done by restricting to the four monitors in Grenada (i.e., excluding the data from the nearby island of Carriacou). The primary independent variable of interest was the presence of a public health intervention. These multivariable models included daily meteorological measures (i.e., temperature and relative humidity) as adjustment factors.
Statistical analyses of the data were performed using version 1.1.463 of the RStudio software (RStudio Citation2022).
Results
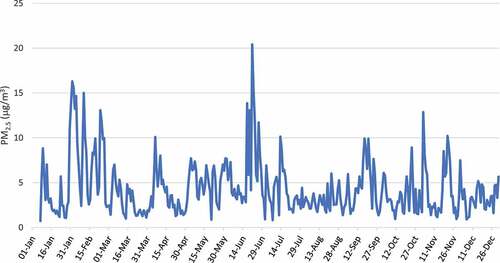
There was substantial variability in the daily mean concentrations of PM2.5 in Grenada between January 7 and December 31, 2020 (). The overall mean ambient PM2.5 concentration during this period, calculated as the average of the daily means, was 4.4 μg/m3. The minimum daily average observed during the study period was 0.7 μg/m3, while the maximum value was 20.4 μg/m3. Data on the daily concentrations of PM10 are also included in Section S2.1 (supplemental material). Daily concentrations of PM2.5 peaked during the Saharan dust episode between June 21 and 23, 2020. No statistically significant differences in the daily mean concentrations of PM2.5 were found across the days of the week (p = 0.97). Mean PM2.5 concentrations ranged from a low of 4.0 μg/m3 on Saturdays and a high of 4.6 μg/m3 on Mondays and Fridays [data not shown].
Figure 2. Daily mean PM2.5 concentrations averaged across the five PurpleAir monitors installed in Grenada and Carriacou from January 7 to December 31, 2020.
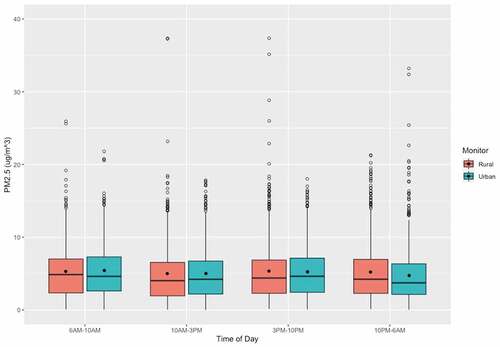
Pearson correlations (r) were estimated between daily meteorological measures and mean PM2.5 concentrations. The strongest correlations were observed between the daily mean PM2.5 and improved visibility (r = −0.58), wind speed (r = 0.24), and atmospheric pressure (r = 0.21) [data not shown]. On a time-of-day basis, when only considering data collected on weekdays, the differences in ambient concentrations of PM2.5 were negligible between urban and rural monitoring locations. Overall, the mean concentration at the urban location was 5.0 μg/m3, while for the rural location it was 5.2 μg/m3. The largest difference in exposure occurred between 10 p.m. to 6 a.m., where the mean concentrations in urban and rural locations were 4.7 and 5.2 μg/m3 (p < 0.05), respectively (). Additional data for this time-of-day comparison, when segregating by weekdays and weekend days, are reported in Section S3.1 (Supplemental material).
Figure 3. Boxplot comparison of hourly PM2.5 concentrations at a rural location (orange) and an urban location (blue) on weekdays, by time of day. Time period of data: January 30 to February 28, 2020 and April 27 to August 31, 2020.
During the study period, we identified 56 days that were affected by Saharan dust. The mean daily PM2.5 concentration on these days was 8.5 μg/m3, which was approximately 2.5 times higher than on non-Saharan dust days (p < 0.01) (). After adjusting for meteorology and the presence of Saharan dust days, the daily mean PM2.5 concentrations were 1.2 μg/m3 lower on days with public health interventions to reduce the spread of COVID-19 (). Results from fitting a multivariate linear regression using daily PM2.5 data from the urban location monitor (Tempe) can be found in Section S4.1 (Supplementary material).
Figure 4. A box plot comparison of daily mean PM2.5 concentrations on Saharan dust days and non-dust days in Grenada and Carriacou from January 7 to December 31, 2020.
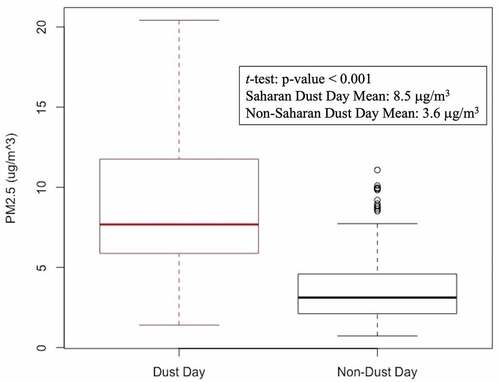
Table 1. Results from fitting a multivariate linear regression model for daily concentrations of PM2.5 in the presence of public health measures, and meteorological factors, from January 6 to December 31, 2020, in Grenada, West Indies.
Discussion
This is the first study to describe daily changes in ambient PM2.5 concentration levels in Grenada, and this was accomplished using data collected at five monitoring locations. Overall, the mean daily concentration for PM2.5 in Grenada in 2020 was 4.4 μg/m3. When compared to most other countries, these concentrations are low. For example, the 2020 World Air Quality Report documents annual mean PM2.5 concentrations were the highest in Bangladesh (77.1 μg/m3), while the corresponding annual values for the US and Canada were 9.6 and 7.3 μg/m3, respectively (IQAir Citation2020). Our estimates of the mean daily PM2.5 concentration measured in Grenada are similar to previously published values for the Caribbean. For example, the 2020 World Air Quality Report noted an annual mean concentration of PM2.5 of 3.7 μg/m3 in both the US Virgin Islands and Puerto Rico (IQAir Citation2020). These estimates were also derived from PurpleAir monitors (RStudio Citation2022). The daily average PM2.5 concentration in our study is less than the recently updated World Health Organization (WHO) annual guideline value of 5 μg/m3 (World Health Organization Citation2021).
The daily mean PM2.5 concentrations during Saharan dust days in Grenada (8.5 μg/m3) were nearly 2.5 times higher than the daily mean on non-Saharan dust days (3.6 μg/m3). There were 5 days where the daily mean PM2.5 concentration exceeded the WHO’s 24-hr guideline value of 15 μg/m3 (World Health Organization Citation2021). Saharan dust episodes occurred on all five of these days. This finding is consistent with those from other studies that have found Saharan dust intrusions to be responsible for large increases in ambient PM2.5 in island settings (Cadelis, Tourres, and Molinie Citation2014; Díaz et al. Citation2017; Varrica et al. Citation2019). However, the ambient PM2.5 concentrations on Saharan dust days in Grenada were lower than what was found on these other islands (Guadeloupe, Sicily, Canary Islands). It is possible that these differences are partially explained by Grenada generally having lower background concentrations of PM2.5. Another possibility is that PurpleAir monitors may have underestimated ambient dust concentrations as the other studies used different monitors (Cadelis, Tourres, and Molinie Citation2014; Díaz et al. Citation2017; Varrica et al. Citation2019). For example, it has been demonstrated in laboratory and ambient environments that the Plantower sensor (contained in each PurpleAir monitor) readings underestimated actual PM2.5 concentrations when exposed to dust (Jayaratne et al. Citation2020; Kosmopoulos et al. Citation2020; Mei et al. Citation2020). Further, it is possible that laser channel-based sensor readings are affected by the surface area, particle shape, color, and composition of dust particles (Jayaratne et al. Citation2020). This may be related to the assumptions made about the particle diameter, density, and shape by each Plantower sensor.
There are several factors that could contribute to low ambient concentrations of PM2.5 in Grenada. It is possible that the local anthropogenic sources of air pollution on the island were relatively inconsequential to the overall levels of ambient PM2.5 on the island. This is supported by the finding that days with lower wind speeds generally had lower levels of PM2.5 relative to days with higher wind speeds. The rugged topography of the island may also play a role in how particulate matter pollution is dispersed. In addition, Grenada is unlike countries in the Northern Hemisphere that experience higher pollution concentrations in the winter that are due to temperature inversion effects (Brook, Dann, and Burnett Citation1997). Finally, Grenada has relatively warmer temperatures throughout the year, and home heating is not an important source of air pollution.
Monthly mean PM2.5 concentrations in Grenada calculated in this study ranged from 2.9 to 8.1 μg/m3. Aside from periods in which Saharan dust episodes impacted Grenada air quality, ambient PM2.5 concentrations were very low. Months with the highest average monthly PM2.5 concentrations measured, February (8.1 μg/m3) and June (6.6 μg/m3) were influenced by Saharan dust episodes as there were 15 and 12 dust days during these months, respectively. Taken together, these data patterns suggest that Saharan dust is the dominant source of PM2.5 exposure in Grenada and the cause of exceedances above the WHO 24-h guideline value (World Health Organization Citation2021).
Ambient PM2.5 concentrations were similar in urban and rural locations throughout the day despite differences in housing density and nearby road traffic between the two locations. This suggests that due to the small size and similar topography across the island, there is little spatial variation in ambient concentrations of PM2.5 in Grenada. This also suggests that regional, and not local, sources of air pollution are a key driver of excess ambient concentrations of PM2.5 in Grenada. It is possible that there exist spatial variations in the concentrations of other traffic-related pollutants, such as NO2 and ultrafine particles. Given the role that these pollutants also have on human health, further exposure studies that explore these variations should be considered.
The largest difference in PM2.5 found during this time-of-day comparison (from 10 p.m. to 6 a.m.) may be due to the diurnal cycle of sea/land breezes. As documented in another island-setting study (Santa Cruz de Tenerife, Canary Islands), breezes from the sea come inland during daylight hours and air masses from inland flow toward the sea at night (Rodríguez et al. Citation2008). At a coastal background site on the island, a smooth increase in PM1, PM2.5, and PM10 was observed during nighttime hours (12 to 5 a.m.), and this was associated with winds transporting air masses from the city center of Santa Cruz de Tenerife toward the sea.
Of the meteorological measurement studies, daily mean visibility was most strongly related to ambient PM2.5. This is not surprising given that Saharan dust events are defined by visibility. Other than days with heavy fog, reductions in atmospheric visibility are heavily associated with poor air quality (Watson Citation2002). In addition to visibility, wind speed was modestly positively associated with PM2.5. As noted in an ambient particulate matter study done in Trinidad and Tobago, a positive association between PM2.5 and wind speed may be due to increased transboundary (e.g., Saharan dust) pollution (Shairsingh, Jeong, and Evans Citation2019). Previous research has also shown that dust storms are often accompanied by higher wind speeds (Schwartz et al. Citation1999). Similarly, the wind speeds observed in Grenada were higher on Saharan dust days (daily mean = 6.8 m/s) than on non-dust days (daily mean = 5.5 m/s) (p < 0.05) ().
Table 2. Descriptive statistics of daily meteorological measures during Saharan dust days and non-dust days.
The implementation of COVID-19 public health measures was associated with an estimated 27% decrease in ambient PM2.5. This association persisted after adjusting for meteorological variables (daily mean relative humidity and temperature) and the occurrence of Saharan dust days. Our findings are consistent with those in other jurisdictions. A review of 15 studies examining air quality during COVID-19 lockdown (across 15 different countries) reported an average decrease in PM2.5 of approximately 27%, comparing pre-lockdown to lockdown period concentrations (Ghosh and Ghosh Citation2020).
No statistically significant associations were detected between specific public health measures (curfews, social gathering limits, daily boat/ship or airplane movements) and daily mean PM2.5 in Grenada. A study examining the impact of COVID-19-related lockdown measures on air quality across 162 countries found that the implementation of curfews resulted in decreased PM2.5 (Bonardi et al. Citation2021). In major Saudi Arabian cities, during periods with social gathering limits in effect, reductions in NO2 and CO, and marginal increases in PM10 concentrations were documented (Farahat et al. Citation2021). No studies could be identified that examined the impacts of changes in commercial airplane flights due to COVID-19 and surrounding ambient air quality. However, two studies have been identified that examined changes in boating/shipping traffic activity during COVID-19 and ambient air pollution emissions. Emissions of air pollutants, such as NO2 and SO2 associated with COVID lockdowns were either unchanged or marginally increased, compared to non-lockdown period concentrations in these two studies (Nieto Guarasa Citation2020; Saliba et al. Citation2021).
In addition to the potential underestimation of Saharan dust plumes by the PurpleAir monitors discussed earlier, our findings should be interpreted cautiously for three reasons. First, the potential role of high humidity and sea-salt spray that contributed to PurpleAir monitors failing for several days. During our exposure study, four monitors stopped working at various times, and required repair (or replacement). Second, the lack of historic air monitoring data for Grenada, thus not allowing for comparison of PM2.5 concentrations measured in this study to “typical” concentrations. Third, our assessment of the impacts of COVID-19 restrictions on air quality was based on changes in ambient PM2.5. However, PM2.5 includes both local and regional sources of pollution. In contrast, measurements of ambient NO2 would better capture any localized changes in pollution, especially related to changes in vehicular traffic.
We recognize that our findings are based on the use of low-cost sensors to estimate daily variations in PM2.5 concentrations, and that it would be preferable to have employed reference-grade monitors. We lacked the funding to install these monitors. As aptly described by Barkjohn et al., correction measures are usually advised to adjust data from sensors to improve their accuracy so that they are more comparable to regulatory monitors (Barkjohn, Gantt, and Clements Citation2021). Ideally, this would involve application of correction methods that could be derived by co-locating a PurpleAir monitor with a regulatory monitor. Unfortunately, there were no co-located devices in operation during our study period. We did, however, apply the correction method of Barkjohn et al. for the continental US, and this produced a corrected mean daily PM2.5 concentration of 1.3 µg/m3 for Grenada, which is less than half the value calculated with our series of PurpleAir monitors (Barkjohn, Gantt, and Clements Citation2021). The correction method of Barkjohn et al. and others may not readily apply to Grenada due to substantial differences in meteorology and relative humidity, not to mention different sources of PM2.5 (e.g., Saharan dust) (Barkjohn, Gantt, and Clements Citation2021). This is also borne out by additional analyses we undertook of US EPA reference grade PM2.5 data for the nearby US Virgin Islands that yielded an annual concentration of 6.1 µg/m3 and concentrations of approximately 20 µg/m3 during the Saharan dust storm in June 2020 (US EPA Citation2022). Moreover, satellite imaging data estimate that the annual mean concentration of PM2.5 in Curacao was 5.1 µg/m3 (IQAir Citation2022). Both of these series of estimates are similar to values we obtained for Grenada and provide some validity for our own measures. Nonetheless, we recognize the importance of developing correction methods for using low-cost sensors for ambient PM2.5 in the Caribbean, and are hopeful of obtaining funding support to carry out this work in the near future.
In conclusion, data from this air monitoring study suggest that ambient PM2.5 concentrations in Grenada are lower than in most other countries. The impacts of episodic Saharan dust plumes were significant and responsible for nearly all of the days when relatively high ambient air pollution concentrations were recorded. This study also revealed that the application of public health restrictions by the government to curtail the spread of COVID-19 were associated with reduced concentrations of PM2.5 by approximately 27%. Future work should explore what impact locally based sources of air pollution have on PM2.5 concentration levels by employing the use of more monitors. It is our hope that these initial findings will provide support to expand air pollution monitoring in Grenada, and ultimately this monitoring will incorporate data from reference-grade equipment, and assess associations with adverse health outcomes using hospitalization data.
Supplementary_Material_revised_.docx
Download MS Word (102.4 KB)Acknowledgment
The authors thank J. David Miller Ph.D. for helpful advice. The authors are also grateful to the Grenada Port Authorities, and the Meteorological Office at Maurice Bishop International Airport for providing the data.
Disclosure statement
No potential conflict of interest was reported by the author(s).
Data availability statement
PurpleAir data are freely available online on their website. All enquiries about accessing additional data should be directed toward the corresponding author.
Supplemental material
Supplemental data for this article can be accessed online at https://doi.org/10.1080/10962247.2022.2126555.
Additional information
Funding
Notes on contributors
Nicholas Dirienzo
Nicholas Dirienzo is an MSc graduate and Research Assistant at Carleton University.
Kerry Mitchell
Kerry Mitchell is an Associate Professor of Environmental and Occupation Health at St. George's University.
Martin Forde
Martin Forde is a Professor and Track Director for Environmental and Occupational Health at St. George's University.
Daniel Rainham
Daniel Rainham is a Professor in Health Promotion in the School of Health and Human Performance and a Research Scholar with the Health Populations Institute at Dalhousie University.
Paul J. Villeneuve
Paul J. Villeneuve is a Professor in the Department of Neuroscience at Carleton University.
References
- Akpinar-Elci, M., K. Coomansingh, J. Blando, and L. Mark. 2015a. Household bush burning practice and related respiratory symptoms in Grenada, the Caribbean. J. Air Waste Manage. Assoc. 65 (9):1148–52.
- Akpinar-Elci, M., F. E. Martin, J. G. Behr, and R. Diaz. 2015b. Saharan dust, climate variability, and asthma in Grenada, the Caribbean. Int. J. Biometeorol. 59 (11):1667–71.
- Barkjohn, K. K., B. Gantt, and A. L. Clements. 2021. Development and application of a United States-wide correction for PM2.5 data collected with the PurpleAir sensor. Atmos. Meas. Tech. 14 (6):4617–37.
- Bonardi, J. P., Q. Gallea, D. Kalanoski, R. Lalive, R. Madhok, F. Noack, D. Rohner, and T. Sonno. 2021. Saving the world from your couch: The heterogeneous medium-run benefits of COVID-19 lockdowns on air pollution. Environ. Res. Lett. 16:1–18.
- Britter, E. V. B. 2021. Grenada | history, geography, & points of interest. Britannica. https://www.britannica.com/place/Grenada.
- Brook, J. R., T. F. Dann, and R. T. Burnett. 1997. The relationship among TSP, PM 10, PM 2.5, and inorganic constituents of atmospheric particulate matter at multiple Canadian locations. J. Air Waste Manage. Assoc. 47 (1):2–19.
- Cadelis, G., R. Tourres, and J. Molinie. 2014. Short-term effects of the particulate pollutants contained in Saharan dust on the visits of children to the emergency department due to asthmatic conditions in Guadeloupe (French Archipelago of the Caribbean). PLoS One 9 (3):e91136. doi:10.1371/journal.pone.0091136.
- Central Intelligence Agency. 2021. Central America : Grenada — the World Factbook - Central Intelligence Agency. https://www.cia.gov/library/publications/the-world-factbook/geos/gj.html.
- Chauhan, A., and R. P. Singh. 2020. Decline in PM2.5 concentrations over major cities around the world associated with COVID-19. Environ. Res. 187:109634.
- Clements, A. 2021. Summary of EPA’s internal PurpleAir sensor database. Washington, DC. https://cfpub.epa.gov/si/si_public_record_Report.cfm?dirEntryId=352832&Lab=CEMM.
- Díaz, J., C. Linares, R. Carmona, A. Russo, C. Ortiz, P. Salvador, and R. M. Trigo. 2017. Saharan dust intrusions in Spain: Health impacts and associated synoptic conditions. Environ. Res. 156:455–67.doi:10.1016/j.envres.2017.03.047.
- Farahat, A., A. Chauhan, M. Al Otaibi, and R. P. Singh. 2021. Air quality over major cities of Saudi Arabia during Hajj periods of 2019 and 2020. Earth Syst. Environ. 5 (1):101–14.
- Feenstra, B., V. Papapostolou, S. Hasheminassab, H. Zhang, B. der Boghossian, D. Cocker, and A. Polidori. 2019. Performance evaluation of twelve low-cost PM2.5 sensors at an ambient air monitoring site. Atmos. Environ. 216:116946.doi:10.1016/j.atmosenv.2019.116946.
- FlightStats. 2020. FlightStats - global flight status & tracker, airport weather and delays. https://www.flightstats.com/v2.
- Garrison, V. H., W. T. Foreman, S. Genualdi, D. W. Griffin, C. A. Kellogg, M. S. Majewski, A. Mohammed, A. Ramsubhag, E. A. Shinn, S. L. Simonich, et al. 2006. Saharan dust - A carrier of persistent organic pollutants, metals and microbes to the Caribbean? Rev. Biol. Trop. 54 (Suppl 3):9–21.
- Ghosh, S., and S. Ghosh. 2020. Air quality during covid-19 lockdown: Blessing in disguise. Indian J. Biochem. Biophys. 57 (4):420–30.
- Grenada cruise ship advisory – 16 March 2020. NOW Grenada. 2020a. https://www.nowgrenada.com/2020/03/grenada-cruise-ship-advisory-16-march-2020/.
- Grenada Ports Authority. 2020. http://www.grenadaports.com/.
- Gyan, K., W. Henry, S. Lacaille, A. Laloo, C. Lamsee-Ebanks, S. McKay, R. M. Antoine, and M. A. Monteil. 2005. African dust clouds are associated with increased paediatric asthma accident and emergency admissions on the Caribbean island of Trinidad. Int. J. Biometeorol. 49 (6):371–76. doi:10.1007/s00484-005-0257-3.
- Howes, N. 2020. The Weather Network - Sahara dust blankets Caribbean skies with hazardous “Godzilla” cloud. The Weather Network. https://www.theweathernetwork.com/ca/news/article/saharan-dust-hurling-towards-the-caribbean-united-states-may-cause-health-issues.
- IQAir. 2020. 2020 world air quality report - Region & City PM2.5 ranking. https://www.iqair.com/world-air-quality-report.
- IQAir. 2022. Curacao Air Quality Index (AQI) and Curacao air pollution. https://www.iqair.com/curacao.
- Jayaratne, R., X. Liu, K. H. Ahn, A. Asumadu-Sakyi, G. Fisher, J. Gao, A. Mabon, M. Mazaheri, B. Mullins, M. Nyaku, et al. 2020. Low-cost PM2.5 sensors: An assessment of their suitability for various applications. Aerosol Air Qual. Res. 20 (3):520–32.
- Kim, K. H., E. Kabir, and S. Kabir. 2015. A review on the human health impact of airborne particulate matter. Environ. Int. 74:136–43.
- Kosmopoulos, G., V. Salamalikis, S. N. Pandis, P. Yannopoulos, A. A. Bloutsos, and A. Kazantzidis. 2020. Low-cost sensors for measuring airborne particulate matter: Field evaluation and calibration at a South-Eastern European site. Sci. Total Environ. 748:141396.
- Liang, Y., D. Sengupta, M. J. Campmier, D. M. Lunderberg, J. S. Apte, and A. H. Goldstein. 2021. Wildfire smoke impacts on indoor air quality assessed using crowdsourced data in California. Proc. Natl. Acad. Sci. U.S.A. 118 (36):1–6.
- Loomis, D., Y. Grosse, B. Lauby-Secretan, F. el Ghissassi, V. Bouvard, L. Benbrahim-Tallaa, N. Guha, R. Baan, H. Mattock, and K. Straif. 2013. The carcinogenicity of outdoor air pollution. Lancet Oncol. 14 (13):1262–63. doi:10.1016/S1470-2045(13)70487-X.
- Loop Barbados News. 2020. https://barbados.loopnews.com/.
- Malings, C., R. Tanzer, A. Hauryliuk, P. K. Saha, A. L. Robinson, A. A. Presto, and R. Subramanian. 2020. Fine particle mass monitoring with low-cost sensors: Corrections and long-term performance evaluation. Aerosol Sci. Technol. 54 (2):160–74. doi:10.1080/02786826.2019.1623863.
- Manisalidis, I., E. Stavropoulou, A. Stavropoulos, and E. Bezirtzoglou. 2020. Environmental and health impacts of air pollution: A review. Front. Public Health 8:14.
- MBIA closed to all commercial traffic from Monday at 11:59 pm. NOW Grenada. 2020c. https://www.nowgrenada.com/2020/03/mbia-closed-to-all-commercial-traffic-from-monday-at-1159-pm/.
- Mei, H., P. Han, Y. Wang, N. Zeng, D. Liu, Q. Cai, Z. Deng, Y. Wang, Y. Pan, and X. Tang. 2020. Field evaluation of low-cost particulate matter sensors in Beijing. Sensors (Switzerland) 20 (16):1–17. doi:10.3390/s20164381.
- Mousavi, A., Y. Yuan, S. Masri, G. Barta, and J. Wu. 2021. Impact of 4th of July fireworks on spatiotemporal pm2.5 concentrations in California based on the PurpleAir sensor network: Implications for policy and environmental justice. Int. J. Environ. Res. Public Health 18 (11):5735.
- National Aeronautics and Space Administration. 2019. Modern-era retrospective analysis for research and applications, version 2. https://gmao.gsfc.nasa.gov/reanalysis/MERRA-2/.
- Nieto Guarasa, J. 2020. Impact of COVID-19 on maritime traffic and vessel-related emissions. https://upcommons.upc.edu/handle/2117/329548.
- NOW Grenada. 2021. https://www.nowgrenada.com/.
- NRL. 2018. Navy research lab resources for air quality modeling satellite aerosol products workshop, September 25, 2018. https://www.star.nesdis.noaa.gov/smcd/spb/aq/aqpg/2018/documents/NAAPS_Resources_Instructions.pdf.
- NRL. NRL Monterey Aerosol Page. 2021. https://www.nrlmry.navy.mil/aerosol/.
- Plantower. 2021. PM2.5 - PMS 5003. http://www.plantower.com/en/content/?108.html.
- PurpleAir. 2021a. PurpleAir PA-II-SD air quality detector | PM2.5 measurement device. https://www2.purpleair.com/products/purpleair-pa-ii-sd.
- PurpleAir. 2021b. FAQ - About PurpleAir - What do PurpleAir sensors measure?. https://www2.purpleair.com/community/faq#hc-what-do-purpleair-sensors-measure-1.
- PurpleAir. 2021c. PurpleAir FAQ - What does “downgraded” mean on the graph. https://www2.purpleair.com/community/faq#hc-what-does-downgraded-mean-on-the-graph-1.
- PurpleAir Inc. 2021d. FAQ - data access - sensor list downloader - sensor list data file headers. https://www2.purpleair.com/community/faq#hc-primary-and-secondary-data-header.
- Randles, C. A. A. M. da Silva, V. Buchard, A. Darmenov, P. R. Colarco, V. Aquila, H. Bian, E. P. Nowottnick, X. Pan, A. Smirnov, et al. 2016. Technical report series on global modeling and data assimilation, volume 45 the MERRA-2 aerosol assimilation, vol. 45. Greenbelt, MD: National Aeronautics and Space Administration.
- Rodríguez, S., E. Cuevas, Y. González, R. Ramos, P. M. Romero, N. Pérez, X. Querol, and A. Alastuey. 2008. Influence of sea breeze circulation and road traffic emissions on the relationship between particle number, black carbon, PM1, PM2.5 and PM2.5–10 concentrations in a coastal city. Atmos. Environ. 42 (26):6523–34. doi:10.1016/j.atmosenv.2008.04.022.
- RStudio. 2022. Older versions of RStudio. https://www.rstudio.com/products/rstudio/older-versions/.
- Saliba, M., F. Azzopardi, R. Muscat, M. Grima, A. Smyth, J. P. Jalkanen, L. Johansson, A. Deidun, A. Gauci, C. Galdies, et al. 2021. Trends in vessel atmospheric emissions in the central Mediterranean over the last 10 years and during the covid-19 outbreak. J. Mar. Sci. Eng. 9 (7): 762, Jul 11. doi:10.3390/jmse9070762.
- Schwartz, J., G. Norris, T. Larson, L. Sheppard, C. Claiborne, and J. Koenig. 1999. Episodes of high coarse particle concentrations are not associated with increased mortality. Environ. Health Perspect. 107 (5):339–42.
- Shairsingh, K. K., C. H. Jeong, and G. J. Evans. 2019. Transboundary and traffic influences on air pollution across two Caribbean islands. Sci. Total Environ. 653:1105–10.
- Sorte, S., V. Rodrigues, C. Borrego, and A. Monteiro. 2020. Impact of harbour activities on local air quality: A review. Environ. Pollut. 257:113542.doi:10.1016/j.envpol.2019.113542.
- Stanaway, J. D., A. Afshin, E. Gakidou, S. S. Lim, D. Abate, K. H. Abate, C. Abbafati, N. Abbasi, H. Abbastabar, F. Abd-Allah, et al. 2018. Global, regional, and national comparative risk assessment of 84 behavioural, environmental and occupational, and metabolic risks or clusters of risks for 195 countries and territories, 1990–2017: A systematic analysis for the Global Burden of Disease Study 2017. Lancet 392 (10159):1923–94. doi:10.1016/S0140-6736(18)32225-6.
- Stavroulas, I., G. Grivas, P. Michalopoulos, E. Liakakou, A. Bougiatioti, P. Kalkavouras, K. Fameli, N. Hatzianastassiou, N. Mihalopoulos, and E. Gerasopoulos. 2020. Field evaluation of low-cost PM sensors (Purple Air PA-II) Under variable urban air quality conditions, in Greece. Atmosphere (Basel) 11 (9):926. doi:10.3390/atmos11090926.
- Tamar, G. 2021. Email of Grenada meteorological data to author. St. George's, Grenada: Maurice Bishop International Airport.
- United Nations. 2019. World population prospects - Total population - Both sexes. https://population.un.org/wpp/Download/Standard/Population/.
- Updated: Marine and yachting advisory for Grenada. NOW Grenada. 2020b. https://www.nowgrenada.com/2020/03/live-on-board-and-pleasure-boat-passengers-will-not-be-permitted-to-come-ashore/.
- US EPA. 2022. Download daily data | Outdoor air quality data. https://www.epa.gov/outdoor-air-quality-data/download-daily-data.
- Varrica, D., E. Tamburo, M. Vultaggio, and I. di Carlo. 2019. ATR–FTIR spectral analysis and soluble components of PM10 and PM2.5 particulate matter over the urban area of palermo (Italy) during normal days and Saharan events. Int. J. Environ. Res. Public Health 16 (14):2507, Jul 2.
- Wallace, L., J. Bi, W. R. Ott, J. Sarnat, and Y. Liu. 2021. Calibration of low-cost PurpleAir outdoor monitors using an improved method of calculating PM2.5. Atmos. Environ. 256:118432.
- Watson, J. G. 2002. Visibility: Science and regulation. J. Air Waste Manage. Assoc. 52 (6):628–713.
- World Health Organization. 2021. WHO global air quality guidelines: particulate matter (PM2.5 and PM10), ozone, nitrogen dioxide, sulfur dioxide and carbon monoxide. Geneva. https://www.who.int/publications/i/item/9789240034228.
- Zuidema, P., C. Alvarez, J. Kramer Samantha, L. Custals, M. Izaguirre, P. Sealy, J. M. Prospero, and E. Blades. 2019. Is summer African dust arriving earlier to Barbados? The updated long-term in situ dust mass concentration time series from Ragged Point, Barbados, and Miami, Florida. Bull. Am. Meteorol. Soc. 100 (10):1981–86. doi:10.1175/BAMS-D-18-0083.1.