
 ?Mathematical formulae have been encoded as MathML and are displayed in this HTML version using MathJax in order to improve their display. Uncheck the box to turn MathJax off. This feature requires Javascript. Click on a formula to zoom.
ABSTRACT
Lysimeters are considered the most appropriate instrument for assessing percolations rates through landfill final covers. Their design, however, must take into consideration the unsaturated nature of water seepage, otherwise they may act as a sink or cause flow avoidance. The aim of this study was to investigate whether using a simple approach to lysimeter design produces reliable seepage control data. Two different design methods were compared using a three-year field database of suction and seepage data collected from large-scale lysimeters installed at the St-Nicephore landfill in Canada. The first, or control, whose side walls were as high as the thickness of the cover material, was inspired from lysimeters installed during the Alternative Cover Assessment Program (ACAP; USA). The second lysimeter was designed based on the proposed simple design methodology, which focuses on the unsaturated flow and hydraulic properties of the materials to determine the optimal wall height. Analysis of the database did not show any indication of significant preferential flow, or alteration of the flow regime by the second lysimeter, which collected as much percolation as the control one (less than 5% difference). The linear method has not been tested for extreme climatic conditions and the wall heights calculated using this method may be very high when designed for very fine-grained soil covers.
Introduction
Determining which are the most effective methods for predicting percolation rates in landfills is still a challenge in environmental geotechnics and has been the subject of numerous studies (Abichou, Liu, and Tawfiq Citation2006; Albright et al. Citation2004; Bews, Barbour, and Wickland Citation1999; Chiu and Shackelford Citation2000; Parent et al. Citation2006). The vast majority of the technical literature focusing on the evaluation of deep percolation through landfill covers has demonstrated that lysimeters are the most reliable direct measurement device for performing such evaluations. Large-scale lysimeters represent an alternative configuration between laboratory tests and the small lysimeters commonly used in agriculture, since they more closely represent field conditions (Kempton Citation2012; Muniruzzaman et al. Citation2021; Urrutia et al. Citation2011; Vriens et al. Citation2020). Despite their usefulness, pan lysimeters are intrusive measuring devices, and as such can affect the unsaturated flow regime. The interface of the bottom of the lysimeter can generate a capillary barrier around the fill and drain layer preventing the outflow (Benson et al. Citation2001; Zornberg, Bouazza, and McCartney Citation2010; Berger, Groengroeft, and Gebert (Citation2019). The optimal design of lysimeters should take their dimensions into account in order to have a minimal effect on the flow regime and infiltration assessment (Abichou, Liu, and Tawfiq Citation2006; Liu Citation2004). Research in this direction has not attracted much attention lately. Lysimeter-related projects developed at the Université de Sherbrooke (Abdolahzadeh, Vachon, and Cabral Citation2011; Lacroix Vachon, Abdolahzadeh, and Cabral Citation2015; Parent and Cabral Citation2006; Parent et al. Citation2006) have shown that there is room for improvement, and that clear guidance for designing efficient lysimeters is needed.
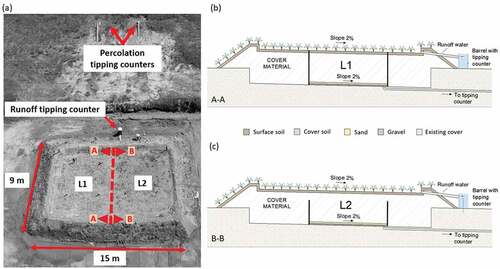
In this study, we compared two different approaches to lysimeter design. The first, explored during the Alternative Cover Assessment Program (ACAP) (Albright and Benson Citation2002; Benson et al. Citation2001), promoted a design that attempted to eliminate one important disadvantage of lysimeters: flow avoidance or sinking flow. Since the walls of the lysimeters reached the surface, these problems were avoided (such as the presence of a capillary barrier at the bottom of the lysimeter, which also presented a challenge). The second approach was to determine the wall height (Hlys) in such a way that the lysimeter did not affect the flow regime. This approach is based on the design methodology proposed by Parent et al. (Citation2006), also known as the linear method, which considers that the performance of a lysimeter is directly related to its wall height and climatic data. The design involves determining the unsaturated parameters of the filling soil, namely the soil water retention curve (SWRC), and the hydraulic conductivity function (k-fct). Wall height is determined using the k-fct and a user-selected steady-state flow rate. This comparative approach was made possible by constructing two large-scale lysimeters in the field (). To reproduce the first approach, we constructed an ACAP-like lysimeter, named L1 (). Its walls reach the surface of the experimental cover. Since L1 is not supposed to significantly affect the flow regime, it was considered the control lysimeter. To assess the second approach (linear method), pan lysimeter L2 (illustrated in ) was constructed. The two lysimeters are juxtaposed, as indicated in () and the same cover material was used to fill them.
Figure 1. Views of the field-test plot at St-Nicephore, Drummondville, Canada (a) Aerial view (enclosure plan); (b) Cross section A-A Lysimeter 1 (L1); (c) Cross section B-B Lysimeter 2 (L2).
Our hypothesis is that the linear design method leads to well-functioning lysimeters, i.e., lysimeters that do not affect the flow regime most of the time (they do when flow rates are very small, as explained below), and therefore can be relied upon to assess percolation rates. We compared the percolated water quantities of L2 with those of L1. The questions to be answered here are whether L2 can be trusted, to what extent can the linear methodology be adopted, and what improvements can be made to it. This is the first time that large-scale lysimeter designs have been compared over several years. The results shed light on lysimeter design methodology.
Lysimetry
Lysimeters have been used in agriculture and soil science for more than 100 years (Kohnke, Dreirelbis, and Davidson Citation1940; Lewis and Sjöstrom Citation2010). However, their use in environmental geotechnics, especially in landfills, is relatively recent (<20 years). Benson, Huaming, and Xiaodong (Citation1994) was one of the first significant studies to use the construction and instrumentation of large-scale lysimeters as a method for accessing the water balance on landfill final covers, knowing that a larger collection would provide a better representation of the heterogeneity and macro fissures of a real-scale plan. Subsequently, Bews et al. (Citation1997) demonstrated that the design of lysimeters for unsaturated soils requires special care, including factors such as: (1) installation depth; (2) lysimeter wall height dimensions; (3) width; (4) backfill material (hydraulic properties) and (5) an evaluation of the percolation rate to ensure an accurate performance. According to (O’Kane and Barbour Citation2003), the suction profile is key to understanding water flow in lysimeters that affect the flow regime by creating a zero pressure head, or water table, at the bottom and in which lateral deviation is one of the main problems for effective collection. To avoid flow deviation, Bews, Barbour, and Wickland (Citation1999) proposed that the suction values at two points, located at the “mouth” of the lysimeter, i.e., the elevation of the top of the lysimeter walls, inside and outside, should be equal. In other words, the water is not diverted from the lysimeter, and the lysimeter does not function as a sink. For this reason, the lysimeter side walls must be high enough so that the suction values develop in such a way that they are equal inside and outside. To avoid these deviations, Chiu and Shackelford (Citation2000) suggested that the width of a lysimeter should be at least five times the depth of the profile to be monitored. Mijares, Khire, and Johnson (Citation2012) presented the effect of depth on the percolation measured by pan lysimeters. Berger, Groengroeft, and Gebert (Citation2019), Ng et al. (Citation2019), and Williams et al. (Citation2020) further described methods for the construction design, and instrumentation as well as for estimating the performance of pan lysimeters.
Alternative Cover Assessment Program (ACAP)
The Alternative Cover Assessment Program (ACAP) included the construction and monitoring of 15 large lysimeters tested on the final covers of 12 different landfills across the United States. Monitoring of the test sections was carried out over 6 years. In light of the growing interest in less expensive, easily maintained alternative landfill cover designs that provide a great long-term protection of the environment (Bolen et al. Citation2001), the ACAP was set up to characterize the performance of alternative cover designs using water balance principles in different scenarios. To reduce collection inaccuracies caused by the changes in flow regime, the walls of the lysimeters were designed to reach the surface (Benson et al. Citation2001). This design provides a simple and precise estimation of percolation rates by minimizing the disadvantages associated with lysimeters including redundancy errors (Apiwantragoon, Benson, and Albright Citation2015). The problem of flux diversion – due to differences in suction values at the mouth of the lysimeter – is avoided. The lysimeters used in the ACAP project were able to provide flow measurements with an accuracy of between 0.00004 and 0.5 mm/year.
Linear method: a steady-state design methodology
According to Parent et al. (Citation2006), for a design steady-state seepage rate, qss, if the suction profile is nearly vertical at the elevation of the mouth of the lysimeter (unit hydraulic gradient; i.e. k = qss;), there is no difference in the total head value between ψint and ψext (Δψ = 0; ); in other words, the flow patterns inside and outside of the lysimeter are equal and the lysimeter is not affecting the flow regime. To have Δψ = 0, the height of the lysimeter must be at least equal to the height of the water column associated with the suction value obtained at the intersection between the hydraulic conductivity function (k-fct) of the material and the seepage rate, qss (). Irrespective of the position within the cover, if this height is selected, the lysimeter can measure deep percolation, unless cracks create preferential flow paths beyond the mouth of the lysimeter. To ensure that the k-fcts inside and outside of the lysimeter are the same, the material filling the lysimeter must be the same as the cover material and compacted to the same density (Bews, Barbour, and Wickland Citation1999; Zornberg and McCartney Citation2006).
Figure 2. Linear method.
Limitations of the linear method
The linear method has not been tested for extreme weather conditions caused by climate change. A compromise is always needed between wall height and loss of efficiency; tougher compromises may be needed under changing weather conditions. During periods of draught (or in very dry areas), seepage deviation – however minor – may occur due to differences in total head values at the elevation of the mouth of the lysimeter. It can be expected that very high walls would be required when inserting lysimeters within fine-grained soil covers. In such cases, the ACAP design would be more appropriate. These cases require further analysis. Ouedraogo et al. (Citation2022) recently published a parametric analysis of different lysimeter designs exposed to two different climates. They analyzed the influence of several parameters on the accuracy of seepage assessment, including the effect of depths of the lysimeter within the cover soil layer, climate, type of soil cover and lysimeter dimensions. Ouedraogo et al. (Citation2022) presented conditions where the linear method may or not function.
Materials and methods
Site
We conducted a field experiment at the St-Nicephore sanitary landfill in Drummondville, Canada (45°81’ N, 72°37’ W). The local climate is northern temperate with an average annual precipitation of approximately 1,050 mm, and an average annual potential evaporation of 360 mm, estimated using the Penman-Monteith (Penman Citation1948) equation. The landfill site has currently reached its third phase of expansion and forecasts receiving up to 430,000 tons of waste per year for a maximum period of 10 years. The test fields are located southwest of the leachate treatment plant ().
Experimental plot description and soil characterization
In 2018, two lysimeters were constructed within the same 135 m2 enclosure shown in . The top and bottom of the excavation followed the regulatory requirement of a 2% slope. A native silty sand was used to fill the lysimeters, with the same placement density inside and outside. With dimensions of 4.0 m × 4.0 m, the lysimeters were wrapped with a 1.5 mm thick HDPE geomembrane mounted on a wooden frame, and a 100 mm thick gravel layer was included at the bottom, overlaid by a 100 mm sand layer. While the gravel layer serves as drainage, the sand layer acts as a filter to prevent the fine-grained materials in the lysimeters from clogging.
The soil characterization results are summarized in . The particle size distributions of the soils were obtained according to Quebec standard BNQ 2501-025/2013. The SWRC were obtained from laboratory tests using the hydraulic property analyzer Hyprop (Meter Group), which determines the drying path (). The effect of hysteresis was not considered due to the complexity of measuring it. The k-fct of the materials () was obtained using the Mualem (Citation1976) formulation, based on the model proposed by van Genuchten (Citation1980), and the saturated hydraulic conductivity (ksat).
Figure 3. (a) SWRC and (b) k-fct.
Table 1. Soil properties.
In addition, the samples are limited to the study region according to natural conditions (i.e., intentionally flooded soils were excluded). Covers with resistive hydraulic elements (e.g., capillary barriers), geomembrane interface and construction material contact were not included. A summary of these aspects can be found in the previous study in Abdolahzadeh et al. (Citation2011).
L2: Hlys determination
As shown in the previous sections, for linear design methods, one fundamental aspect guiding lysimeter performance is the equality of suction values inside and outside at the level of the mouth of the lysimeter. If suction values are not equal, water avoids the lysimeter or is attracted into it (Bews, Barbour, and Wickland Citation1999). As shown in , the intersection between the k-fct and the seepage qss rate identifies the suction associated with the unit gradient, which ensures the equality of suction at the mouth of the lysimeter. By transforming suction from kPa into its equivalent height of the water column (kPa/9.81 m/s2), the desired height of lysimeter walls is obtained (Parent et al. Citation2006).
The steady-state design seepage rate reaching the elevation of the mouth of the lysimeter, qss = 3 × 10⁹ m/s, adopted in this project, corresponds to the difference between precipitation and evapotranspiration. This is a conservative value that ignores water storage (because the lysimeters were installed quite near the surface) and runoff, which is usually very low (Abichou et al. Citation2012; Woyshner and Yanful Citation1995).
Weather data was obtained from Environment and Natural Resources in Canada. The specific weather station is located at Saint-Germain-de-Grantham, the closest station to the St-Nicephore landfill. We adopted the period from 2013 to 2017 as representative for design purposes. The precipitation values are taken as they are. The evapotranspiration was calculated using the Penman (Citation1948) method.
graphically shows the application of the linear method, with suction values and the associated Hlys. The intersection between k-fct and qss is reached at a suction value of 12.4 kPa, which gives Hlys = 1.26 m. The L2 wall height includes the sand-gravel drainage layer (0.20 m) and a safety factor leading to a total of 1.5 m (). As previously mentioned, L1’s design is based on the ACAP. Consequently, its walls reach the ground surface (1.96 m: ). For L2, lysimeter walls determined using the linear method were higher than what would be required; this became a means of testing the limitations of the methodology in the field.
Instrumentation
The field instrumentation consisted of tensiometers (T4e, from Meter Inc.), water content sensors (5TM, from Meter Inc.) that allowed: 1) continuous assessment of the amount of water infiltrating through the lysimeter scenarios tested; 2) measurement of the quantity of runoff water from each enclosure; and 3) more accurate water balances to predict access for full-scale cover scenarios. illustrates the positioning of each probe, while details it.
Figure 4. (a) L1 section; (b) L2 section.
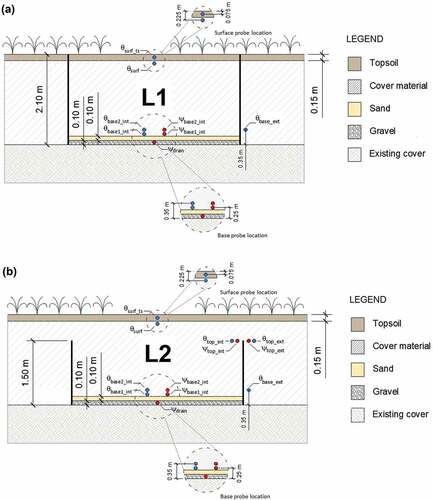
Table 2. Probe location designation.
The T4e tensiometers have a porous stone at their tip that allows the water contained within to come into contact with the soil water, which creates an ideal interface between the pores and the water. Thus, soil suction is transmitted directly to the pressure transducer, which provides a continuous signal to the data logger (DL6 manufactured by Delta-T Devices Inc); the data were recorded hourly. T4e operate from 100 kPa (water pressure) to 85 kPa (suction) with 0.10% accuracy. If soil suction exceeds 85 kPa, the dry porous stone and tensiometer must be refilled to ensure adequate saturation for operation. Prior to being installed in the field, all the tensiometers used in the project were first saturated in the laboratory according to the manufacturer’s process. Subsequently, weekly saturations were performed in the field as a maintenance procedure and to ensure the integrity of the instruments.
shows the tensiometer positions. The first nest was installed vertically aligned on the bottom of each lysimeter, the ψdrain was installed at the cover/drain interface, and ψbase1_int and ψbase2_int were installed 25 cm and 35 cm above respectively within the bottom of the lysimeter (insertion of ). The data collected were used to cross-reference the infiltration flows reaching the base of the lysimeters. Water content probes (5TM – by Meter Inc.), herein called θbase1_int and θbase2_int, were horizontally aligned with the tensiometers and completed the monitoring of the hydraulic behavior of the cover/drain interface. Each tensiometer was associated with a water content probe. Monitoring suction and moisture at different depths allowed the cross-calculation of the amounts of water collected by the lysimeters, i.e., deep percolation, and the assessment of the lateral deviation of the infiltrating water reaching the mouth of the lysimeters ψtop_int and ψtop_ext were installed at the elevation of the mouth of the L2 lysimeter (top of the formwork); one on the inside and the other on the outside, both 300 mm away from the lysimeter wall. The suction values obtained from these probes made it possible to monitor the lateral deviation (or its opposite, the convergence of water into the lysimeter) over time. The associated water content probes were θtop_int and θtop_ext. Surface moisture monitoring allows for an accurate assessment of evaporation fluxes. In the case of L1, these probes were not needed because the lysimeter wall reached the surface, thus deviation did not tend to be an issue. An additional 5 TM, θbase_ext, was installed outside the lysimeter aligned with the center of one of the walls, 350 mm above the bottom of the excavation. Prior to field installation, all project tensiometers and water content probes were preliminarily saturated in the laboratory according to the process described by the manufacturer. Subsequently, weekly checks were performed in the field, and the necessary maintenance procedures were followed.
Tipping counters (KIPP100, from Meter Inc. - depicted in ) to monitor surface and percolated water fluxes, and settlement plates (custom built) completed the site’s instrumentation. All data were recorded hourly.
Results and discussion
The monitoring period started in June 2018 and ended in October 2021. Data collection from tensiometers (started in May 2019) was interrupted each year from the end of October to April, i.e., during winter. Water content sensors, tipping buckets and weather stations remained in operation (although breakage and failure occurred at times). Water content sensor monitoring was maintained mainly to record temperatures.
presents the evolution of the accumulated percolation and precipitation over time for both lysimeters, while summarizes the field measurements. The accumulated precipitation during the monitoring period was 3,243.5 mm, while percolation in L1 was 1,211.5 mm, i.e., 37.4% of the total precipitation. For L2, the percolation was 1,124.4 mm, i.e., 34.7% of the total precipitation and 92.8% of the amount collected by the control lysimeter (L1). These results are consistent with the findings by Zhan et al. (Citation2017) in field measurements of water storage capacity in a loess – gravel capillary barrier cover at a landfill in China. When interpreting the water balance results of an alternative vegetated landfill cover, Abichou et al. (Citation2012) obtained a ratio of percolation over accumulated precipitation of between 39% and 56% in the first year of monitoring. In fact, the lysimeter performance is directly linked to its design, which may be an alternative explanation of what this author observed.
Figure 5. Evolution of percolation collected in L1 and L2.
Table 3. Precipitation, percolation, and field measurements for the different lysimeters.
Every year, around mid-September, a few precipitation events with higher intensities – followed by smaller events – led to significant increases in the amounts of water collected by the lysimeters (basal percolation). shows that 2021, was very warm and dry compared to the other monitoring years. Temperatures exceeded 30°C eighteen times from spring to autumn and rainfall events were also scarcer. Accumulations of more than 20 mm were recorded only 3 times, compared to 11 in 2018, 9 in 2019 and 13 in 2020. In general, there is a continuity in the flow of water through the cover soil which, depending on the hydraulic properties of the cover material, impacts the magnitude of the flow. It can indicate that net infiltration is more dependent on rainfall intensity than on the hydraulic conductivity of the water barrier. Rainfall intensities seen in the recorded period were not high enough to provide superior flow, as they did not exceed the infiltration capacity of the topsoil (Raij, Ben-Gal, and Lazarovitch Citation2018; Schneider et al. Citation2010; Williams et al. Citation2020).
It is noteworthy that L2, responded quite similarly to L1, a first indication that the design procedure worked well. Seepage data monitoring was maintained during winter to record potential thaw periods, such as the one that occurred during winter 2018/19, when the tipping bucket for L1 recorded infiltration (L2’s system had a breakage) and tipping counter spoons were often stuck due to freezing, leading to a flat percolation curve over time. But mainly, we did not want to miss the first days of thaw, in spring.
shows the evolution with time of volumetric water content and suction measured by a nest of water content sensors and tensiometers installed inside and outside of L2’s mouth, i.e., where one of the lysimeter walls ends. In 2020, ψtop_int and ψtop_ext (see insert on ; also in ) soil suctions peaked at 49 kPa, whereas the peak value in 2019 was 24 kPa, and 16 kPa in 2021. These values were recorded at approximately the same time of year (July). The lower hydraulic conductivity at this time of year associated with higher temperatures and less rainfall reflects on moisture, which translates into less percolation (Mijares, Khire, and Johnson Citation2012). However, field data show () an opposite trend.
Figure 6. Evolution of suction and volumetric water content at the mouth of L2.
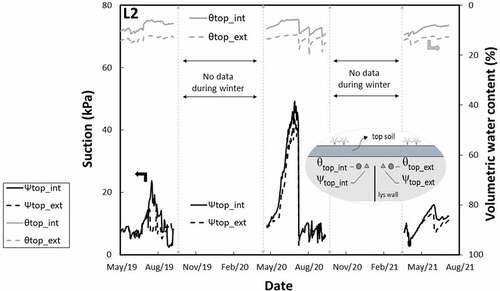
All tensiometers showed similar values, which could indicate an equilibrium of the flow regime. The difference in suction values was minimal (0.2 kPa, within sensor accuracy level) even during the driest period (summer 2019), when rainfall intensities were lower than 10 mm/day and the cumulated precipitation was approximately 350 mm (data not presented in ). The response of the tensiometers can also be analyzed concomitantly with the behavior of the soil moisture sensors. As shown in , decreases in water content values are associated with increases in suction, with the greatest variation occurring during the summer periods (between May and September).
One alleged key limitation of lysimeters is the impermeable boundary at its bottom that prevents the capillary rise of moisture. Accordingly, lysimeters would not be able to consider upward flow properly, therefore recharge around it would lead to a different flow regime inside the lysimeter. The results presented herein dismiss this concern. Indeed, it would not be possible to obtain similar suction values inside and outside of the walls, at the mouth of the lysimeter, were the flow regimes different. On the contrary, the proposed design led to similar flow regimes inside and outside of the lysimeter.
\The response of tensiometers and water content sensors placed just above the interface are presented in (for L1) and (for L2). These figures clearly show that the base of the two lysimeters behaved in a very similar fashion; as was the case at the mouth of the two lysimeters (). The values observed in the field show that the laboratory-obtained SWRC are quite representative of the actual material (cover soil) in the field. Further scrutiny shows that θsat would be slightly higher than what was obtained in the lab (≈36% versus the 30% shown in ), and the flat part of the SWRC () might be slightly sloped, as indicated by the small difference in θ values associated with the small increase in suction (ψbase1_int ≈1.2 kPa to ψbase2_int ≈1.8 kPa). We could not find any plausible explanation for the rather low θbase2 values in L1. It can only be hypothesized that the sensor was not responding well.
Figure 7. Evolution of suction and volumetric water content at the base of L1.
Figure 8. Evolution of suction and volumetric water content at the base of L2.
It is noteworthy that seepage was recorded even though suction values in the sand layer were not zero. This seems to confirm that seepage into the drainage layer occurs at a trigger value (McCartney and Zornberg Citation2010). For L1 and L2, this trigger value is approximately 1 kPa, which is equivalent to a column height of 10 cm, precisely the height above the gravel layer where the tensiometer was placed.
Conclusion
This paper presents the assessment of a simple lysimeter design methodology (referred to here as the “linear method”). The assessment was performed using data from large-scale field experiments where the response of a lysimeter designed according to this simple methodology (L2) was compared with the response of a control lysimeter (L1) designed following the Alternative Cover Assessment Program (ACAP) approach.
Based on three years of data obtained at the Saint-Nicephore landfill experimental site, percolations collected from both lysimeters were quite similar. The lysimeter constructed according to the linear method estimated about 92% of the control (ACAP lysimeter). No significant differences were observed between water content and soil suction data for sensors placed at the same elevations within the profiles along the two lysimeters. The tensiometers allowed continuous recording of total head values, thereby allowing assessment of possible deviation of percolation. As such, the sensors were a necessary cross-check validating the response of the lysimeters. Although the use of the linear method is limited to non-extreme climatic conditions, the quality and consistency of the database indicate that the lysimeter functioned properly and did not significantly affect the flow regime, therefore the percolation rate.
The following conclusions can be drawn from this field experiment:
The simple linear method – based on steady-state calculations – can be used as a conservative method to determine the height of lysimeter walls.
The lysimeter designed according to this method did not affect the flow regime seeping through the enclosure and responded in a similar manner as the control (“ACAP-like”) lysimeter. In other words, it was able to offer a good estimation of the seepage rate value through the cover.
An optimized lysimeter wall height can be obtained by imposing a non-zero suction condition at the bottom of the lysimeter during the design process. If such a “trigger” suction value is considered, the lysimeter wall heights are invariably lower, thereby simplifying installation and monitoring. Not considering the “trigger” suction leads to a conservative design. However, further investigation into this subject is needed.
The above conclusions shed light on lysimeter design for a multitude of purposes, including seepage control in landfills and infiltration estimation for hydrological studies.
Acknowledgements
The authors sincerely acknowledge the invaluable help of several undergraduate and graduate students, during characterization tests in the laboratory, construction, equipment installation and monitoring. We also wish to thank the WM Quebec Inc. personnel at the St-Nicephore landfill site for their help.
Disclosure statement
No potential conflict of interest was reported by the author(s).
Data availability statement
The authors confirm that the data supporting the findings of this study are available within this paper.
Additional information
Notes on contributors
Thierry Kahale
Thierry Kahale has a BSc. in Civil Engineering from the Universidade Federal do Parana (UFPR) Brazil, (2012). He completed his Ph.D. in civil engineering, at the Université de Sherbrooke, Quebec, Canada in 2022. Thierry has over six years of experience as a geotechnical engineer and currently works as a manager in the Mining Waste department at WSP Group.
Ousmane Ouédraogo
Ousmane Ouédraogo has a BSc. in Civil Engineering from Ecole Nationale de Travaux Publics, Burkina Faso (2015). He completed his master's degree in 2017 from École Polytechnique de Thiès (2017), Senegal. He is currently a PhD. student at the Université de Sherbrooke, Quebec, Canada.
Mauro Duarte Neto
Mauro Duarte Neto received his BSc. in Civil Engineering from the Escola Politecnica of the Federal University of Rio de Janeiro (UFRJ), Brazil (2013). He completed his Master's degree in 2019 at the Université de Sherbrooke, Quebec, Canada. He has thirteen years experience as a project manager in civil engineering and infrastructure projects. He is currently project leader in environmental management and landfill implementation for WSP Group.
Virginie Simard
Virginie Simard received her BSc. in Civil Engineering from Université de Sherbrooke, Québec, Canada (2017). She completed her master's degree in 2019 from the same institution. Virginie currently holds the position of engineering project manager for the municipality of Saint-Jérôme Quebec.
Alexandre R. Cabral
Alexandre R. Cabral, P.Eng, received his Bsc. from PUC-Rio, Brazil, in 1981, his M.Sc. at École Polytechnique de Montreal, in 1988, and his Ph.D. at McGill University, Quebec, Canada, in 1992. He started his academic career at Université de Sherbrooke in 1994. His main research interests are methane oxidation biosystems for the reduction of greenhouse gas emissions, unsaturated flow through porous media, and classical geotechnical issues, such as soil compaction. He is currently leading research projects in all these areas. He has co-authored papers published in geotechnical, environmental engineering and science-oriented journals.
References
- Abdolahzadeh, A. M., B. L. Vachon, and A. R. Cabral. 2011. Assessment of the design of an experimental cover with capillary barrier effect using 4 years of field data. Geotech. Geol. Eng. J. 29 (5):783–802. doi:10.1007/s10706-011-9417-x.
- Abichou, T., X. Liu, and K. Tawfiq. 2006. Design considerations for lysimeters used to evaluate alternative earthen final covers. J. Geotech. Geoenviron. Eng. 132 (12):1519–25. American Society of Civil Engineers. doi:10.1061/(ASCE)1090-0241(2006)132:12(1519).
- Abichou, T., J. Musagasa, L. Yuan, J. Chanton, K. Tawfiq, D. Rockwood, and L. Licht. 2012. Field performance of alternative landfill covers vegetated with cottonwood and eucalyptus trees. Int. J. Phytoremediation. 14 (sup1):47–60. Taylor & Francis. doi:10.1080/15226514.2011.607869.
- Albright, W. H., and C. H. Benson. 2002. Alternative cover assessment program 2002 annual report. U.S. Environmental Protection Agency.
- Albright, W. H., C. H. Benson, G. W. Gee, A. C. Roesler, T. Abichou, P. Apiwantragoon, B. F. Lyles, and S. A. Rock. 2004. Field water balance of landfill final covers. J. Environ. Qual. 33 (6):2317–32. doi:10.2134/jeq2004.2317.
- Apiwantragoon, P., C. H. Benson, and W. H. Albright. 2015. Field hydrology of water balance covers for waste containment. J. Geotech. Geoenviron. Eng. 141 (2):4014101. American Society of Civil Engineers. doi:10.1061/(ASCE)GT.1943-5606.0001195.
- Benson, C., T. Abichou, W. H. Albright, G. Gee, and A. Roesler. 2001. Field evaluation of alternative earthen final covers. Int. J. Phytoremediation 3 (1):1–21. doi:10.1080/15226510108500052.
- Benson, C. H., Z. Huaming, and W. Xiaodong. 1994. Estimating hydraulic conductivity of compacted clay liners. J. Geotech. Eng. ASCE 120 (2):366–87. doi:10.1061/(ASCE)0733-9410(1994)120:2(366).
- Berger, K., A. Groengroeft, and J. Gebert. 2019. 20 years performance measurements of a landfill cover system with components constructed from pre-treated dredged sediments. Waste Manag. 100:230–39. Elsevier. doi:10.1016/j.wasman.2019.09.016.
- Bews, B., S. L. Barbour, and B. Wickland. 1999. Lysimeter design in theory and practice. Proceedings of Tailings and Mine Waste, Fort Collins, Colorado, USA, January 24–27.
- Bews, B. E., M. A. O’Kane, G. W. Wilson, D. Williams, and N. Currey. 1997. The design of a low flux cover system, including lysimeters, for acid generating waste rock in semi-arid environments. Proceedings of 4th International Conference on Acid Rock Drainage (ICARD), Vancouver, 747–62.
- Bolen, M. M., A. C. Roesler, C. H. Benson, and W. H. Albright. 2001. Alternative cover assessment program: Phase II report. Geo-Engineering Report, no. 01–10.
- Chiu, T.-F., and C. D. Shackelford. 2000. Laboratory evaluation of sand underdrains. J. Geotech. Geoenviron. Eng. 126 (11):990–1001. American Society of Civil Engineers. doi:10.1061/(ASCE)1090-0241(2000)126:11(990).
- Kempton, H. 2012. A review of scale factors for estimating waste rock weathering from laboratory tests. Proceedings of the 9th International Conference on Acid Rock Drainage, Ottawa, Canada.
- Kohnke, H., F. R. Dreirelbis, and J. M. Davidson. 1940. A survey and discussion of lysimeters and a bibliography on their construction and performance. Washington, DC: United States Department of Agriculture.
- Lacroix Vachon, B., A. M. Abdolahzadeh, and A. R. Cabral. 2015. Predicting the diversion length of capillary barriers using steady state and transient state numerical modeling: Case study of the Saint Tite des Caps landfill final cover. Can. Geotech. J. 52 (12):2141–48. doi:10.1139/cgj-2014-0353.
- Lewis, J., and J. Sjöstrom. 2010. Optimizing the experimental design of soil columns in saturated and unsaturated transport experiments. J. Contam. Hydrol. 115 (1–4):1–13. Elsevier. doi:10.1016/j.jconhyd.2010.04.001.
- Liu, X. 2004. Design of cost effective lysimeter for field evaluation of alternative landfill cover projects using Hydrus 2d simulation. Tallahassee, Florida: Florida State University.
- McCartney, J. S., and J. G. Zornberg. 2010. Effects of infiltration and evaporation on geosynthetic capillary barrier performance. Can. Geotech. J. 47 (11):1201–13. doi:10.1139/T10-024.
- Mijares, R. G., M. V. Khire, and T. Johnson. 2012. Field-scale evaluation of lysimeters versus actual earthen covers. Geotech. Test. J. 35 (1):31–40. ASTM International.
- Mualem, Y. 1976. A new model for predicting the hydraulic conductivity of unsaturated porous media. Water Resour. Res. 12 (3):513–22. doi:10.1029/WR012i003p00513.
- Muniruzzaman, M., T. Karlsson, N. Ahmadi, P. M. Kauppila, T. Kauppila, and M. Rolle. 2021. Weathering of unsaturated waste rocks from kevitsa and hitura mines: Pilot-scale lysimeter experiments and reactive transport modeling. Appl. Geochem. 130:104984. Elsevier. doi:10.1016/j.apgeochem.2021.104984.
- Ng, C. W., R. Chen, J. L. Coo, J. Liu, J. Ni, Y. M. Chen, L. Zhan, H. W. Guo, and B. W. Lu. 2019. A novel vegetated three-layer landfill cover system using recycled construction wastes without geomembrane. Can. Geotech. J. 56 (12):1863–75. NRC Research Press. doi:10.1139/cgj-2017-0728.
- O’Kane, M., and S. L. Barbour. 2003. Predicting field performance of lysimeters used to evaluate cover systems for mine waste. Proceedings Sixth International Conference on Acid Rock Drainage, Cairns, QLD, 327–39.
- Ouedraogo, O., M. Duarte Neto, T. Kahale, T. Abichou, and A. R. Cabral. 2022. Parametric analysis of the efficacy of lysimeter designs using numerical modelling. Geotech. Geol. Eng. J. doi:10.1007/s10706-022-02219-1.
- Parent, S. E., and A. Cabral. 2006. Design of inclined covers with capillary barrier effect. Geotech. Geol. Eng. J. 24 (3):689–710. doi:10.1007/s10706-005-3229-9.
- Parent, S. E., A. Cabral, G. Gras, and F. Marinho. 2006. Design and installation of zero-tension lysimeters in an inclined cover. Am. Soc. Civil Eng. Geotech. Spec. Pub. 147:625–33. doi:10.1061/40802(189)48.
- Penman, H. L. 1948. Natural evaporation from open water, bare soil and grass. Proc. R. Soc. London a Math. Phys. Sci. 193 (1032):120–45. The Royal Society London.
- Raij, I., A. Ben-Gal, and N. Lazarovitch. 2018. Soil and irrigation heterogeneity effects on drainage amount and concentration in lysimeters: A numerical study. Agric. Water Manag. 195:1–10. Elsevier. doi:10.1016/j.agwat.2017.09.012.
- Schneider, A., T. Baumgartl, D. Doley, and D. Mulligan. 2010. Evaluation of the heterogeneity of constructed landforms for rehabilitation using lysimeters. Vadose Zone J. 9 (4):898–909. Soil Science Society of America. doi:10.2136/vzj2009.0172.
- Urrutia, P., W. Wilson, C. Aranda, H. Peterson, S. Blackmore, F. Sifuentes, and M. Sanchez. 2011. Design and construction of field-scale lysimeters for the evaluation of cover systems at the Antamina Mine, Peru. University of British Columbia.
- van Genuchten, M. T. 1980. A closed-form equation for predicting the hydraulic conductivity of unsaturated soils. Soil Sci. Soc. Am. J. 44 (5):892–98. doi:10.2136/sssaj1980.03615995004400050002x.
- Vriens, B., B. Plante, N. Seigneur, and H. Jamieson. 2020. Mine waste rock: Insights for sustainable hydrogeochemical management. Minerals 10 (9):728. Multidisciplinary Digital Publishing Institute. doi:10.3390/min10090728.
- Williams, M. R., O. Coronel, S. J. McAfee, and L. L. Sanders. 2020. Preferential flow of surface‐applied solutes: Effect of lysimeter design and initial soil water content. Vadose Zone J. 19 (1):e20052. Wiley Online Library. doi:10.1002/vzj2.20052.
- Woyshner, M. R., and E. K. Yanful. 1995. Modelling and field measurements of water percolation through an experimental soil cover on mine tailings. Canadian Geotechnical Journal 32 (4):601–09. doi:10.1139/t95-062.
- Zhan, L., G. Li, W. Jiao, T. Wu, J. Lan, and Y. Chen. 2017. Field measurements of water storage capacity in a loess–gravel capillary barrier cover using rainfall simulation tests. Can. Geotech. J. 54 (11):1523–36. NRC Research Press. doi:10.1139/cgj-2016-0298.
- Zornberg, J. G., A. Bouazza, and J. S. McCartney. 2010. Geosynthetic capillary barriers: Current state of knowledge. Geosynth. Int. 17 (5):273–300. Thomas Telford Ltd. doi:10.1680/gein.2010.17.5.273.
- Zornberg, J., and J. McCartney. 2006. Evapotranspirative cover systems for waste containment. In The handbook of groundwater engineering, ed. J. Delleur, 341, 3413431, 3431, 2nd ed. CRC Press. doi:10.1201/9781420006001.ch34.