
 ?Mathematical formulae have been encoded as MathML and are displayed in this HTML version using MathJax in order to improve their display. Uncheck the box to turn MathJax off. This feature requires Javascript. Click on a formula to zoom.
ABSTRACT
Based on statistical data from 2005 to 2019, we used the back propagation (BP) neural network model to predict the production amount of plastic waste in Chengdu. In addition to the amount of waste produced we wanted to achieve an understanding of its composition and environmental impacts. Compositions of plastic waste were analyzed by sampling. Particulate matter in the air and greenhouse gas emissions (GHGs) from plastic waste incineration, bisphenol A (BPA) from plastic waste landfills, were also evaluated. Results indicated that (a) economic development, urban construction level, and residents’ consumption were pusitively correlated to different degrees to plastic waste production; (b) the production of plastic waste in Chengdu in 2025 and 2030 will reach 865.3 and 931 kilotons (Kt), respectively; (c) high density polyethylene (HDPE) and polypropylene (PP) are the two main components of plastic waste in Chengdu and accounted for 40.17% and 24.96%, respectively; (d) different degrees of environmental impacts occurred during plastic waste incineration and landfill (taking 2019 as an example, the incineration of plastic waste in Chengdu produced between 2874.82 and 4711.73 tons of inhalable particulate matter (PM) and emitted between 725.4 and 867.4 Kt of CO2, and between 65.02 and 910.27 kg of bisphenol A (BPA) leached from sanitary landfills); (e) positive policies and measures from the beginning to the end-of-life of plastics should be carried out in the future, which would improve the level of plastic waste management in Chengdu and mitigate the side-impacts from plastic waste treatment and disposal.
Implications: The implications of this article are
Generation trends of plastic waste were revealed by a BP neural network model, which provided essential data for authorities to make decisions on waste management.
Influencing factors affecting plastic waste generation were analyzed, which will strongly support policy considerations regarding plastic waste control.
This investigation first explored and reported the compositions of plastic waste mixed with municipal solid waste (MSW), which yielded valuable information concerning plastic waste and details concerning the impacts of plastic waste disposal processes.
Those results of this investigation, being published here for the first time, will guide plastic waste management in Chengdu and could also provide useful information to other cities regarding that issue.
Plastics have been produced and used on a large scale since the 1950s and have been one of the most important products for daily life and for raw materials for industrial manufacturing (Muralisrinivasan and Natamai Citation2019). With economic growth and an improvement in the standard of living, durable, lightweight, versatile, and inexpensive, plastics in unprecedented amounts were applied to daily use (Liu et al. Citation2021). The lifespan of different plastic products varies considerably. Borrelle et al. (Citation2020) pointed out that plastic packaging has a shorter life than that of other types of plastics. Packaging used for shipping, transport, shopping, and so on have an average lifespan of 0.5 years. Therefore, a huge amount of plastic waste is generated and discharged. Globally, 460 million tonnes (Mt) of plastics were consumed in 2019, and about 353 Mt and 26.74 Mt of plastic waste was generated around the world and in China, respectively (OECD Citation2022; Sun et al. Citation2022).
The OECD (Citation2022) reported that only 55 Mt of plastic waste was recycled, and 174 Mt and 67 Mt were landfilled and incinerated, respectively. Unexpectedly, almost 22 Mt of plastic waste were released into the aquatic environment (rivers, lakes, and oceans) through mismanagement. It is well-known that plastic needs over one hundred years to degrade in nature, and the impacts of plastic waste have drawn much public attention in the last few decades. For collected and treated plastic waste, greenhouse gas emissions (GHGs) from incineration have aggravated global warming (Buendia et al. Citation2019; IPCC Citation2006). The OECD (Citation2022) reported that the amount of GHGs from the plastics lifecycle in 2019 was estimated to be 1.8 billion tonnes (i.e. 3.4% of total emissions). Bisphenol A (BFA) leaching from landfills threatened the safety of groundwater (Xu et al. Citation2011), accumulated in sludge (Song et al., Citation2014), and entered the food chain (Liao and Kannan Citation2014). From leaked plastic waste, micro/nano-plastics formed from macro-plastics, was spread by airflow, streams, rivers, and finally gathered in lakes, reservoirs, and oceans. Research provides evidence that micro/nano-plastics has interfered with the activities of propagation and growth of aquatic flora and fauna (Cheung et al. Citation2018; Zong et al. Citation2021; Xia et al. Citation2022).
Chengdu is a provincial capital and also the center of economy, education, culture, and tourism of Sichuan province in southwest China. Chengdu had a population of 20.94 million in 2020 (Statistical Bureau of Sichuan, and NBS Survey Office of Sichuan Citation2021). According to the statistical data of the Ministry of Housing and Urban Development (Citation2021), the amount of municipal solid waste (MSW) in Chengdu amounted to 1.38 Mt in 2005 to 6.86 Mt in 2019, with an annual average increase of 12.12%. Usually, the amount of plastic waste as a percentage of MSW is second only to kitchen waste and paper waste—a huge amount of plastic waste is mixed and treated with MSW. Public concerns about plastic waste grew with the existence of “white pollution,” recently, and evaluation of the impacts of plastic waste is in great demand, especially with respect to GHGs. At present, information and data on the generation, collection, treatment, and impacts of plastic waste is unclear in Chengdu. According to the Regulations of Chengdu Municipal Solid Waste Management, the sorting of MSW began on March 1, 2021. Under this condition, this investigation tried to figure out the amount in the past and the future trends of generation of plastic waste to evaluate the impacts of plastic waste in Chengdu, which aimed to improve plastic waste management and alleviate impacts from mismanagement.
From the insights of the past and present, the economy, urban construction, lifestyle, and so forth of Chengdu have soared, and previous investigations pointed out that GDP and population have a significant relation to the generation of MSW and plastic waste (Kaza et al. Citation2018). Wen (Citation2014), Caiyun et al. (Citation2019), Mengxun and Yongqi (Citation2019), Wenlong and Zhenwu (Citation2020) adopted a gray model (GM) and/or back propagation (BP) neural network to forecast the generation trend of MSW; results were acceptable and credible. Thus, GM (1,1) and BP models were applied in this study to predict plastic waste generation trends to 2030 in Chengdu. Furthermore, we chose different sites (residential areas, commercial districts, public institutions, and MSW transfer stations) of plastics flow to sample and analyze the compositions of plastic waste in Chengdu in 2021, which contributed to the evaluation of the impacts of plastic waste.
Plastic waste in Chengdu
Plastic waste generation trend
Source data
The generation of MSW or plastic waste were closely related to population, economy (GDP), residents’ standard of living (income, consumption cost), urban construction (developed areas and greenbelt), and tourism (Hong et al. Citation2017; Kumar et al. Citation2018; Weiguang et al. Citation2020). We collected and analyzed historical data from literature and yearbooks (Statistical Bureau of Sichuan, and NBS Survey Office of Sichuan Citation2021; Weiguang et al. Citation2020), and we compiled influencing factors, including GDP, average disposable personal income (DPI), average personal consumption expenditure (PCE), total retail sales (TRS), built up area (BuA), greenbelt area (GbA), and populations of tourists and residents from 2005 to 2019 in Chengdu (Table S1).
Modelling
A gray model (GM) for prediction, established by Chinese scholars in 1982, correctly described and objectively obtained the evolution behavior and law of a specific system with discrete data (Yaoguo, Sifeng, and Zhengxin Citation2009). Previous studies found that GM (1,1) could determine the generation trend of MSW and construction waste effectively (Caiyun et al. Citation2019; Wenlong and Zhenwu Citation2020). This investigation collected discrete source data to predict GDP, DPI, PCE, TRS, BuA, GbA, and populaton of tourists and residents from 2020 to 2030 in Chengdu. Results are shown in Table S2.
BP, first proposed in 1986, and now one of the most popular neural network models, is a multilayer feed-forward network trained by an error back-propagation algorithm (Rumelhart, Hinton, and Williams Citation1986). Generally, BP algorithms include input layer nodes, output layer nodes, and one or more hidden layer nodes. Briefly, a signal of the input layer is propagated to the hidden layer node, firstly, and then the output signal of the hidden layer node is propagated to the output layer node after the action function. Finally, output of the predicted results is obtained (Mi, Ma, and Zou Citation2005). In addition, the number of hidden layer nodes is accorded to the input and output layer as the EquationEquation (1)eq 1(1)
(1) (Huayu et al. Citation2008),
where, ni, no represented the number of input, output layer nodes, respectively, the value of α is [1, 10].
In the present study, eight parameters (GDP, DPI, PCE, TRS, BuA, GbA, population of tourists and residents) that affected the generation of plastic waste were input and then propagated to six hidden layer nodes according to EquationEquation (1)(1)
(1) After the back propagation algorithm and action function were applied, a plastic waste generation prediction was output. Therefore, a BP model of “8-6-1” was established and trained.
Compositions of plastic waste
To get a better and deeper understanding of the impacts of plastic waste in Chengdu, field investigations were carried out. According to the requirements of “MSW sampling and physical analysis methods” (Ministry of Housing and Urban Development, P.R.China Citation2009) and based on reality and operability, plastic waste samples were collected and analyzed (March to May in 2021). As mentioned earlier, Chengdu began MSW sorting on March 1, 2021. Samples of plastic waste from residential areas, commercial districts, public institutions, and an MSW transfer station (from waste generation to collection and transfer) were collected all on the same day. In all, between 30 and 200 kg of MSW (mixed with discharged plastics) were sampled by quartering (details in Supplementary materials).
Specific compositions of plastic waste were identified by Signs of Plastic Products (State Administration of Quality Supervision, Inspection and Quarantine, P.R.C, and P.R.C Standardization Administration Citation2008) and Simple Methods for Identification of Plastics (Dietrich Citation2021) and coupled with the heating characteristics of plastics to classify the plastic waste as PET, HDPE, PVC, LDPE, PP, PS, and others (See Table S3).
Results and discussion
Plastic waste generation trend
Studies (Borrelle et al. Citation2020; Khan, Kumar, and Samadder Citation2016) have shown that GDP, PCE, TRS, BuA, GbA and the population of tourists and residents have different degrees of effects on the generation of MSW. According to correlation analysis, the generation of plastic waste significantly related with MSW. Figure S1 depicts the correlation analysis between plastic waste and influencing factors in the order of BuA, population of tourists, TRS, GDP, GbA, DPI, PCE, and residents population, which was consistent with results of a study of Beijing (Jiang, Wen, and Luo Citation2020).
The generation trend of plastic waste from 2005 to 2019 is depicted in , which presents two different periods: (a) from 2005 to 2012 plastic waste generation was about 200 Kt annually and (b) from 2012 to 2019, the amount increased sharply (227.5 Kt in 2012 to 765.5 Kt in 2019). As shown in Table S1, the portion of plastic waste decreased from 10.76% in 2009 to 8.99% in 2013, which resulted from the release of “plastic limited use” policies being adopted in 2008, but the amount of plastic waste climbed with MSW. In addition, the personal average production of plastic waste in Chengdu went from 0.05 to 0.091 kg/capita/day (2005–2012) and then increased from 0.1 to 0.169 kg/capita/day (2013–2019), which were lower than that of Shenzhen (0.20–0.33 kg/capita/day). Shenzhen is more urbanized and has a higher GDP than Chengdu (2770 and 1770 billion Yuan, respectively), hence, more plastic waste is generated from daily use.
Figure 1. Plastic waste generation trend and predications for Chengdu (2005–2030).
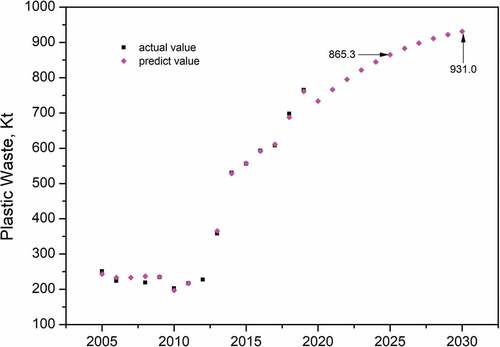
The trained BP model showed a high consistent value of prediction compared with the actual value (), which means the trained BP model of “8-6-1” could predict the generation of plastic waste trend precisely. According to the BP model, the amount of plastic waste from MSW will reach 865.3 Kt in 2025 and 931.0 Kt in 2030. This represents sustainable growth with an annual average percentage increase of 5.52%. After March 1, 2021, Chengdu began to sort MSW into four categories of waste—kitchen waste, recyclables, hazardous waste, and other waste. Plastic waste classified as “other wastes” will either be landfilled or incinerated according to the Regulations of Chengdu Municipal Solid Waste Management.
Compositions of plastic waste
To gain a deeper insight into the impact of plastic waste, plastic compositions analysis was carried out. Normally, use of products made from PET, HDPE, PVC, LDPE, PP, PS, and others was common in daily life. Previous investigation and regulation by authorites pointed out that plastic attached with food was classified as other waste (“less value”) and then it was discharged into the MSW.
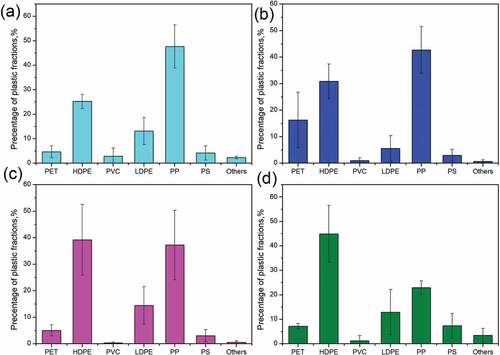
Compositions of plastic waste in Chengdu are depicted in : PP and PE (HDPE and LDPE) were the main constituents of plastic waste in Chengdu. Specifically, PP dominated the plastic waste in commercial districts and public institutions and accounted for 42.72 (±8.83)% and 47.68 (±8.88)% of the total plastic waste, respectively. From the field investigation, PP was almost all food packages such as boxes, cups, and so forth and polluted by food residue. Meituan (Citation2021) reported that food delivery in Chengdu ranked fifth in China by amount, which resulted in huge amounts of PP use and disposal. Meanwhile, e-commerce boomed in China in the last few years; on-line shopping required large amounts of packaging plastic (HDPE or LDPE were the most common raw materials), the portion of H/LDPE discharged from single-use plastic bags, food wrappers, films, and so on at public institutions and commercial districts were 25.23 (±2.87)% and 30.85 (±6.55)%, respectively, for HDPE and 13.09 (±5.51)% and 5.58 (±4.85)%, respectively, for LDPE. In residential areas and at the MSW transfer station, the largest portion was HDPE, accounting for 9.22 (±13.28)% and 44.91± (11.62)%, respectively. PP was the second largest component and accounted for 37.30 (±13.12)% and 22.93 (±2.77)%, respectively. After the COVID-19 outbreak, the need for online shopping accelerated sharply, hence, a large amount of plastic packaging was thrown out. The rise in the amount of plastic from packaging in the waste stream of Chengdu () represented the change of lifestyles; with an improvement in living standards, plastic products made from PP and PE became indispensable.
Figure 2. Plastic waste composition in (a) public institutions, (b) commercial districts, (c) residential areas, and (d) the waste transfer station of Chengdu.
The above mentioned plastics are of “less value” and classified as “other waste” in Chengdu and then are collected, transferred, and disposed of with MSW. PET, almost all kinds of bottles, has more value for recycling and is collected by waste pickers. Therefore, there is a low percentage of PET left in MSW stream according to the present investigation.
Microplastics from mismanagement
The OECD (Citation2022) claimed that mismanaged plastic waste amounted to 2200 Mt globally, and about 12% of the total evolved to micro-plastics (MPs) and were dispersed in wastewater sludge, dust, water, and soils. Recently, research has pointed out that MPs have a negative impact on the growth of plants (Sarker et al. Citation2020; Zong et al. Citation2021). Toxic chemicals released from aged MPs (Azanu et al. Citation2016; Yin et al. Citation2021) and heavy metals or antibiotics absorbed by MPs has caused severe potential risks for the environment (Adil, Rowland, and Thompson Citation2012; Biamis, O’ Driscoll, and Hardiman Citation2021; Jiang Citation2021).
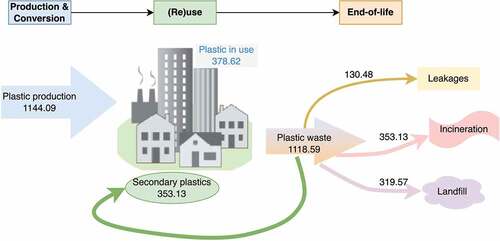
This investigation based on the plastic flow and results of Kaza et al. (Citation2018), found that plastics undergo three processes—“production and conversion”, “(re)use”, and “end-of-life”. In 2019 (), about 1144.09 Kt of plastic products was produced and consumed in Chengdu. This generated about 1118.59 Kt of plastic waste, of which 353.13 Kt was recycled, 319.57 Kt was landfilled, 315.42 Kt was incinerated, and 130.48 Kt leaked into the environment through mismanagement. Hence, about 15.66 Kt of micro-plastics formed and entered the environment as wastewater sludge, dust, water, and soils. To figure out the potential risks from leaked plastic waste, further investigation and evaluation are needed.
Figure 3. Plastic flow in Chengdu in 2019.
Impacts of plastic waste landfill and incineration
Impacts of plastic waste has garnered much attention from the public, with respect to the various environmental impacts or issues that would arise under different plastic waste treatment scenarios. As shown in , plastic waste in Chengdu was either incinerated or landfilled. According to results of investigations from home and abroad, GHGs and particulates (i.e. particulate matter, PM) emitted from plastic waste incineration and bisphenol A (BPA), leached from landfilled plastic waste, received the most attention. We calculated and evaluated the impacts of plastic waste incineration and landfill.
Incineration scenario
Collected plastic waste in Chengdu was treated along with MSW, shows more than 100 Kt of plastic waste was incinerated annually from 2013. Relative studies indicated that the coefficients of PM were 13.1 ± 7.5 ~ 34.8 (±4.5) g PM/kg of plastic (Kumar et al. Citation2018; Park, Kim, and Young Min Citation2013; Wu et al. Citation2021), and GHGs from plastic incineration were calculated as EquationEquation (2)(2)
(2) (IPCC Citation2006).
where W represents the amount of incinerated plastic in Kt/year, CF and FCF stand for the carbon and fossil carbon in plastic, with a default value of 75% and 100%, respectively, OF is the oxidation factor; and 44/12 is a conversion factor from C to CO2.
Figure 4. Incineration and landfill disposal of plastic waste in Chengdu (2010–2020).
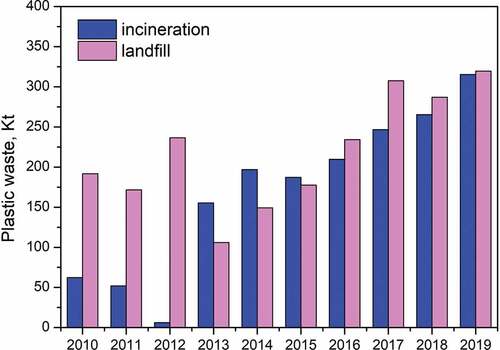
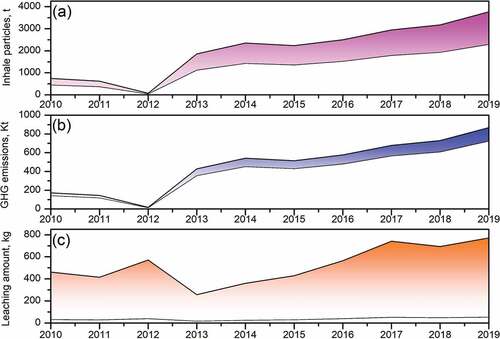
As depicted in , PM emissions amounted to 453.88–743.89 tonnes in 2010 and reached 2874.82–4711.73 tonnes in 2019, which put heavy burdens on flue gases cleaning units and especially represented a greater demand for bag filters. With the incineration quantity increased, heavy metals and dioxins would be absorbed on emitted PM and pose a potential risks to environment.
Fossil carbon (FC) dominated in plastic waste and converted to CO2 through the oxidation process. Therefore, the amount of GHGs changed along with the plastic waste incineration (). According to IPCC (Citation2006) and OECD (Citation2022), the CO2 emission factors of plastic waste incineration were between 2.3 and 2.75; evaluation results show that between 143.3 and 171.3 Kt CO2 was emitted into the atmosphere in 2010. In 2019 CO2 emissions were 5 times higher than that in 2010 (i.e. 725.4–867.4 Kt). Waste-to-energy was adopted widely because of advantages of energy recovery and easy operation. However, FC almost formed CO2 during the incineration process, GHGs soared in recent years with MSW and plastic wastes generation, which will inevitably hinder the goals of the “carbon emissions peak” in 2030 and “carbon emissions balance” 2060, respectively. Hence, recovery, reuse, recycling will serve to mitigate GHGs and PM in plastic waste.
Figure 5. Evaluation on (a) particulates, (b) GHG emissions from plastic waste incineration, and (c) BAF leaching from plastic waste landfilling in Chengdu (2010–2019).
Landfill scenario
Bisphenol A (BPA), an important additive chemicals for plastic production, could release to leachates during the lifespan of landfill sites (Su-Yun et al. Citation2011). The typical leachate treatment units were not aimed at decomposing BPA in China, BPA would accumulate in sludge and then enter the food chain by land application of sludge, which posed potential food risks for humans (Liao and Kannan Citation2014; Song et al. Citation2014). Su-Yun et al. (Citation2011) reported the leaching coefficient of BPA from plastic waste in landfills was between 0.3 and 4.2 μg of BAF/kg plastic. As depicted in , 191.6 Kt of plastic waste was landfilled in 2010 and between 33.01 and 462.17 kg of BPA leached out. By 2019, the amount of plastic waste landfilled increased to 377.3 Kt, and between 65.02 and 910.27 kg of BPA was released ().
PM, GHGs, and BPA related to plastic waste incineration and landfill were the public concerned issues so far, and micro-plastics and nano-plastics were emerging pollutants recently also garnering much attention. Authorities in China issued a plastic bag limited use policy in 2008 and started the prelude to plastics pollution control: a series of laws and regulations were amended and issued (Liu et al. Citation2021). On March 1, 2021, authorities of Chengdu released the Regulations of Chengdu Municipal Solid Waste Management and aimed to establish a system of MSW source separation and to maximize the utilization rate.
Suggestions for plastic waste management in Chengdu
From the results of this investigation, the generation of plastic wastes in Chengdu increased with the amount of MSW, and its generation trend was closely related to MSW, city development level, population, and economy in the past decade. The amount of plastic waste tripled, and will increase stably in the future, reach 865.3 Kt and 931.0 Kt in 2025 and 2030, respectively. Although source sorting for MSW was piloted in 2001, plastic wastes in MSW didn’t change remarkably due to habits of consumers. Table S1 shows that the percentage of plastic in MSW stayed at more than 11% of the total MSW. Hence, with the increase of MSW generation plastic waste has increased year by year. At present and in the future, MSW and plastic wastes are and will be either incinerated or landfilled, therefore, the impacts of plastic waste should not be ignored. We suggest the following measures to improve plastic waste management in Chengdu: (a) encourage and regulate plastic products at the designing stage, such as straightforward and clear signs and easy to disassemble parts, which will make separation and disposal easier for consumers; (b) employ the cooperation model of Government-Public, which will shift the Up-to-Down strategy to multicooperation (Cimpan et al. Citation2015; Lu and Roman Citation2019) and avoid and reduce plastic waste leakage; (c) create cost-effective technologies for source separation and distribute information to the publice to guide and encourage the public to form the habits of plastic sorting in daily life; (d) promote environmentally friendly plastic products (i.e. bio-based plastics) (Chen et al. Citation2021), which will mitigate the side-effects of life-span of plastics; (e) combustion and heat recovery units should be optimized and improved at the “end-of-life” stage for plastics and electricity (avoid product) from turbine should offset uses of GHGs as much as possible.
Conclusion
This investigation drew the following conclusions:
Plastic waste generation trend and prediction. Generation of plastic waste in Chengdu was between 0.058 and 0.091 kg/capita/day between 2005 and 2012 and then increased to between 0.1 and 0.169 kg/capita/day between 2013 and 2019. In the coming decade, the annual production amount of plastic waste in Chengdu will increase stably and reach 931 Kt by 2030, which will put a heavy burden on the regulation, treatment, and disposal of the end-life of plastics.
Plastic waste compositions. HDPE- and PP-dominated plastic waste in Chengdu, accounted for 40.17% and 24.96%, respectively. Take-out foods and e-economy bloomed in recent years, which resulted in a great increase in plastic packaging. HDPE and PP were the main polymer raw materials for producing plastic packagings.
Plastic waste impacts. Secondary impacts occurred during plastic waste incineration or landfilling. Air-borne particles and GHGs were evaluated for the incineration scenario, with results indicating that PM emissions amounted to between 453.88 and 743.89 tonnes in 2010 and reaching between 2874.82 and 4711.73 tonnes in 2019. Between 143.3 and 171.3 Kt CO2 was emitted to the atmosphere in 2010. In 2019 CO2 emissions were five times higher than that in 2010 (i.e. 725.4-867.4 Kt). For the landfill scenario, about 33.01-462.17 kg BPA leached out by 2019 releasing between 65.02 and 910.27 kg BPA
Suggestions on plastic waste management. Authorities should conduct positive policies and measures from the plastic products designing stage to encourage (re)use and ‘end-of-life’ of plastics, which will effectively improve plastics recovery, reduce plastics leakage from mismanagement, and mitigate side-impacts from end treatment and disposal.
Supplementary_materials-Clean.docx
Download MS Word (366.4 KB)Disclosure statement
No potential conflict of interest was reported by the authors.
Data availability statement
The authors confirm that the data supporting the findings of this study are available within the article and its supplementary materials.
Supplementary material
Supplemental data for this article can be accessed online at https://doi.org/10.1080/10962247.2022.2126558
Additional information
Funding
Notes on contributors
Xue Zhao
Xue Zhao graduated from Chongqing University in 2017 and received doctor’s degree of Environmental Sciences and Engineering, then worked in Postdoctoral Workstation of CPI Yuanda Environmental Protection engineering Co., Ltd and School of environment, Tsinghua University, gained the postdoctoral certificate in 2020, and now is senior engineer for environmental engineering, work in Sichuan Academy of Eco-Environmental Sciences, and focus on the fields of waste management and utilization, emerging pollutants investigation and control etc.
Yi Yong
Yi Yong is the chief of the department of waste treatment technology, Sichuan Academy of Eco-Environmental Sciences, have been worked in Environment protection for more than 30 years.
Cheng-Song Du
Cheng-Song Du is senior engineer and work in Chengdu Academy of Urban Environmental Management Science.
Wei-Guang Guo
Wei-Guang Guo graduated from Peking University in and received master degree of Environmental Science, now is senior engineer and work in Sichuan Academy of Eco-Environmental Sciences.
Da-Peng Luo
Da-Peng Luo is engineer and work in Sichuan Academy of Eco-Environmental Sciences.
References
- Adil, B., S. J. Rowland, and R. C. Thompson. 2012. Competitive sorption of persistent organic pollutants onto microplastics in the marine environment. Mar. Pollut. Bull. 64 (12):2782–89. doi:10.1016/j.marpolbul.2012.09.010.
- Azanu, D., C. Mortey, G. Darko, J. Juhl Weisser, B. Styrishave, and R. Clement Abaidoo. 2016. Uptake of antibiotics from irrigation water by plants. Chemosphere 157 (August):107–14. doi:10.1016/j.chemosphere.2016.05.035.
- Biamis, C., K. O’ Driscoll, and G. Hardiman. 2021. Microplastic toxicity: A review of the role of marine sentinel species in assessing the environmental and public health impacts. Case Stud. Chem. Environ. Eng. 3 (June):100073. doi:10.1016/j.cscee.2020.100073.
- Borrelle, S. B., J. Ringma, K. L. Lavender Law, C. C. Monnahan, L. Lebreton, A. McGivern, E. Murphy, J. Jambeck, G. H. Leonard, M. A. Hilleary. 2020. Predicted growth in plastic waste exceeds efforts to mitigate plastic pollution. Science. 369(6510):1515–18. doi:10.1126/science.aba3656.
- Buendia, E., K. Tanabe, A. Kranjc, M. Fukuda, J. Baasansuren, S. Ngarize, A. Osako, Y. Pyrozhenko, P. Shermanau, and S. Federici. 2019. 2019 refinement to the 2006 IPCC guidelines for national greenhouse gas inventories. Switzerland: IPCC.
- Caiyun, M., L. Yuangui, X. Lin, L. Jiyu, and S. Huawei. 2019. Prediction of construction waste production in Fujian Province based on grey prediction model. J. Harbin Uni. Commerce (Nat. Sci. Ed). 35 (5):545–50. doi:10.19492/j.cnki.1672-0946.2019.05.008.
- Chen, X., N. Kroell, J. Wickel, and A. Feil. 2021. Determining the composition of post-consumer flexible multilayer plastic packaging with near-infrared spectroscopy. Waste Manage. 123 (March):33–41. doi:10.1016/j.wasman.2021.01.015.
- Cheung, P. K., L. Fok, P. Lam Hung, and L. T. O. Cheung. 2018. Spatio-Temporal comparison of neustonic microplastic density in Hong Kong waters under the influence of the Pearl River estuary. Sci. Total Environ. 628–629 (July):731–39. doi:10.1016/j.scitotenv.2018.01.338.
- Cimpan, C., A. Maul, M. Jansen, T. Pretz, and H. Wenzel. 2015. Central sorting and recovery of MSW recyclable materials: A review of technological state-of-the-art, cases, practice and implications for materials recycling. J. Environ. Manage. 156 (June):181–99. doi:10.1016/j.jenvman.2015.03.025.
- Dietrich, B. 2021. Simple methods for identification of plastics. 5th ed. Munich, France: Hanser Verlag.
- Hong, L., X. Pei, W. Xi, and Z. Chunfei. 2017. Analysis on key properties of municipal solid waste and predication of quantity in Chengdu. Dongfang Electr. Rev. 31 (3):12–5+31. doi:10.13661/j.cnki.issn1001-9006.2017.03.003.
- Huayu, S., W. Zhaoxia, G. Chengyao, Q. Juan, Y. Fubin, and X. Wei. 2008. Determining the number of BP neural network hidden layer units. J. Tianjin Uni. Technol. 5:13–15.
- IPCC. 2006. 2006 IPCC guidelines for national greenhouse gas inventories, prepared by the national greenhouse gas inventories programme. Japan: IGES.
- Jiang, Y. 2021. Recent progress and research trends in microplastic pollution and the potential health risks. Bull. Environ. Contam. Toxicol. 107 (4):575–76. doi:10.1007/s00128-021-03367-5.
- Jiang, X., X. Wen, and W. Luo. 2020. Prediction of Beijing’s urban plastic waste generation based on multiple models and analysis of impact factors upon the generation. 40 (9):3435–44. doi:10.13671/j.hjkxxb.2020.0130.
- Kaza, S., L. C. Yao, P. Bhada-Tata, and F. Van Woerden. 2018. What a waste 2.0: A global snapshot of solid waste management to 2050. Washington, DC: World Bank. doi:10.1596/978-1-4648-1329-0.
- Khan, D., A. Kumar, and S. R. Samadder. 2016. Impact of socioeconomic status on municipal solid waste generation rate. Waste Manage. 49 (March):15–25. doi:10.1016/j.wasman.2016.01.019.
- Kumar, A., S. R. Samadder, N. Kumar, and C. Singh. 2018. Estimation of the generation rate of different types of plastic wastes and possible revenue recovery from informal recycling. Waste Manage. 79 (September):781–90. doi:10.1016/j.wasman.2018.08.045.
- Liao, C., and K. Kannan. 2014. A survey of bisphenol a and other bisphenol analogues in foodstuffs from nine cities in China. Food Addit. Contam. 31 (2):319–29. doi:10.1080/19440049.2013.868611.
- Liu, Z., W. Liu, T. R. Walker, M. Adams, and J. Zhao. 2021. How does the global plastic waste trade contribute to environmental benefits: Implication for reductions of greenhouse gas emissions? J. Environ. Manage. 287 (June):112283. doi:10.1016/j.jenvman.2021.112283.
- Liu, J., Y. Yang, L. An, Q. Liu, and J. Ding. 2021. The value of China’s legislation on plastic pollution prevention in 2020. Bull. Environ. Contam. Toxicol. (September). doi:10.1007/s00128-021-03366-6.
- Lu, H., and S. Roman. 2019. Sorting out aproblem: A co-production approach to household waste management in Shanghai, China. Waste Manage. 95 (July):271–77. doi:10.1016/j.wasman.2019.06.020.
- Meituan. 2021. Report on the development of China’s food delivery industry in 2019 and the first half of 2020.
- Mengxun, C., and W. Yongqi. 2019. Prediction and analysis of waste production in Shenzhen city based on BP neural network. Reg. Governance. 29:73–75.
- Mi, X.C., K.P. Ma, Y.B. Zou, and $author.xingMing_EN, $author.xingMing_EN, and Laboratory of Quantitative Vegetation Ecology, Institute of Botany, Chinese Academy of Sciences.2005. Artificial neural network and its application in agricultural and ecological research. Chin. J. Plant Ecol. 29 (5):863–70. doi:10.17521/cjpe.2005.0114.
- Ministry of Housing and Urban Development, P.R. China. 2021. China urban construction statistical yearbook. Beijing: China Statistics Press.
- Ministry of Housing and Urban Development, P.R.China. 2009. MSW sampling and physical analysis methods. Beijing: China Standard Quality Inspection Press.
- Muralisrinivasan, and S. Natamai. 2019. Plastic waste management. Wiley.
- OECD. 2022. Global plastics outlook: Economic drivers, environmental impacts and policy options. OECD. doi:10.1787/de747aef-en.
- Park, Y. K., W. Kim, and J. Young Min. 2013. Release of harmful air pollutants from open burning of domestic municipal solid wastes in a metropolitan area of Korea. Aerosol Air Qual. Res. 1365–72. doi:10.4209/aaqr.2012.10.0272.
- Rumelhart, D. E., G. E. Hinton, and R. J. Williams. 1986. Learning representations by back-propagating errors. Nature 323 (6088):533–36. doi:10.1038/323533a0.
- Sarker, A., D. Mohammad Deepo, R. Nandi, J. Rana, S. Islam, S. Rahman, M. Nabil Hossain, M. S. Islam, A. Baroi, and J.-E. Kim. 2020. A review of microplastics pollution in the soil and terrestrial ecosystems: A global and Bangladesh perspective. Sci. Total Environ. 733 (September):139296. doi:10.1016/j.scitotenv.2020.139296.
- Song, S., M. Song, L. Zeng, T. Wang, R. Liu, T. Ruan, and G. Jiang. 2014. Occurrence and profiles of bisphenol analogues in municipal sewage sludge in China. Environ. Pollut. 186 (March):14–19. doi:10.1016/j.envpol.2013.11.023.
- State Administration of Quality Supervision, Inspection and Quarantine, P.R.C, and P.R.C Standardization Administration. 2008. Signs ofplastic Products. GB/T 16288-2008. Beijing: Quality inspection of China press.
- Statistical Bureau of Sichuan, and NBS Survey Office of Sichuan. 2021. Statistical yearbook of Sichuan Province. Chengdu: China Statistics Press. http://tjj.sc.gov.cn/scstjj/c105855/nj.shtml.
- Sun, Y., S. Liu, P. Wang, X. Jian, X. Liao, and W.-Q. Chen. 2022. China’s roadmap to plastic waste management and associated economic costs. J. Environ. Manage. 309 (May):114686. doi:10.1016/j.jenvman.2022.114686.
- Weiguang, G., Y. Yi, W. Yi, H. Jiang, and Z. Lingling. 2020. Prediction of municipal solid waste production in Chengdu and policy suggestions. Energy Environ. Prot. 34 (6):100–04.
- Wen, Z. 2014. Prediction of municipal solid waste based on neural network model. J. Southwest Nor. Univ. (Nat. Sci. Ed.) 39 (8):51–56. doi:10.13718/j.cnki.xsxb.2014.08.012.
- Wenlong, C., and D. Zhenwu. 2020. Analysis of influencing factors and scale prediction of garbage production in Shanghai – based on grey system theory. Renewable Resour. Circ. Econ. 13 (5):13–19.
- Wu, D., Q. Li, X. Shang, Y. Liang, X. Ding, H. Sun, S. Li, S. Wang, Y. Chen, and J. Chen. 2021. Commodity plastic burning as a source of inhaled toxic aerosols. J. Hazard. Mater. 416 (August):125820. doi:10.1016/j.jhazmat.2021.125820.
- Xia, B., Q. Sui, Y. Du, L. Wang, J. Jing, L. Zhu, X. Zhao, X. Sun, A. M. Booth, B. Chen. 2022. Secondary PVC microplastics are more toxic than primary PVC microplastics to oryzias melastigma embryos. J. Hazard. Mater. 424(February):127421. doi:10.1016/j.jhazmat.2021.127421.
- Xu, S.-Y., H. Zhang, H. Pin-Jing, and L. Shao. 2011. Leaching behaviour of bisphenol a from municipal solid waste under landfill environment. Environ. Technol. 32 (11):1269–77. doi:10.1080/09593330.2010.535175.
- Yaoguo, D., L. Sifeng, and W. Zhengxin. 2009. Research on grey prediction and decision Model. Science Press.
- Yin, K., Y. Wang, H. Zhao, D. Wang, M. Guo, M. Mu, Y. Liu, X. Nie, B. Li, J. Li. 2021. A comparative review of microplastics and nanoplastics: Toxicity hazards on digestive, reproductive and nervous system. Sci. Total Environ. 774(June):145758. doi:10.1016/j.scitotenv.2021.145758.
- Zong, X., J. Zhang, J. Zhu, L. Zhang, L. Jiang, Y. Yin, and H. Guo. 2021. Effects of polystyrene microplastic on uptake and toxicity of copper and cadmium in hydroponic wheat seedlings (Triticum Aestivum L.). Ecotoxicol. Environ. Saf. 217 (July):112217. doi:10.1016/j.ecoenv.2021.112217.