
 ?Mathematical formulae have been encoded as MathML and are displayed in this HTML version using MathJax in order to improve their display. Uncheck the box to turn MathJax off. This feature requires Javascript. Click on a formula to zoom.
ABSTRACT
Odor is usually a complex mixture of various compounds. In many countries, odor complaints have been addressed using the air dilution olfactory method (ADOM) to reduce their malodor complaint. In this study, continuous monitoring of ammonia, hydrogen sulfide, and total volatile organic compounds (TVOC) using sensors was conducted in facilities for municipal and livestock wastewater treatment (LWT), and for food waste composting (FWC). Odor intensity was modeled by multivariate linear regression using sensor monitoring data with air dilution measured by the ADOM. In testing the performance of sensors in the lab, all three sensors showed acceptable values for linearity, accuracy, repeatability, lowest detection limit, and response time, so the sensors were acceptable for application in the field. In on-site real-time monitoring, the three sensors functioned well in the three environmental facilities during the testing period. Average ammonia and hydrogen sulfide concentrations were high in the LWT facility, while TVOC showed the highest concentration in the FWC facility. A longer sampling time is necessary for ammonia monitoring. Odor intensity from individual sensor data correlated well to complex odor measured by the ADOM. Finally, we suggest a protocol for field application of sensor monitoring and odor data reproduction.
Implications: We suggest a protocol for the field application of sensor monitoring and odor data estimation in this study. This study can be useful to a policy maker and field operator to reduce odor emission through the determination of a more effective treatment technology and removal pathway for individual odorants.
Introduction
The importance of air quality monitoring has increased to meet demands for mitigation and management of air pollution as awareness of the need for environmental protection has grown. Many methods have been widely applied to measure pollution levels of air pollutants in various fields. However, current air quality monitoring systems are limited in application mainly because of costs (Penza and EuNetAir Consortium Citation2014; Szulczyński and Gebicki Citation2017). Cost-effective monitoring using sensors is one alternative that can be applied in real-time for small grids (Rock, Barsan, and Weimar Citation2008; Stetter et al. Citation2008; Gebicki Citation2016). Wide application of sensor monitoring in this manner is the expected trend of the “fourth” industrial revolution.
Odorants consist not only of human sense (olfaction) constituents of smell but also chemical air pollutants (Peng et al. Citation2009; Gebicki Citation2016). Besides being a nuisance, odorants may cause symptoms of illness (Van, Citation2001; Peng et al. Citation2009; Nicell Citation2009; Belgiorno et al. Citation2012; Lee et al. Citation2013; Kang et al. Citation2020). Odor is a social issue that is recognized as a major cause of civil complaints in Korea (Lee et al. Citation2013; Park Citation2020). Environmental treatment facilities such as municipal wastewater treatment, livestock manure treatment, food waste treatment, and others, are particularly an issue because they are often located adjacent to residential areas.
Major odorants produced from these facilities are ammonia, hydrogen sulfide, and volatile organic compounds (VOCs). Ammonia (NH3) is a typical odorous compound produced from the decomposition of organic nitrogen; ammonia is also a precursor of secondary inorganic aerosols (Walker et al. Citation2003; Peng et al. Citation2009; Joo et al. Citation2015a). Hydrogen sulfide (H2S), a strong odorous and toxic compound that affects animal and human health, is mainly produced from anaerobic digestion of organic sulfur (Ni and Heber Citation2009; Peng et al. Citation2009). Concentrations greater than 100 ppm of H2S are dangerous to life and health (OSHA Citation2005) low concentrations, less than 300 ppb, are responsible for the foul odor of rotten eggs (Pandey et al. Citation2012; Joo et al. Citation2015b). Volatile organic compounds (VOCs) contribute to particulate air pollution, health problems and many have a malodorous character. Hydrocarbons such as benzene, toluene, ethylbenzene, and xylene, and esters, organic acids, aldehydes, and phenols in VOCs are significant concerns in many industries (Szulczyński and Gebicki Citation2017; Wang et al. Citation2017).
Various types of sensors such as electrochemical (EC), metal oxide semiconductor (MOS), photo ionization detector (PID), ultraviolet spectrometers, portable gas chromatographic system, non-dispersive infra-red, and electronic noses can be used for monitoring various odorants and air pollutants (Yuwono and Lammers Citation2004; Penza and EuNetAir Consortium Citation2014). Gas sensors to measure individual odorous compounds and complex odor mixtures have been developed and tested in various fields (Fusaya et al. Citation1999; Hudon et al. Citation2000; Kampa and Castanas, Citation2008; Hossein Babaei and Amini, Citation2014; Wang et al. Citation2017). Researchers have sought to improve sensitivity, selectivity and response velocity. Nowadays, many sensors are highly sensitive and selective and are capable of measuring even to the ppb level of target compounds (Pandey et al. Citation2012; Spinelle et al. Citation2015; Brown, Hall, and Schoenfisch Citation2019). Nevertheless, field application of sensor monitoring is still limited because of some uncertainties, such as their stability against changes in humidity and temperature, especially for long-term operation, the lack of maintenance technology and other reasons (Romain et al. Citation2005; Capelli et al. Citation2012; Zeng et al. Citation2016).
Frequent or real-time monitoring of odor intensity is important in resolving complaints. Characterization of the spatiotemporal pattern of odor emission and dominant odorous species must be clarified prior to control and regulation. Air dynamic olfactory methods (ADOM) have been recognized as a standard to assess odor intensity of complex odors in most counties (Ishikawa & Nishida Citation2000; Nagata and Takeuchi Citation2003; National Institute of Environmental Research (NIER), Citation2005; Jiang et al. Citation2006; National Institute of Environmental Research (NIER), Citation2006; Jacobson et al. Citation2008; Sun et al. Citation2008; Kim and Jeong Citation2009; Guillot et al. Citation2012). The Korean government allows only ADOM (fold unit), in which five panels (odor inspection specialist) manually measure air dilution factors in the laboratory within 45 hours from the field sampling (NIER Citation2005). However, ADOM has to be updated; several issues, such as the representative sampling for sampling location and time, minimizing the artifact of each panel characteristics, etc. (Sorokowska et al. Citation2015; Kim et al. Citation2019). Concentration data for individual odorous compounds such as ammonia, hydrogen sulfide, and VOCs from odor emissions play important roles in improving treatment efficiency and designing odor treatment methods (Ko et al. Citation2013; Jo et al. Citation2015). Therefore, real-time monitoring to measure individual odorants and complex odors using sensors can be a useful alternative solution in odor treatment and malodor complaints.
Up to now, studies of sensor monitoring in real-time in various environmental management plants such as piggery effluent ponds, composting facilities, anaerobic digesters, and biofilters, have demonstrated the possibility of sensor application in those fields (Vandecruys et al. Citation1998; Romain et al. Citation2005; Sohn et al. Citation2006; Capelli et al. Citation2012; Adam et al. Citation2013; Di et al. Citation2013). However, the application of sensor monitoring in actual fields still has some limitations owing to large gap from laboratory tests and sensor performances such as linearity, precision, reproducibility, lower detection limit (LDL), and so on in various environmental conditions (EPA Citation2014; Rai et al., Citation2017). Previous studies demonstrated that most of tested MOS and EC sensors showed significantly high coefficient of determination (R2) in laboratory studies with their reference measurements, while only a few of them showed significant values of R2 in the field studies (Rai et al., Citation2017). It means that laboratory sensor performance tests should be carried out under various levels of environmental conditions such as concentration, temperature and humidity, in addition sensor monitoring data collected from fields must be scientifically verified by reference methods or their equivalent methods or. One of the scientific approach to verify field monitoring data, a few studies using correlation analysis between complex odor or odor intensity and individual odorants have been tried (Fusaya et al. Citation1999; Lee et al. Citation2013; Park Citation2020). However, more practical studies of sensor monitoring for both individual odorant and odor intensity in actual fields should be conducted. Environmental treatment facilities such as wastewater, livestock manure and food waste treatment facilities can be an optimum test-bed to verify the feasibility of sensor monitoring, because those facilities are operated by public agencies.
In this study, we applied an environmental monitoring system equipped with ammonia, hydrogen sulfide, and total VOCs (TVOC) sensors in facilities for treatment of municipal wastewater, livestock manure and food waste composting. Prior to field application, fundamental performance of those sensors was tested under laboratory conditions. Concentrations of ammonia, hydrogen sulfide, and total volatile organic compounds (TVOC) were continuously monitored in real-time and the feasibility of the monitoring system using sensors for long-term periods was evaluated. In addition, odor intensity was produced using individual sensor monitoring data and then compared to complex odor (by dilution factors, fold) measured by ADOM. Finally, we suggest a protocol to apply sensor monitoring in environmental monitoring fields.
Materials and methods
Sensors used in this study
shows the specifications of three gas sensors, which are electrochemical sensors for monitoring ammonia and hydrogen sulfide, and photoionization detection sensors for monitoring TVOC.
Table 1. Specification of odor sensors used in this study.
Monitoring sites
The three monitoring sites were as follows; i) a municipal wastewater treatment facility (O-MWT) located in Gyeonggi-do, Korea, ii) a livestock manure treatment facility (Y-LWT) located in Chungcheong-do, Korea, and iii) a food waste composting facility (S-FWC) located in Gyeonggi-do, Korea. These three facilities are entirely closed systems with an odor treatment plant (OTP) at the outlet of the system. shows the treatment status of those facilities and odor treatment plants.
Table 2. Information on three environmental treatment facilities and their odor treatment plants.
Field monitoring system and maintenance
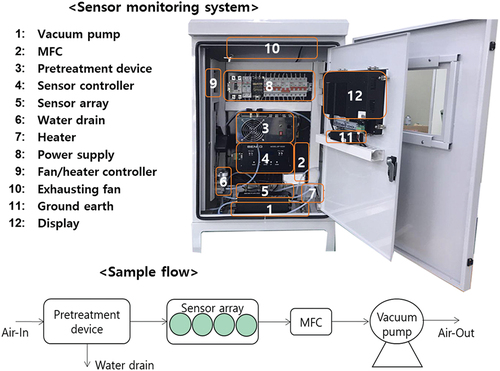
The environmental monitoring system used in the three monitoring sites was composed of four main parts as shown in : first) sensor part which contained the sensor, filter, flow controller, and suction tube, second) display part which contained a minimal computer, communication modem, and touch screen, third) electric part which contained an electricity controller, a circuit breaker, noise filter, fan/temperature controller, heater, and ground circuit, fourth) optional part which might contain an airflow meter, and relative humidity/temperature sensors. Two sets of the monitoring system were placed between the In-OTP and Out-OTP at the MWT and LWT facilities while one monitoring system was placed to measure both the In-OTP and the Out-OTP at the FWC facility with a rotation time of 15 minutes. A pretreatment device (desolvator-1800, Nara control, Korea) was additionally installed at the FWC facility to minimize any adverse effects of humidity.
Figure 1. Customized environmental monitoring system including odor sensors to measure ammonia, hydrogen sulfide and TVOC.
Performance tests of odor sensors
Fundamental performance tests for ammonia, hydrogen sulfide and TVOC sensors were carried out using a lab-scale test chamber. The lab-scale test chamber was composed of three main parts: a gas dilution system, a control system for humidity and temperature, and a measurement system. The lower detection limit, reproducibility and precision, linearity, and response time were tested. Ten second average values for analog-to-digital conversion were used in the data analysis. More details of experimental methods for sensor performance tests were described in our previous report (Han et al. Citation2019).
Data acquisition and processing
Measured data from a field monitoring system were automatically collected and transferred to the data acquisition system by the Wi-Fi and LTE network. Hourly average data converted from raw data (10 s data) were used in this paper. Unusual data such as mechanical-electrical spikes or data that was unresponsive for a long time were eliminated in the data processing step. As shown in , data periods were October 18 to December 12, 2019 (56 days), October 23 to December 25, 2019 (64 days) and November 22 to December 26, 2019 (35 days) for the MWT, LWT and FWC facilities, respectively.
Results and discussion
Performance tests of odor sensors using a laboratory testing chamber
shows the results of the fundamental performance tests using a chamber. The linearity of the three sensors was considerably high, ranging from 0.985 to 0.999; the hydrogen sulfide sensor showed the highest linearity. Lower detection limits were observed at 22.3 ppb for hydrogen sulfide, 18.6 ppb for ammonia and 26.7 ppb for the TVOC sensor. The lower detection limit for ammonia was better than that in previous reports (Han et al. Citation2012), while the lower detection limit of the TVOC sensor was slightly worse than that in the report by Choi (Choi et al. Citation2014). All three sensors showed high values for accuracy and repeatability. The hydrogen sulfide sensor showed the highest accuracy and the TVOC sensor showed the highest repeatability. The response time for the ammonia sensor was 9 to 12 minutes according to concentration levels; the hydrogen sulfide and TVOC sensors showed less than 2 minutes. Gong et al. reported that tested odor sensors showed good linearity with >0.97 of R2 in the conditions less than 500 ppb (H2S, NH3 and VOC) and they suggested standard performance criteria, i.e., less than 5% of repeatability, 20% of linearity and 10% of accuracy, respectively (Gong et al., Citation2015). Another previous study presented that the H2S sensor showed less than 1.7% of repeatability, 2.7% of accuracy and 400 seconds of response time, respectively (Zeng et al., Citation2016). Eventually, we decided that all three sensors were suitable for field application.
Table 3. Summary of performance tests for the three sensors used in this study (Han et al. Citation2019).
Field monitoring data from environmental treatment facilities
Municipal wastewater treatment facility
and show sensor monitoring results at the MWT facility. The data expression ratios of ammonia against the total number of data were 91% at the In-OTP and 82% at the Out-OTP. The data expression ratios for hydrogen sulfide were 91% at the In-OTP, 83% at the Out-OTP, and the ratios for TVOC were 91% at the In-OTP and 70% at the Out-OTP. The data expression ratio for TVOC at the Out-OTP was worse than for ammonia and hydrogen sulfide. The hourly average for ammonia showed 200–600 ppb (average 383 ppb) at the In-OTP and 0–150 ppb (average 24 ppb) at the Out-OTP. Concentrations of hydrogen sulfide showed 300–2,000 ppb (average 828 ppb) at the In-OTP and 0–200 ppb (average 35 ppb) at the Out-OTP. The TVOC pattern at the In-OTP was unreasonable, and the TVOC concentration showed 100–400 ppb (average 210 ppb) at the Out-OTP. Temperature and relative humidity at the Out-OTP fluctuated widely because the monitoring system was located outside of the building. The temperature ranged from 10°C to 33°C, and the relative humidity ranged from 20% to 70%. In the previous report by Jun et al., ammonia concentrations from MWT facilities were distributed from 110 ppb to 420 ppb, the hydrogen sulfide concentration varied from 200 ppb to 5,000 ppb depending on treatment processes, and the toluene concentrations were 100 ppb to 700 ppb (Jeon et al. Citation2010). When those data were compared with sensor monitoring data in this study, the sensor monitoring data from the O-MWT facility appears to be at a reasonable concentration.
Figure 2. Sensor measurement data at a municipal wastewater treatment facility (black solid line: In-OTP, and brown dotted line: Out-OTP).
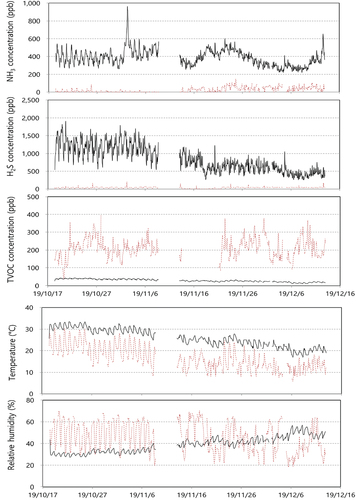
Table 4. Sensor monitoring data from a municipal wastewater treatment facility.
Livestock manure treatment facility
and show sensor monitoring data at the LWT facility. Data expression ratios of ammonia against the total data were 62% at the In-OTP and 97% at the Out-OTP. The ratios for hydrogen sulfide were 64% at the In-OTP, 97% at the Out-OTP, and the ratios for TVOC were 29% at the In-OTP and 97% at the Out-OTP. The data expression ratio for TVOC at the In-OTP was lower than for ammonia and hydrogen sulfide. The hourly concentration average for ammonia showed 400–25,000 ppb (average 10,059 ppb) at the In-OTP and 0–2,000 ppb (average 314 ppb) at the Out-OTP. Concentrations of hydrogen sulfide showed 300–25,000 ppb (average 2,258 ppb) at the In-OTP and 0–5,000 ppb (average 484 ppb) at the Out-OTP. Ammonia and hydrogen sulfide concentrations from the LWT facility were significantly higher than those at the MWT facility. The TVOC concentration at the In-OTP was only successfully monitored from Nov. 19 to Dec. 10 (about 20 days), and the TVOC concentration showed 0–15,000 ppb (average 1,889 ppb) at the In-OTP and 0–5,000 ppb (average 823 ppb) at the Out-OTP. Hydrogen sulfide and TVOC concentrations frequently peaked during the dumping time for livestock manure transported from the manure collection in individual livestock farms, and hydrogen sulfide and TVOC concentrations were highly correlated with each other (R = 0.82, data not shown). The temperature ranged from 0°C to 30°C, and relative humidity ranged from 20% to 90%. In the previous report, ammonia concentration from LMT facilities were distributed from 6,800 ppb to 7,500 ppb, hydrogen sulfide concentration showed 2,200 ppb to 4,400 ppb, and toluene concentration were 0.5 ppb to 6.7 ppb at the inlet hopper and liquid tank, respectively (Jeon et al. Citation2010). In the study presented by Choi and Lee, ammonia, hydrogen sulfide and toluene concentrations were 8,900 to 15,900 ppb, 81000 to 114,000 ppb, 20 to 240 ppb, respectively (Choi and Lee Citation2011). Sensor monitoring data for ammonia and hydrogen sulfide were reasonable, while TVOC concentrations were high because other VOC groups (acetic acid, propionic acid, acetaldehyde, cresol, phenol, ketones, for example), in LWT facilities might be emitted more than toluene and styrene (Choi and Lee Citation2011; Liu et al. Citation2011; Parker et al. Citation2012; Blazy et al. Citation2015).
Figure 3. Sensor measurement data at a livestock wastewater treatment facility (black solid line: In-OTP, and brown dotted line: Out-OTP).
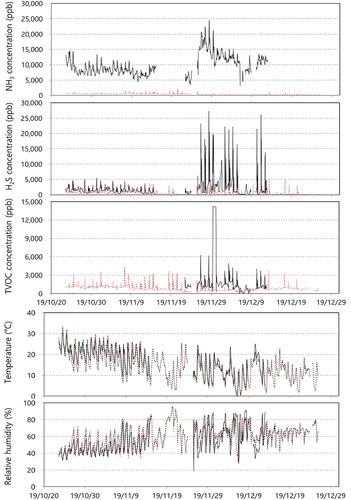
Table 5. Sensor monitoring data from a livestock wastewater treatment facility.
Food waste composting facility
and show sensor monitoring data at the FWC facility. Data expression ratios for ammonia, hydrogen sulfide and TVOC all showed 100% at both the In-OTP and the Out-OTP. Hourly average concentrations of ammonia were 200–4,000 ppb (average 930 ppb) at the In-OTP and 200–4,000 ppb (average 954 ppb) at the Out-OTP. The ammonia concentration pattern was nearly identical for the In-OTP and the Out-OTP owing to the time delay of ammonia with sequencing measurement times of 15 minutes. Many studies have demonstrated that more than 15 minutes of sampling time should be necessary to reach target concentrations of ammonia (Rom and Zhang Citation2010; Santos et al. Citation2017). This fact demonstrated that the rotation time of the sampling location should be longer than 15 minutes. In addition, the ammonia concentration was highly correlated with the temperature condition (R = 0.89) and ammonia emission was influenced by oxidation activity in the biological composting process. Concentrations of hydrogen sulfide were 100–200 ppb (average 151 ppb) at the In-OTP and 80–150 ppb (average 119 ppb) at the Out-OTP. As in the LWT facility, ammonia concentrations were higher than hydrogen sulfide. Nitrogen removal technology should be important in livestock and food waste treatment facilities. TVOC was successfully monitored at both the In-OTP and the Out-OTP. TVOC concentrations showed 1,000–12,000 ppb (average 3,669 ppb) at the In-OTP and 500–2,000 ppb (average 1,004 ppb) at the Out-OTP. Humidity might strongly influence the TVOC sensor; reducing humidity with a desolvator was effective in the successful monitoring of the TVOC sensor. The TVOC concentration level at the FWC facility was highest among the three facilities. Temperature and relative humidity at both the In-OTP and the Out-OTP fluctuated widely and showed the same pattern because both monitoring systems were located outside of the building compared to those at the Out-OTP. Humidity at the Out-OTP was slightly lower than that at the In-OTP. In the previous report, ammonia concentrations from FWC facilities were distributed from 360 ppb to 1,190 ppb, hydrogen sulfide concentrations showed 5 ppb to 34 ppb, and acetaldehyde concentrations were 43 ppb to 550 ppb. The sensor monitoring data from the O-FWC facility showed higher concentration levels in the previous report (Bae et al. Citation2009; Yoo et al. Citation2012).
Figure 4. Sensor measurement data at a food waste composting facility (black solid line: In-OTP, and brown dotted line: Out-OTP).
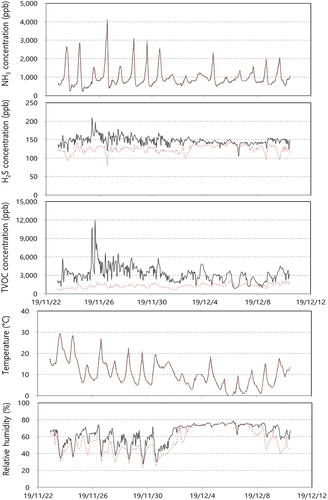
Table 6. Sensor monitoring data from a food waste composting facility.
Correlation analysis between individual sensor and complex odor data
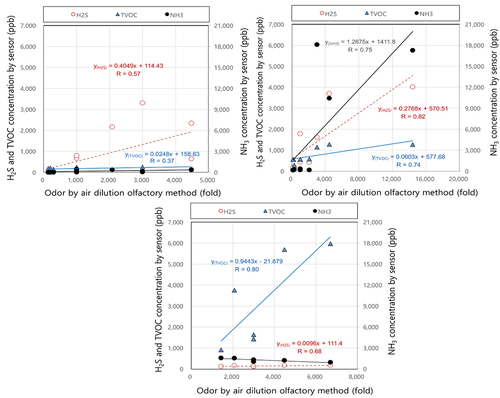
shows the results of the correlation analysis between complex odor (air dilution factor) measured by ADOM and each sensor measurement concentration for NH3, H2S, and TVOC in three environmental treatment facilities. Individual odorant measurement data from the LWT facility were highly correlated to air dilution factor (). Concentration data for hydrogen sulfide, ammonia and TVOC at the LWT facility showed high correlation coefficients of 0.82, 0.75 and 0.74 related to complex odor, respectively. While, only hydrogen sulfide at the MWT facility and TVOC at the FWC facility were correlated with complex odor correlation coefficients of 0.57 and 0.80, respectively. These results show that the correlation between ADOM and odor sensor monitoring can be significant at the conditions of high odor concentrations.
Figure 5. Correlation between odor by ADOM and each sensor measurement concentrations of NH3 (black), H2S (brown), TVOC (blue) in MWT (a), LWT (b), FWC (c), respectively.
To verify the relationship between complex odor and sensor data, a multivariate linear regression (EquationEquation (1)(1)
(1) ) between both measurement data presented in was performed with IBM SPSS Statistics 20 as shown in .
Table 7. Multivariate linear regression between complex odor (dependent variable) measured by ADOM and sensor measurement data.
As shown in EquationEquation (1)(1)
(1) , complex odor can be expressed as a function of ammonia, hydrogen sulfide and TVOC concentration measured by sensors. A, B and C are coefficients (beta values) for ammonia, hydrogen sulfide and TVOC, respectively (i.e., A = 0.153, B = 1.339, C = 0.789, and Intercept = 228.444). A multivariate linear regression was significant with a p value <0.001. Odor estimated by a multivariate linear regression was highly correlated with complex odor (R = 0.89) as shown in .
Figure 6. Correlation comparison between odor by odor estimated by sensor data (a) and ADOM and odor divided by the odor threshold values (b) and (black: MWT, brown: LWT, blue: FWC).
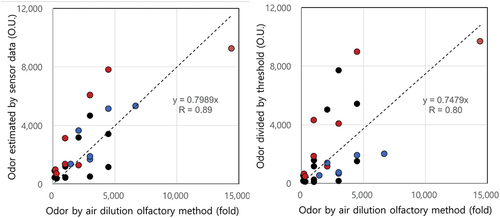
Odor intensity was regarded as the sum of individual values divided by a threshold for each individual odor compound (Bae et al. Citation2009; Han et al. Citation2012). Odor thresholds were applied as 2,930 ppb for ammonia, 0.43 ppb for hydrogen sulfide, and 3.756 ppb for TVOC. The average value of five representative VOC compounds (acetaldehyde, butyraldehyde, propionaldehyde, n-valeraldehyde, i-valeraldehyde) was used for the TVOC threshold (Han et al. Citation2012). Odor intensity divided by the odor threshold of individual odor compounds correlated with complex odor (R = 0.80) as shown in .
shows the relationship between odor intensity estimated by the regression using EquationEquation (1)(1)
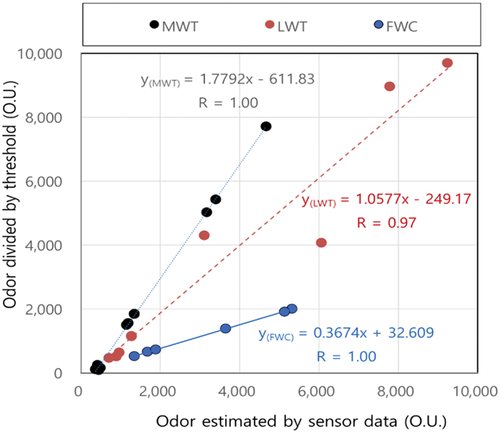
(1) with sensor measurement data and odor intensity divided by each odor threshold manually measured data at three treatment facilities. Both odor intensities in were highly correlated to each other (correlation coefficient more than 0.97). The slope for the LWT facility was 1.06, implying that both odor intensities were similar. On the other hand, slopes for the MWT and FWC facilities were considerably larger or smaller than 1, meaning that odor estimated by sensor data can be overestimated at the FWC facility and underestimated at the MWT facility.
Figure 7. Correlation between odor estimated by correlation equation (eq.1) and odor divided by threshold (black: MWT, brown: LWT, blue: FWC).
Estimation of odor intensity from individual sensor monitoring data
and show odor intensity estimated from sensor measurement data using a regression EquationEquation (1)(1)
(1) and removal efficiencies at the MWT, LWT and FWC facilities. Odor intensity in the MWT facility was 1,000 to 4,000 O.U. at the In-OTP (average 2,039) and 300 to 1,000 O.U. at the Out-OTP (average 419), with odor removal efficiencies ranging from 50 to 95% (average 78%). Odor intensity at the LWT facility was widely distributed from 2,000 to 40,000 O.U. at the In-OTP (average 5,557) and 1,000 to 10,000 O.U. at the Out-OTP (average 1,573), with odor removal efficiencies ranging from 10 to 95% (average 60%). Odor intensity at the FWC facility was 2,000 to 10,000 O.U. at the In-OTP (average 3,4688) and 1,000 to 3,000 O.U. at the Out-OTP (average 1,326), with odor removal efficiencies ranging from 10 to 80% (average 58%). The removal efficiencies at the LWT and FWC facilities were not high enough; odor treatment technologies such as microbial media or a scrubber will need to be developed or replaced. This estimated odor intensity can be useful to determine an odor mitigation strategy in odor emission industries. In previous reports, odor intensity from environmental treatment facilities were consistent with data from this study: distributed from 368 to 3,000-fold at MWT facilities, 2,080 to 30,000-fold at LWT facilities and 1,442 to 2,080-fold at FWC facilities (Jeon et al. Citation2010; Choi and Lee Citation2011; Yoo et al. Citation2012; Yi et al. Citation2020).
Figure 8. Estimated odor unit from sensor measurement data and removal efficiency at a MWT (a), LWT (b), FWC (c), respectively (black solid line: In-OTP, and brown dotted line: Out-OTP, blue solid line: removal efficiency).
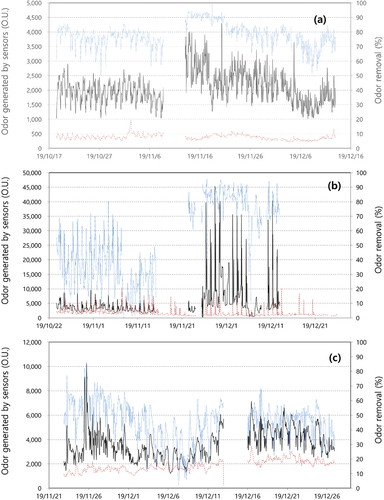
Table 8. Odor intensity generated by the linear regression using sensor measurement data.
A protocol to estimate odor intensity using individual sensor monitoring data
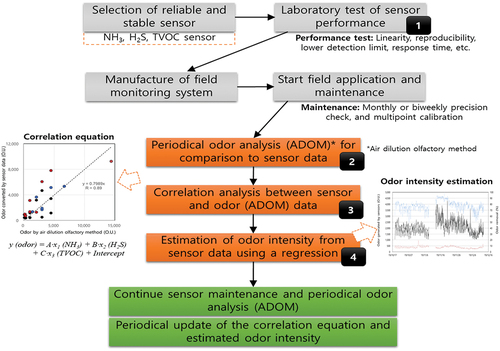
Finally, we suggest a protocol for the field application of sensor monitoring and odor data estimation as shown in . The first step is the selection of a reliable and stable sensor, comparative study of various information such as the original specification, a case study of application, applicable environmental conditions, and so on should be carried out in this step. The performance of the selected sensors must be tested precisely under controlled conditions in the laboratory. The monitoring system must also be composed of pre-tested sensors in the laboratory, because the actual performances in field tests are often different from the original specifications in terms of precision and reproducibility (EPA Citation2014; Rai et al., Citation2017). The next step is installation and operation of the monitoring system in the field. Once field monitoring is started, complex odors must be measured periodically and simultaneously by an ADOM to correlate sensor monitoring data (odors must be sampled from the same location and at the same time). Periodical maintenance such as biweekly or monthly zero and span check and multi-point calibration (if needed) is very important in the collection of reliable monitoring data. Correlation analysis between ADOM data and sensor monitoring data is conducted () and odor intensity (dependent variable) can be estimated from the correlation regression using sensor monitoring data as individual independent variables (). The estimated odor intensity can be useful to a policy maker and field operator to reduce odor emission through the determination of a more effective treatment technology and removal pathway for individual odorants. When sensors are applied in the fields, the highlighted steps 1, 2, 3, and 4 in have not been considered, because these steps are not mandatory up to now. However these scientific steps play an important role in the collection of reliable measurement data from a sensor monitoring method. The protocol suggested in this study can be expected to provide a useful guideline for the field application of environmental monitoring sensor.
Figure 9. Suggested protocol for field application of sensor monitoring and odor data estimation.
Highlights
Continuous monitoring of odorants using sensors was conducted in environmental treatment facilities.
Odor sensors for NH3, H2S and TVOC functioned well in the three environmental facilities.
Odor intensity was modeled by sensor monitoring data.
Modeled odor intensity correlated well to complex odor measured by the air dilution olfactory method.
This study suggests a protocol for field application of sensor monitoring and odor intensity reproduction.
Data availability statement
The data that support the findings of this study are available from the first author,[HSJ], corresponding author, [JSH], upon reasonable request.
Additional information
Funding
Notes on contributors
HungSoo Joo
HungSoo Joo is an assistant professor of Department of Environmental Engineering in Anayang University, Anyang-si, Gyeonggi-do, Korea.
Sang-Woo Han
Sang-Woo Han is a Ph.D. student of Department of Environmental Engineering in Anayang University, Anyang-si, Gyeonggi-do, Korea.
Chun-Sang Lee
Chun-Sang Lee is a Ph.D. student of Department of Environmental Engineering in Anayang University, Anyang-si, Gyeonggi-do, Korea.
Hyun-Seop Jang
Hyun-Seop Jang is a research professor and director of Zero Emission Center of Sungkyunkwan University, Suwan-si, Gyeonggi-do, Korea.
Sung-Tae Kim
Sung-Tae Kim is a leader of E2M3 Inc., Anyang-si, Gyeonggi-do, Korea.
Jin-Seok Han
Jin-Seok Han is an associate professor of Department of Environmental Engineering in, Anayang University, Anyang-si, Gyeonggi-do, Korea.
References
- Adam, G., S. Lemaigre, A. C. Romain, J. Nicolas, and P. Delfosse. 2013. Evaluation of an electronic nose for the early detection of organic overload of anaerobic digesters. Bioprocess Biosyst Eng 36 (1):23–33. doi:10.1007/s00449-012-0757-6.
- Bae, J. S., G. H. Park, G. Y. Oh, H. Y. Park, S. I. Yang, and Y. W. Lee. 2009. The Characteristics of odor (12 species) emitted from foodwaste treatment facility. J Odor Indoor Environ 8 (1):1–11.
- Belgiorno, V., V. Naddeo, and T. Zarra. 2012. Odour impact assessment handbook. Hoboken: John Wiley & Sons, Inc.
- Blazy, V., A. de Guardia, J. C. Benoist, M. Daumoin, F. Guiziou, M. Lemasle, D. Wolbert, and S. Barrington. 2015. Correlation of chemical composition and odor concentration for emissions from pig slaughterhouse sludge composting and storage. Chem Eng J 276:398–409. doi:10.1016/j.cej.2015.04.031.
- Brown, M., J. R. Hall, and M. H. Schoenfisch. 2019. A direct and selective electrochemical hydrogen sulfide sensor. Anal. Chim. Acta 1045:67–76. doi:10.1016/j.aca.2018.08.054.
- Capelli, L., S. Sironi, R. Del Rosso, G. Bianchi, and E. Davoli. 2012. Olfactory and toxic impact of industrial odour emissions. Water Sci Technol 66 (7):1399–406. doi:10.2166/wst.2012.352.
- Choi, J. S., J. S. Han, B. S. Gong, S. Y. Hong, S. T. Kim, and H. S. Kim. 2014. A study on the odor threshold values of the fatty acid and VOCs of specified offensive odor substances. J Odor Indoor Environ 13 (4):313–15.
- Choi, H. I., and J. K. Lee. 2011. Study on the Odor from Each Process of Livestock Waste Treatment Plants. Korean Journal of Odor Research and Engineering 10 (2):74–84.
- Di, Y., J. Liu, J. Liu, S. Liu, and L. Yan. 2013. Characteristic analysis for odor gas emitted from food waste anaerobic fermentation in the pretreatment workshop. J Air Waste Manag Assoc 63 (10):1173–81. doi:10.1080/10962247.2013.807318.
- EPA. 2014. Sensor Evaluation Report. EPA/600/R-14/143 (May 2014 www.epa.gov/ord)
- Fusaya, M., T. Amagai, H. Matsushita, and M. Soma. 1999. Study on evaluation methodology for complex odor using odor sensor (II) relationship between response values of odor sensor and odor index. JSAE 34 (1):17–24.
- Gebicki, J. 2016. Application of electrochemical sensors and sensor matrixes for measurement of odorous chemical compounds. Trends Anal Chem 77:1–13.
- Gong, B. J., J. S. Han, C. G. Bong, Y. D. Hong, and J. H. Hong. 2015. Reliability assessment of the odor sensor measuring instrument. J Odor Indoor Environ 14 (4):299–314. doi:10.15250/joie.2015.14.4.299.
- Guillot, J. M., I. Bilsen, M. Hangartner, W. J. Kost, W. Kunz, J. Nicolas, A. Oxbol, J. Secanella, H. Van Belois, T. Van Elst, et al. 2012. The future European standard to determine odour in ambient air by using field inspection. Water Sci Technol 66 (8):1691–98.
- Han, S. W., C. S. Lee, H. S. Joo, K. C. Kim, S. Y. Kim, H. J. Ryu, J. M. Lee, H. S. Kim, and J. S. Han. 2019. Performance assessment of H2S, NH3, and VOCs sensors for field application. J Odor Indoor Environ 18 (3):261–71.
- Han, J. S., Y. J. Lim, and S. J. Park. 2012. A study on the calculation methods of odor threshold values of the specified offensive odor substances. J Odor Indoor Environ 11 (1):24–33.
- Hossein Babaei, F., and A. Amini. 2014. Recognition of complex odors with a single generic tin oxide gas sensor. Sensors Actuators B 194:156–63.
- Hudon, G., C. Guy, and J. Hermia. 2000. Measurement of odor intensity by an electronic nose. J Air Waste Manag Assoc 50 (10):1750–58. doi:10.1080/10473289.2000.10464202.
- Ishikawa, Y., and K. Nishida. 2000. A Review of 20 years of standardization of odor concentration measurement by dynamic olfactometry in europe. J Odor Res Eng 31 (3):6–13.
- Jacobson, L. D., B. P. Hetchler, D. R. Schmidt, R. E. Nicolai, A. J. Heber, J. Q. Ni, S. J. Hoff, J. A. Koziel, Y. Zhang, D. B. Beasley, et al. 2008. Quality assured measurements of animal building emissions: Odor concentrations. J Air Waste Manag Assoc 58 (6):806–11. doi:10.3155/1047-3289.58.6.806.
- Jeon, J. M., Y. S. Seo, M. H. Jeong, H. S. Lee, M. D. Lee, J. S. Han, and B. W. Kang. 2010. Management plan and emission characteristics of odor compounds from environmental fundamental facilities – Case studies 5 facilities (sewage, wastewater, livestock, night-soil, and foodwaste) of treatment plants-. Korean Journal of Odor Research and Engineering 9 (2):79–88.
- Jiang, J., P. Coffey, and B. Toohey. 2006. Improvement of odor intensity measurement using dynamic olfactometry. J Air Waste Manag Assoc 56 (5):675–83. doi:10.1080/10473289.2006.10464474.
- Jo, S. H., K. H. Kim, B. H. Jeon, M. H. Lee, Y. H. Kim, B. W. Kim, S. B. Cho, O. H. Hwang, and S. S. Bhattacharya. 2015. Odor characterization from barns and slurry treatment facilities at a commercial swine facility in South Korea. Atmos. Environ. 119:339–47.
- Joo, H. S., P. M. Ndegwa, A. J. Heber, J. Q. Ni, B. W. Bogan, J. C. Ramirez Dorronsoro, and E. Cortus. 2015b. Greenhouse gas emissions from naturally ventilated freestall dairy barns. Atmos. Environ. 102:384–92.
- Joo, H. S., P. M. Ndegwa, A. J. Heber, J. Q. Ni, E. L. Cortus, J. C. Ramirez Dorronsoro, and B. W. Bogan. 2015a. Ammonia and hydrogen sulfide concentrations and emissions for naturally-ventilated freestall dairy barns. Trans ASABE 58 (5):1321–31.
- Kampa, M., and E. Castanas. 2008. Human health effects of air pollution. Environ. Pollut. 151 (2):362–67. doi:10.1016/j.envpol.2007.06.012.
- Kang, J. W., C. Young, H. Lee, K. D. Han, S. W. Kim, and K. H. Lee. 2020. Epidemiology of Anosmia in South Korea: A nationwide population-based study. Sci Rep 10 (1):3717. doi:10.1038/s41598-020-60678-z.
- Kim, J. B., and S. J. Jeong. 2009. The relationship between odor unit and odorous compounds in control areas using multiple regression analysis. J Environ Health Sci 2009 (35):191–200.
- Kim, S. T., S. J. Lee, and B. B. Yim. 2019. Analysis of the influence of panel characteristics on odor measurement based on the air dilution olfactory method in Korea. Environ Eng Res 24 (1):91–98. doi:10.4491/eer.2018.093.
- Ko, B. C., Y. H. Park, D. I. Kim, M. G. Lee, and S. K. Kam. 2013. Odor removal characteristics of biofilters in domestic sewage treatment facilities analyzing composite odor and odor quotient. J Environ Sci 22 (1):109–17.
- Lee, H. D., S. B. Jeon, W. J. Choi, S. S. Lee, M. H. Lee, and K. J. Oh. 2013. A novel assessment of odor sources using instrumental analysis combined with resident monitoring records for an industrial area in Korea. Atmos. Environ. 74:277–90.
- Liu, D., A. Feilberg, A. P. S. Adamsen, and K. E. N. Jonassen. 2011. The effect of slurry treatment including ozonation on odorant reduction measured by in-situ PTR-MS. Atmos. Environ. 45 (23):3786–93. doi:10.1016/j.atmosenv.2011.04.028.
- Nagata, Y., and N. Takeuchi. 2003. Measurement of odor threshold by triangle odor bag method. Odor Meas. Rev. 118:118–27.
- National Institute of Environmental Research (NIER), 2005. The first training course of odor measurement and analysis.
- National Institute of Environmental Research (NIER), 2006. A study and development of the standarpd methods for the specified offensive odor substances
- Nicell, J. A. 2009. Assessment and regulation of odour impacts. Atmos. Environ. 43 (1):196–206. doi:10.1016/j.atmosenv.2008.09.033.
- Ni, J. Q., and A. J. Heber. 2009. An on-site computer system for comprehensive agricultural air quality research. Comput. Electron. Agric. 71 (1):38–49.
- OSHA. 2005. OSHA fact sheet: Hydrogen sulfide (H2S). Washington, D.C: Occupational Safety and Health Administration. https://www.osha.gov/OshDoc/dataHurricaneFacts/hydrogensulfidefact.html.
- Pandey, S. K., K. H. Kim, and K. T. Tang. 2012. A review of sensor-based methods for monitoring hydrogen sulfide. Trends Anal Chem 32:87–992.
- Park, S. J. 2020. Odor characteristics and concentration of malodorous chemical compounds emitted from a combined sewer system in Korea. Atmosphere 11 (6):667. doi:10.3390/atmos11060667.
- Parker, D. B., J. A. Koziel, L. Cai, L. D. Jacobson, N. Akdeniz, S. D. Bereznicki, T. T. Lim, E. A. Caraway, S. Zhang, S. J. Hoff, et al. 2012. Odor and odorous chemical emissions from animal buildings: Part 6. Odor activity value. Trans ASABE 55 (6):2357–68. doi:10.13031/2013.42498.
- Peng, C. Y., C. H. Lan, and T. J. Wu. 2009. Investigation of indoor chemical pollutants and perceived odor in an area with complaints of unpleasant odors. Build. Environ. 44 (10):2106–13. doi:10.1016/j.buildenv.2009.03.001.
- Penza, M., and EuNetAir Consortium. 2014. New sensing technologies for environmental sustainability in smart cities: COST action TD1105, 2014 IEEE, 978-1-4799-0162-3/14
- Rai, A. C., P. Kumar, F. Pilla, A. N. Skouloudis, S. Di Sabatino, C. Ratti, A. Yasar, and D. Rickerby. 2017. End-user perspective of low-cost sensors for outdoor air pollution monitoring. Sci. Total Environ. 607–608 (2017):691–705.
- Röck, F., N. Barsan, and U. Weimar. 2008. Electronic nose: Current status and future trends. Chem. Rev. 108 (2):705–25.
- Romain, A. C., D. Godefroid, M. Kuske, and J. Nicolas. 2005. Monitoring the exhaust air of a compost pile as a process variable with an e-nose. Sens Actuators B Chem 106 (1):29–35. doi:10.1016/j.snb.2004.05.033.
- Rom, H. B., and G. Q. Zhang. 2010. Time delay for aerial ammonia concentration measurements in livestock buildings. Sensors 10 (5):4634–42. doi:10.3390/s100504634.
- Santos, M. C., A. G. C. Bianchi, D. M. Ushizima, F. J. Pavinatto, and R. F. Bianchi. 2017. Ammonia gas sensor based on the frequency-dependent impedance characteristics of ultrathin polyaniline films. Sens. Actuators A Phys. 253:156–64. doi:10.1016/j.sna.2016.08.005.
- Sohn, J. H., R. Smith, and E. Yoong. 2006. Process studies of odour emissions from effluent ponds using machine-based odour measurement. Atmos. Environ. 40 (7):1230–41. doi:10.1016/j.atmosenv.2005.10.035.
- Sorokowska, A., P. Sorokowski, and T. Frackowiak. 2015. Determinants of human olfactory performance: A cross-cultural study. Sci. Total Environ. 506-507:196–200. doi:10.1016/j.scitotenv.2014.11.027.
- Spinelle, L., M. Gerboles, G. Kok, and T. Sauerwald. 2015. Sensitivity of VOC sensors for air quality monitoring within the EURAMET key-VOC project. 10.5162/4EuNetAir2015/02.
- Stetter, R. F., N. Barsan, and U. Weimar. 2008. Electronic nose: Current status and future trends. Chem. Rev. 108 (2):705–25. doi:10.1021/cr068121q.
- Sun, G., H. Guo, J. Peterson, B. Predicala, and C. Laguë. 2008. Diurnal odor, ammonia, hydrogen sulfide, and carbon dioxide emission profiles of confined swine grower/finisher rooms. J Air Waste Manag Assoc 58 (11):1434–48. doi:10.3155/1047-3289.58.11.1434.
- Szulczyński, B., and J. Gębicki. 2017. Currently commercially available chemical sensors employed for detection of volatile organic compounds in outdoor and indoor air. Environments 4 (1):21. doi:10.3390/environments4010021.
- Van, A. P. H. 2001. From odorant formation to odour nuisance: New definitions for discussing a complex process. Water Sci Technol 44 (9):9–15. doi:10.2166/wst.2001.0498.
- Vandecruys, F., E. Brauns, W. Engelen, F. de Schutter, and J. Vangrunderbeek. 1998. A H2S-sensor for on-line measurements in a coal gasification system. Solid State Ion 112 (1–2):95–102. doi:10.1016/S0167-2738(98)00217-3.
- Walker, J. T., D. R. Whitall, W. Robarge, and H. W. Paerl. 2003. Ambient ammonia and ammonium aerosol across a region of variable ammonia emission density. Atmos. Environ. 38 (9):1235–46.
- Wang, L. Y., Z. X. Wang, Q. Xiang, Y. Chen, Z. M. Duan, and J. Q. Xu. 2017. High performance formaldehyde detection based on a novel copper (II) complex functionalized QCM gas sensor. Sensors Actuators B 248:820–28.
- Yi, K. H., J. B. Oh, and J. I. Dong. 2020. Characteristics of the concentration of complex odor substances according to the inlet air flow rate at the opening of malodor emission sources of public environment facilities. J Odor Indoor Environ 19 (3):329–38.
- Yoo, S. S., Y. D. Kim, J. Y. Lee, Y. S. Cha, E. S. Kim, J. S. Jeon, Y. S. Woo, S. W. Eom, and Y. Z. Chae. 2012. The characteristic and management of odor emitted from foodwaste treatment facility. J Environ Impact Assess 21 (3):353–65.
- Yuwono, A., and P. S. Lammers. 2004. Odor pollution in the environment and the detection instrumentation. Agricultural Engineering International: the CIGR Journal of Scientific Research and Development. Invited Overview Paper. 4.
- Zeng, L., M. He, H. Yu, and D. Li. 2016. An H2S Sensor based on electrochemistry for chicken coops. Sensors 16 (9):1398. doi:10.3390/s16091398.