
ABSTRACT
An unmanned aerial vehicle equipped with an isokinetic sampling device and a portable aerosol particle size spectrometer was used to detect atmospheric particles at different altitudes in the suburbs of Tianjin. In January 2017, four flight tests under different air conditions were conducted, and the Severe polluted and Excellent levels were classified according to the air quality index of the State-controlled site. Changes in mass concentration with altitude, and the vertical distribution of mass concentration and number concentration spectrum were analyzed. Results showed that under the Severe polluted condition, the concentration of particulate matter (PM) decreased significantly within 200 m, and became stable above 400 m. Two peaks at 260 m and 400 m were observed – they were attributed to local emissions and transportation of nearby areas. When the mass concentration significantly increased, the greatest contributor was particles with a size of 15–30 μm. As altitude increased, PM with the size of less than 1 μm accounted for the largest proportion. Regarding number concentration, the main particle size was less than 0.35 μm. Under the Excellent condition, particles less than 0.35 μm in size were the most important components in mass and number concentrations. Correlation analysis of meteorological factors and backward trajectory indicated that pollution was caused by particle concentration transport in several provinces and the particle accumulation due to temperature inversion.Implications: Study on the vertical structure of air pollutants was very important for understanding the occurrence and development of regional heavy pollution. Unmanned aerial vehicles (UAVs) was an efficient method for its easy operation, good stability, high flexibility and safety, and was introduced to observe the vertical distribution characteristics of particle concentration under different weather conditions. This study provided the number concentration spectra and the mass concentration spectra at different height, and would give some support for the precise control of air pollution.
Introduction
Regional airborne particulate matter (PM) pollution has aroused widespread concern from the public and the government, for it seriously endangers people’s life and health – especially the heart and respiratory system (Shi, Wang, and Guo Citation2019; Wei Citation2019; Yuan et al. Citation2019). There are many potential emission sources of PM in the atmosphere, including coal combustion and secondary sources, vehicle emission sources, industrial emission sources, dust sources, and biomass combustion sources (Zhang et al. Citation2022). However, due to the limitation of method or funding restrictions, most current measurements of particulate pollution have been mainly concentrated on the ground. The study on the vertical structure of particulate pollution is helpful in understanding the occurrence and development of regional heavy pollution and can provide information for predicting and preventing air pollution. Therefore, conducting vertical observations of particles is crucial to the policy decision for the precise control of air pollution and regional collaborative management. The observation method of vertical structure includes optical remote sensing methods such as ground-based/mobile lidar, and direct observation methods such as high tower observation, tethered balloons airship, and aircraft. Data obtained by direct observation methods can provide support for the retrieval of pollutants calibration by optical remote sensing technology. Frequent column measurements are significant for providing possible predictions. However, certain direct observation methods either have high experimental costs, or lack flexibility, and are, therefore, not applicable under many situations.
Unmanned aerial vehicles (UAVs) have many advantages, such as easy operation, high flexibility, and low cost (Hinas, Roberts, and Gonzalez Citation2017; Puijenbroek et al. Citation2017), and, consequently, they are gradually – or increasingly – being used for atmospheric environmental observation (Brady et al. Citation2016; Lambey and Prasad Citation2021). In the case of an abrupt environmental affair or pollution accident, UAVs can easily and rapidly reach the airspace or a dangerous area, which cannot be reached by the accident handling personnel as easily, and can quickly perform inspections to provide decision-making support for precise environmental management (Levin, Nahon, and Paranjape Citation2019). UAVs have been proven to be an effective method for the vertical monitoring of PM2.5 mass concentration, both near the ground and at high altitude (Guo, Yu, and Huang Citation2017; Li et al. Citation2018a; Niu and Wang Citation2014; Peng et al. Citation2015; Wang et al. Citation2019). Many studies have focused on the particle transport and pollution source analysis in the atmospheric environment using UAVs. Villa et al. (Citation2017) quantitatively evaluated the vertical distribution of particle number concentration (PNC) in open area near expressways using UAVs, and defined the influence range of traffic pollution. Hovorka et al. (Citation2016) measured the vertical distribution structure of ultrafine particles and coarse particles over the city of Ostrava in the Czech Republic, and concluded that high-altitude particles would be transported downwards through the vertical exchange of airflow, and the inversion layer would hinder the vertical exchange of atmosphere. Lu et al. (Citation2017) obtained the concentration data of fine particulate matter (PM2.5) in Lin’an City below 1 km in a heavy pollution event, and found that atmospheric turbulence had a significant impact on temporal and spatial changes of PM2.5 concentration. Weber et al. (Citation2017) designed an eight-rotor UAV to study the vertical and horizontal changes in air pollution flow caused by traffic on a bridge in Dusseldorf, Germany, and the results confirmed that air pollution plumes were induced by traffic originating from the bridge. As particle size can affect its physical and chemical properties and atmospheric chemical lifespan, the spectral distribution of different particle size was also investigated (Haas et al. Citation2014; Villa et al. Citation2019). The Beijing-Tianjin-Hebei (BTH) region is among the most severely polluted areas in the world, especially in winter (Jiang et al. Citation2017; Liu et al. Citation2018). However, more detailed information about the vertical distribution of particles under different air quality conditions over the BTH region was demanded.
In this study, the test area was selected from the suburbs of Tianjin. A UAV equipped with particle size spectrometer was used to study the vertical distribution of particle concentration with different particle size. Mass concentration and number concentration of atmospheric PM in the lowermost 1 km were detected. Vertical distribution under different air quality conditions (Severe polluted and Excellent) was compared. The influence of meteorological factors were also analyzed. Finally, by analyzing the particle size spectra at different altitudes, the main particle size ranges affecting mass concentration and quantity concentration under different air quality conditions were obtained. On the one hand, the feasibility of the device for vertical monitoring of atmospheric PM is verified. On the other hand, this study may increase the understanding of particle diffusion and transmission under different weather conditions and can provide support for more targeted atmospheric particle pollution control.
Materials and methods
Experimental equipment
The type of UAV used was Xiangyu I, which has a rear-push dual electric engine, with a load capacity of 5 kg, and a minimum radius of 300 m. The UAV uses the catapult take-off and parachute recovery method, and can adapt to various complex operating environments. The integrated airborne analysis instrument was installed on the UAV, including an isokinetic sampling head, a gas splitter, branch pipelines, a portable aerosol particle size spectrometer (Grimm 1.109, Germany), a signal transmitter, a ground signal receiving station, and a console. The flight speed was set at 22 m/s. An isokinetic sampling head was used to achieve better quality control. The inlet diameter of the isokinetic sampling head was selected according to the flight speed of the UAV, and the specific loading position was determined in the reference of the literature (Zhang et al. Citation2017). Considering the size of the UAV, the isokinetic sampling head was finally installed 60 cm from the nose, and 12 cm below the horizontal axis. A counterweight device was installed under the corresponding wing to ensure that the center of gravity and aerodynamic conditions of the UAV were the same.
Flight and detection arrangement
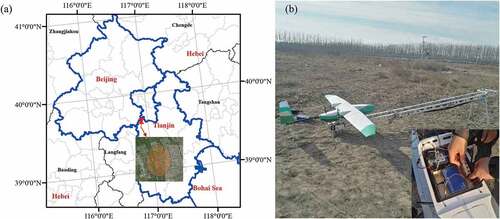
The test site was in Gaocun Town, Wuqing District, Tianjin City – at the junction of Beijing and Tianjin. The center point and flight range are shown in ; the flight radius was approximately 2 km. This area is surrounded by villages and farmland, and no obvious industrial emission sources and large buildings were observed. A national highway (G103) is approximately 4 km northeast of the observation point, and the Beijing-Tianjin Expressway is approximately 3 km to the southwest.
Figure 1. (a) the location of the test site is shown via the red pin (116.89°E, 39.64°N). The flight range in this study is shown in the inset, with a flight radius of 2 km; (b) the Xiangyu I UAV is equipped with a portable aerosol particle size spectrometer (GRIMM 1.109), and an isokinetic sampling device is designed based on the flight speed of the aircraft. It uses a catapult when taking off, and rolling/parachuting when landing.
Portable aerosol particle size spectrometer (Grimm 1.109) was calibrated by flow. As the concentration of PM in upper air was low, results were recorded every 60 s to minimize the measurement error. During this time, the UAV circulated and returned to the same latitude and longitude once. The altitude of the mixed layer was obtained using the California meteorological (CALMET) module in the California puff (CALPUFF) model, and the weather field calculated by the weather research and forecasting (WRF) model was selected as the initial guess field (Cui et al. Citation2020). Meteorological data such as temperature, relative humidity, wind speed, and wind direction at different altitudes were simulated using the WRF model, and the National Centers for Environmental Prediction (NCEP) FNL reanalysis data were used as the driving field (Gholami et al. Citation2021). As the relative humidity obtained by the simulation was less than 60%, it has little effect on the Grimm 1.109 (Crilley et al. Citation2020), and the measurements were not corrected for humidity. The backward trajectory was analyzed using the TrajStat plug-in function of MeteoInfoMap (Wang, Zhang, and Draxler Citation2009). The test site (116.89°E, 39.64°N) was used as the simulation starting point, and backward trajectory in 48-hour was calculated with a simulation altitude of 200 m (Wang et al. Citation2021).
The air quality index (AQI) was used to classify the air quality condition. The reference standards were the National standard of the People’s Republic of China: the Ambient Air Quality Standards (GB3095–2012) and the Technical Regulation on Ambient Air Quality Index (on trial) (HJ 633–2012). PM (PM2.5 and inhalable particles (PM10)) concentrations and AQI from January 3, 2017 to January 10, 2017 of the ground air quality station in Tianjin were obtained from the national urban air quality data released by the China Environmental Monitoring Center. It can be seen from that this area experienced a heavy pollution process on January 3; the air quality condition was Severe polluted (AQI >300). This pollution process lasted for a long time and affected a wide area – surrounding areas of seven provinces including Beijing, Tianjin, Hebei, and Shanxi issued the haze orange warning. On January 9 and 10, the improvement process continued and the air quality situation was Excellent (AQI <50). Due to airspace restrictions in the BTH region, four tests under two different air quality conditions were selected to analyze the characteristics of the particle mass. The information of each test is shown in .
Figure 2. (a) PM concentrations and (b) AQI in Tianjin from January 3, 2017 to January 11, 2017. Data were obtained from the national urban air quality report released by the China environmental monitoring center. Flight 1 is under the Severe polluted condition (Aqi>300), and other flight are under the Excellent condition (Aqi<50).
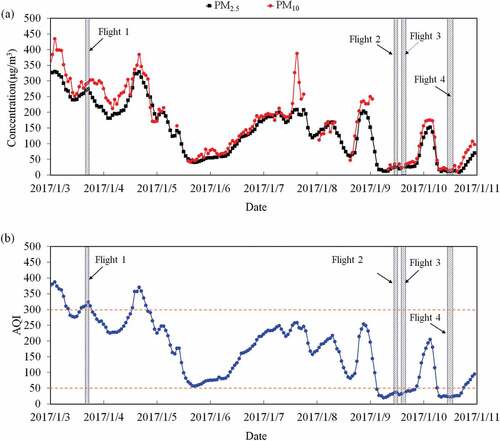
Table 1. Information about the flight test and air quality of Tianjin in the same period.
Results and discussion
Changes of PM2.5 concentrations with altitude
The flight trajectory and the PM2.5 mass concentration are illustrated in . On each flight, there was a negative correlation between the altitude and PM2.5 mass concentration. On Flight 1, PM2.5 concentrations at 20 m and 60 m were 232.5 μg/m3 and 222.1 μg/m3, respectively. In general, PM2.5 concentration showed a decreasing trend as the altitude increased, but there was a local maximum at 260 m and 400 m. Chan et al. (Citation2005) also observed the same phenomenon at 200 m in Beijing. They found that the PM2.5 concentration decreased significantly from 8 m to 100 m, but started to increase and formed a local peak at 200 m before another noticeable decrease. Han et al. (Citation2018) reported peaks of PM2.5 concentration at 200 m and 400 m. Shi et al. (Citation2018) analyzed the air pollution transmission in fall and winter in Beijing, and found a transmission layer at an altitude of 0.3–0.5 km, whether it was gentle pollution, single-peak pollution, or double-peak pollution. Therefore, the peak observed at 200 m and 400 m might be caused by the transmission layer, which may have oriented from the transportation of particles emitted by pollution sources in Beijing and nearby areas. At altitudes above 500 m, the impact of urban pollution sources reduced, and atmospheric diffusion conditions were good. The concentration of PM was significantly reduced, and changes in the mass concentration of PM above 500 m were not obvious. On Flights 2, 3, and 4, the air quality condition was Excellent. PM2.5 concentrations also showed a decreasing trend with increase in altitude, but the change was not obvious. PM2.5 concentration at each altitude was similar – in the range of 2–10 μg/m3.
Figure 3. Flight trajectory and PM2.5 mass concentration on each flight, with an altitude range of 11–920 m. Flight 1 is under the Severe polluted condition; other flight are under the Excellent condition. (a) Flight 1; (b) Flight 2; (c) Flight 3; (d) Flight 4; (e) Average concentration of PM2.5.
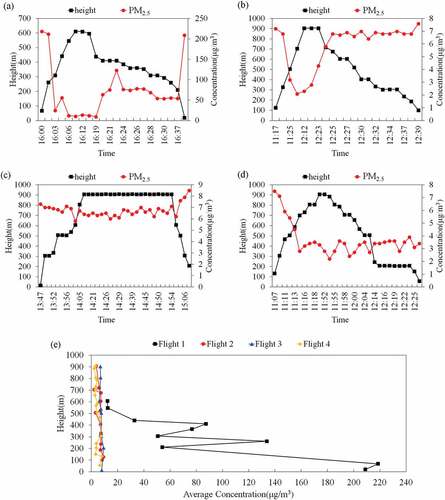
The average concentration of PM2.5 at similar altitudes is shown in ; the order was: Flight 1 > Flight 2 ≈ Flight 3 ≈ Flight 4. It was found that the altitude of the boundary layer can affect the diffusion of particles (Lu et al. Citation2019; Ma et al. Citation2018; Miao et al. Citation2019). When the altitude of the boundary layer was low, the vertical diffusion capacity and environmental capacity of this area were reduced, leading to the accumulation of PM and the occurrence of heavy pollution weather (Ma et al. Citation2018). In contrast, increasing in the altitude of the mixed layer was conducive to the vertical diffusion of pollution (Lu et al. Citation2019). The altitudes of the boundary layer by simulation on Flights 1, 2, 3, and 4 were 92.0 m, 206 m, 233 m, and 375 m, respectively. On Flight 1, the altitude of the boundary layer was significantly lower than in other flights; however, the pollution was the most serious. As the altitude of the boundary layer increased, PM2.5 mass concentration decreased; the concentration in Flight 4 was the lowest.
Relationship between the mass concentration of particles with different sizes and meteorological conditions
Changes in the mass concentration of three different particle sizes (PM1, PM2.5, and PM10) with altitude are shown in . The concentrations of PM1, PM2.5, and PM10 were quite similar. In all the experiments, the proportion of PM1 in PM10 were more than 70%, and the proportion of PM2.5 in PM10 were more than 80%. Additionally, Wang et al. (Citation2008) identified that the average ratio of PM2.5 to PM10 mass concentration was 0.84. They concluded that this might be because PM2.5 and PM10 were affected by similar sources in the Yangtze River Delta region of China. Generally, with increase in altitude, the mass concentration of each kind of PM decreased. According to , the changing trends of PM1 and PM2.5 were identical. Compared with the values at 20 m, they all have a slight increase at 60 m. Combined with the changes in temperature in , it can be identified that there was an inversion layer below 60 m. This would make the atmosphere relatively stable, and hinder the transmission of PM to the upper atmosphere, leading to an accumulation of fine PM (Peng et al. Citation2015). Thereafter, the concentration of PM1 and PM2.5 decreased significantly in the range of 60–200 m, with a rate of 90 μg/m3 per 100 m. Peaks at 260 m and 400 m were affected by the pollution that oriented from local pollution and transportation from nearby areas. PM10 concentration decreased as altitude increased, except for a slight increase at 260 m. This might indicate that the sedimentation of coarse particles was more obvious in the near-surface layer. The decreasing rate of PM10 mass concentration was 92.7 μg/m3 per 100 m below 200 m, but had a local increase at 260 m and 400 m. On Flight 2, temperature decreased monotonously as altitude increased, and no inverse layer was observed. Therefore, the diffusion condition was better and the reduction of PM concentration was more obvious. The mass concentration of PM2.5 and PM10 was below 10 μg/m3 in the range of 100–900 m. Compared with the average concentrations of PM2.5 and PM10 measured by the ground monitoring station (24 μg/m3 and 31 μg/m3, respectively), the concentration decreased slightly at high attitude. The situations on Flight 3 and Flight 4 were quite similar to that on Flight 2. Temperature in indicates a good diffusion condition as well. The long lasting good situation further reduced the concentration of pollutants: the concentration of particles on Flight 4 was the lowest, and the concentration of PM10 was below 8 μg/m3 in the range of 100–900 m. Additionally, relative humidity may influence PM concentration, because higher air humidity was more favorable for aerosol particle formation (Li et al. Citation2018a). It can be seen from that higher relative humidity on Flight 1 may contribute to higher particle concentrations, and the lowest relative humidity on Flight 4 may lead to lowest particle concentrations.
Figure 4. Changes in PM concentrations and meteorological factors with altitude. Flight 1 is under the Severe polluted condition; the other flight are under the Excellent condition. (a) PM1, PM2.5, and PM10 concentrations on each flight; (b) Simulated temperature and relative humidity on each flight.
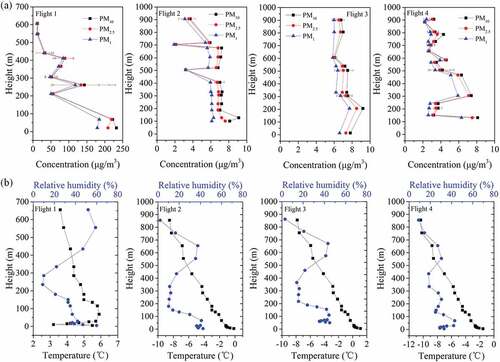
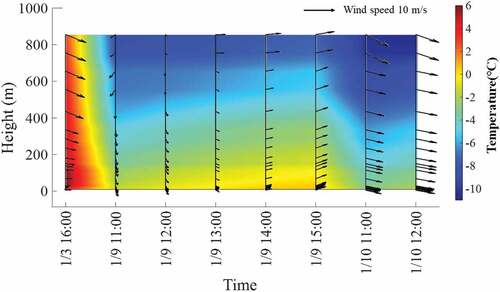
To analyze the atmospheric diffusion conditions during the experimental period, the wind speed, wind direction, and temperature at different altitudes on each flight are illustrated in . On Flight 1 on January 3, the temperature was relatively high, and temperature inversion occurred in the near surface layer (below 200 m). Additionally, wind speed was less than 2 m/s below 100 m. Below the temperature inversion layer, particles cannot diffuse into the upper atmosphere, leading to the accumulation of PM. At a higher attitude, such as 300–500 m, as the dominant wind direction in the study area was northwest, PM concentration was more affected by the pollutants released from Beijing in the northwest. Since January 9, the temperature inversion phenomenon disappeared, and the vertical stratification of temperature was obvious. Diffusion conditions improved and the pollution significantly reduced. As the wind speed increased on January 10, diffusion conditions were the best and the particle concentration was the lowest.
Figure 5. Changes in wind speed, wind direction, and temperature with time and altitude during the flight test. Data of 16:00 on January 3 is for Flight 1. Data of 11:00–13:00 on January 9 is for Flight 2. Data of 13:00–15:00 on January 9 is for Flight 3. Data of 11:00–12:00 on January 10 is for Flight 4.
A correlation analysis between particle concentration and meteorological factors at different altitudes was conducted. As shown in , in general, PM concentrations were positively correlated with temperature, and negatively correlated with wind speed and altitude – similar to previous reports (Galindo et al. Citation2011; Zhao et al. Citation2013). Relative humidity shows only a weak positive correlation, maybe because the variation of particle concentration in the vertical direction was mainly related to atmospheric diffusion and distance from the pollution sources, with little relation to relative humidity.
Table 2. Pearson correlation coefficients between PM concentrations and meteorological factors.
Particle size spectra at different altitudes
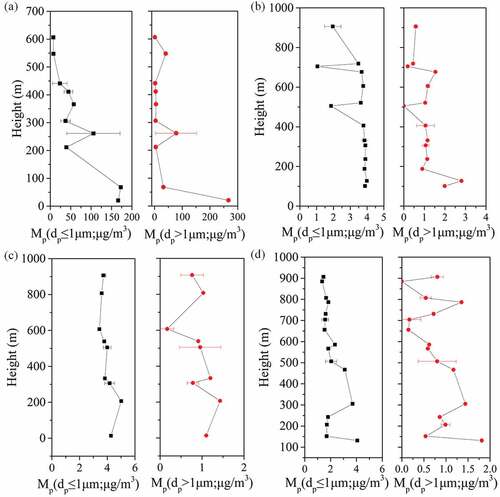
As the performance of small particles (particle diameter (Dp) <1 μm) and large particles (Dp >1 μm) may be different, their changes in terms of mass concentration are separately illustrated in . Weather conditions notwithstanding, the concentration of large and small particles varied simultaneously – this is in line with previous studies (Brady et al. Citation2016). For the Severe polluted in Flight 1, the mass concentration of large particles near the ground (20 m) was larger than that of small particles. From 100 m onward, the mass concentration of small particles accounted for the vast majority of total particle concentration. As the altitude increased, the decreasing rate of large particles became significantly higher than that of small particles, and dropped sharply by 88% within 60 m. Meanwhile, the concentration of small particles decreased to 86% above 400 m. In Flights 2, 3, and 4, as the altitude increased, the concentration of large and small particles varied in a smaller range. The mass concentration of small particles was greater than that of large particles. Compared with Flight 1, the mass concentration of large particles in the near ground layer was extremely small.
Figure 6. Particle mass concentration with altitude, which is divided into small particles (Dp <1 μm) and large particles (Dp> 1 μm). Flight 1 is under the Severe polluted condition; the other flights are under the Excellent condition. (a) Flight 1; (b) Flight 2; (c) Flight 3; (d) Flight 4.
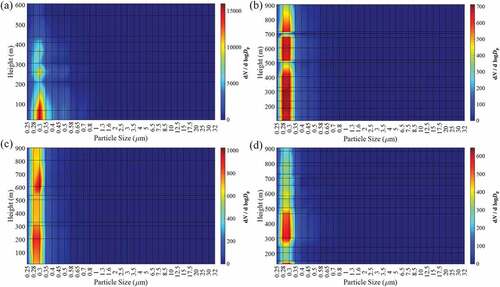
Detailed analysis of the mass concentration was performed. The distribution spectrums of PM under four flight conditions are shown in . Under the Severe polluted condition (Flight 1), two main peaks on the particle sizes were observed below 60 m, including large particles with the size of 15–30 μm and small particles with the size of less than 1 μm. Particles of 15–30 μm contribute the most to the mass concentration in this layer. This phenomenon indicated that heavy pollution conditions would not only cause a significant increase in fine particles, but also cause a concentrated explosion of particles with a particle size greater than 15 μm, resulting in a significant increase in the concentration of PM. Other studies also identified that particle size distribution of urban aerosols was mostly bimodal. In the range of 100–200 m, the concentration of particulates decreased significantly with the increase of altitude, and the main particle size remained less than 1 μm. The trend of change in all particle sizes was the same, and the increase and decrease were synchronous – possibly because the sources of the particles were similar. On Flights 2, 3, and 4, the particle mass concentration was further reduced, and the mass distribution spectrum varied in a small range within 0–900 m. Compared with the Severe polluted condition (Flight 1), particle size that contributed the most to the mass concentration further decreased, and the main particle size was less than 0.35 μm.
Figure 7. Vertical distribution of mass concentration spectrum of each flight. Flight 1 is under the Severe polluted condition; the other flights are under the Excellent condition. (a) Flight 1; (b) Flight 2; (c) Flight 3; (d) Flight 4.
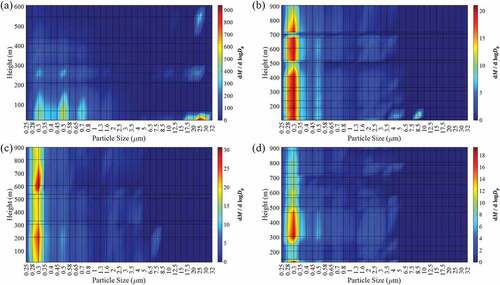
Due to its special physical and chemical properties, PM1 had a greater impact on human health and atmospheric environmental quality. Research has found that PM1 is rich in toxic substances and can enter the lungs, alveoli, and blood. Long residence time in the atmosphere, long transportation distance, and high toxicity make it a matter of concern. Overall, under the Severe polluted condition, PM1 occupied the main part in the higher altitude range, which facilitated easy regional transmission. Three peaks at 0.28–0.35 μm, 0.45–0.58 μm, and 0.65–0.8 μm were observed – in line with a study in Chengdu, China (Peng et al. Citation2020). This might be because these particles were in the range of the accumulation mode. In this range of particle size, particles did not easily diffuse or collide in the environment, which made their transformation into larger coarse particles difficult. Meanwhile, as the air quality was Excellent, smaller particles in the size range of 0.28–0.35 μm were the dominant components in the entire altitude range.
Additionally, although particles larger than 15 μm can significantly reduce within 100 m, it should not be underestimated. As the main activity space of organisms was in the near-ground layer, it also had a significant impact on human health. Moreover, when the mass concentration began to change, the largest variation occurred in this particular range. Therefore, in addition to paying attention to the changes in PM1, it is also recommended to focus on the diffusion of particles larger than 15 μm in future research.
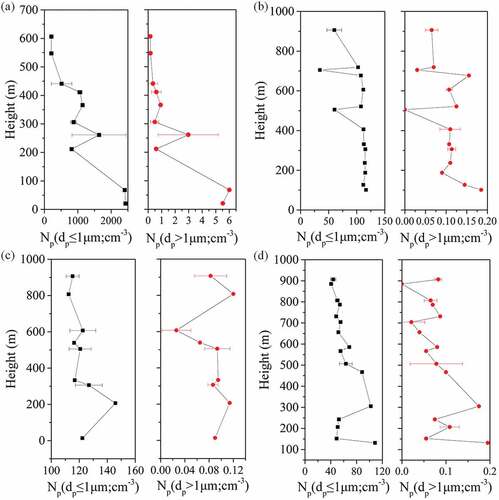
shows the changes in the number of large particles and small particles at different altitudes. Same as the mass concentration, large particles and small particles had the same trend in the number concentration. However, the number of small particles was significantly larger than that of large particles in all altitude ranges, and the difference was 2–3 orders of magnitude. Under the Severe polluted condition (Flight 1), with the increase in altitude, the number concentration of large particles decreased significantly faster compared to that of small particles. Compared with the number concentration of particles at 20 m, the concentration of large particles reduced by 89% at 200–300 m. Meanwhile the small particles were reduced by 79% when the altitude was above 440 m, similar with other studies (Li et al. Citation2016). When the air quality was Excellent, the number of large particles was very few, and the number concentration of small particles was one order of magnitude smaller than that of Heavy pollution condition.
Figure 8. Particle number variation with altitude that is divided into small particles (Dp <1 μm) and large particles (Dp> 1 μm). Flight 1 is under Severe polluted condition, and other flight are under excellent condition. (a) Flight 1; (b) Flight 2; (c) Flight 3; (d) Flight 4.
The number concentration distribution spectrum of particles is shown in . shows the particle number distribution under the Severe polluted condition. Different from mass concentration, small particles had magnitude advantage in quantity at all altitudes, and the largest proportion was of particles smaller than 0.35 μm – this is similar to the study on particle pollutants during the Campaigns of Air Quality Research in Beijing and Surrounding Regions in 2008 (Zhang et al. Citation2014). The number of particles with size greater than 15 μm was 10-digit level, indicating that their high contribution in mass concentration might be attributed to the large quality of individual particles. The number concentrations in Flights 2, 3, and 4 were further reduced – Flight 4 had the smallest number concentration. Particle number concentrations in these flights were 15-times lower compared with the Severe polluted condition.
Figure 9. Vertical distribution of number concentration spectrum of each flight. Flight 1 is under the Severe polluted condition; the other flights are under the Excellent condition. (a) Flight 1; (b) Flight 2; (c) Flight 3; (d) Flight 4.
Backward trajectory analysis
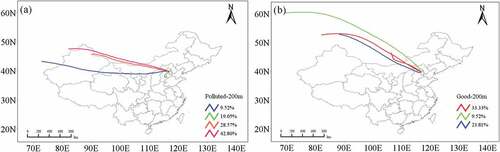
Cluster analysis of 48 h backward trajectories at 200 m in the test site was conducted, and the results were shown in . The transmission path and direction represented the area through which the airflow passes before reaching the test site, and the transmission distance can determine the airflow transmission speed (Wang et al. Citation2021). Under the Severe polluted condition, the airflow was mainly attributed to a long-distance airflow in the westward direction. This airflow passes through many provinces, including Xinjiang, Gansu, Inner Mongolia, Shanxi, Hebei, and Beijing. Additionally, there was swirling airflow with a short transmission distance in the south, mainly from the Hebei Province in the southwest. Therefore, the occurrence of severe pollution might be a combination of two effects: the transmission of PM generated from the provinces within the airflow trajectory, especially the southwest of the Hebei Province; and, the temperature inversion phenomenon on January 3, which intensified the accumulation effect of PM. The airflow under clean weather conditions was mainly long-distance transport airflow in the northwest direction, and the airflow only passed through Inner Mongolia, Hebei, and Beijing. No temperature inversion phenomenon occurred, and the air temperature near the surface was relatively low, so diffusion conditions were much better.
Figure 10. Backward trajectory clusters at the test site. The observation data are based on the State-controlled station in Tianjin, and the test site (116.89°E, 39.64°N) is used as the simulation starting point. The 48 h backward trajectory of the measurement point is calculated. The simulation altitude is 200 m. (a) Severe polluted condition; (b) Excellent condition.
Conclusion
A UAV equipped with an isokinetic sampling head and a portable aerosol particle size spectrometer was used to study the vertical distribution of PM under two types of air quality condition. Variations in particle concentrations with altitude, as well as changes in small particles (Dp <1 μm) and large particles (Dp >1 μm) were compared. The results showed that although there was a magnitude difference between the number of large and small particles, the variation trend was the same. Under the Severe polluted condition, mass concentration of PM decreased significantly from 200 μg/m3 to less than 50 μg/m3 in the altitude range of 60–400 m; two peaks at 260 m and 400 m were observed. The decrease rate of large particles was significantly higher than that of small particles with increase in altitude. Under the Excellent condition, PM2.5 concentration was below 10 μg/m3 in the altitude range of 10–900 m. Compared with the Severe polluted condition, small particles were one order of magnitude lower in mass, and 2–3 order lower in number. Correlation analysis of meteorological factors and backward trajectory indicated that the pollution was caused by particle concentration transport in multiple provinces, and particle accumulation due to temperature inversion.
The particle size spectrum of the mass concentration and number concentration of the particles was further studied, and the particle size ranges with the highest contribution at different altitudes were obtained. The results showed that under the Severe polluted condition, altitude had a significant impact on the particle size spectrum of mass concentration. Below 60 m, the main range that affected the mass concentration was 15–30 μm. When the altitude increased to 260 m and 400 m, the most apparent change was also observed in this range. However, particles less than 1 μm in size also had a considerable contribution in the entire altitude range. Under the Excellent condition, the particle size was smaller, and the main ranges of particle size were below 0.35 μm. The number concentration spectrum showed that the main particle size ranges that affects number concentration were all below 0.35 μm under the two pollution conditions, presenting an overwhelming advantage of small particles. As small particles can stay, and be transported, over a larger area and at a higher altitude, the diffusion and transportation of PM in this range should be of concern.
More air quality conditions will be studied and compared in the future. Additionally, in the case of severe pollution, the composition and health effects of particles with a particle size range of 15–30 μm should also be further investigated.
Disclosure statement
No potential conflict of interest was reported by the author(s).
Data availability statement
The data that support the findings of this study are available from the corresponding author, upon reasonable request.
Additional information
Funding
Notes on contributors
Shanshan Li
Shanshan Li is a professor in Green Development & Intelligent EP Tech Center, Beijing Municipal Research Institute of Eco-Environmental Protection, Beijing, PR China.
Min Xing
Min Xing is an associate professor in Green Development & Intelligent EP Tech Center, Beijing Municipal Research Institute of Eco-Environmental Protection, Beijing, PR China.
Lei Jiang
Lei Jiang is a professor in Mentougou District Ecology and Environment Bureau of Beijing Municipality, Beijing, PR China.
Peng Chen
Peng Chen is an engineer in Green Development & Intelligent EP Tech Center, Beijing Municipal Research Institute of Eco-Environmental Protection, Beijing, PR China.
Feng Ding
Feng Ding is a senior engineer in Beijing Shangyun Environment Co. Ltd, Beijing, PR China.
Wen Yang
Wen Yang is a professor in State Key Laboratory of Environmental Criteria and Risk Assessment, Chinese Research Academy of Environmental Sciences, Beijing, PR China.
References
- Brady, J. M., M. D. Stokes, J. Bonnardel, and T. H. Bertram. 2016. Characterization of a quadrotor unmanned aircraft system for aerosol-particle-concentration measurements. Environ. Sci. Technol. 50 (3):1376–83. doi:10.1021/acs.est.5b05320.
- Chan, C. Y., X. D. Xu, Y. S. Li, K. H. Wong, G. A. Ding, L. Y. Chan, and X. H. Cheng. 2005. Characteristics of vertical profiles and sources of PM2.5, PM10 and carbonaceous species in Beijing. Atmos. Environ. 39 (28):5113–24. doi:10.1016/j.atmosenv.2005.05.009.
- Crilley, L. R., A. Singh, L. J. Kramer, M. D. Shaw, M. S. Alam, J. S. Apte, W. J. Bloss, L. Hildebrandt Ruiz, P. Q. Fu, W. Q. Fu, et al. 2020. Effect of aerosol composition on the performance of low-cost optical particle counter correction factors. Atmos. Meas. Tech. 13 (3):1181–93.
- Cui, H. L., R. T. Yao, L. Q. Chen, M. H. Lv, C. T. Xin, and Q. Wu. 2020. Field study of atmospheric boundary layer observation in a hilly Gobi Desert region and comparison with the CALMET/CALPUFF model. Atmos. Environ. 235:117576. doi:10.1016/j.atmosenv.2020.117576.
- Galindo, N., M. Varea, J. Gil-Moltó, E. Yubero, and J. Nicolás. 2011. The influence of meteorology on particulate matter concentrations at an urban Mediterranean location. Water Air Soil Pollut. 215 (1):365–72.
- Gholami, S., S. Ghader, H. Khaleghi-Zavareh, and P. Ghafarian. 2021. Sensitivity of WRF-simulated 10 m wind over the Persian Gulf to different boundary conditions and PBL parameterization schemes. Atmos. Res. 247:105147–65. doi:10.1016/j.atmosres.2020.105147.
- Guo, W., H. F. Yu, and G. D. Huang. 2017. PM_(2.5) monitoring technology based on unmanned aerial vehicle. Bull. Surv. Mapp. S1:147–51.
- Haas, P., C. Balistreri, P. Pontelandolfo, G. Triscone, H. Pekoz, and A. Pignatiello. 2014. Development of an unmanned aerial vehicle UAV for air quality measurement in urban areas. 32nd AIAA Applied Aerodynamics Conference. doi:10.2514/6.2014-2272.
- Han, S. Q., T. T. Hao, Y. F. Zhang, J. L. Liu, P. N. Li, Z. Y. Cai, M. Zhang, Q. L. Wang, and H. Zhang. 2018. Vertical observation and analysis on rapid formation and evolutionary mechanisms of a prolonged haze episode over central-eastern China. Sci. Total Environ. 616-617:135–46.
- Hinas, A., J. M. Roberts, and F. Gonzalez. 2017. Vision-based target finding and inspection of a ground target using a multirotor UAV system. Sensors 17 (12):2929. doi:10.3390/s17122929.
- Hovorka, J., C. Leoni, V. D. Ekalová, J. Ondráček, and A. Zíková. 2016. Aerosol distribution in the planetary boundary layer aloft a residential area. Iop Conference 44:052017.
- Jiang, L., S. S. Li, W. J. Yang, Y. B. Chen, B. F. Cheng, F. Meng, and Z. Z. Zhang. 2017. Analysis on the characteristics of PM2.5 in a heavy air pollution episode in Beijing in December 2015. Environ. Eng. 35 (9):64–70.
- Lambey, V., and A. D. Prasad. 2021. A review on air quality measurement using an unmanned aerial vehicle. Water Air Soil Pollut. 232 (3):1–32. doi:10.1007/s11270-020-04973-5.
- Levin, J. M., M. Nahon, and A. A. Paranjape. 2019. Real-time motion planning with a fixed-wing UAV using an agile maneuver space. Auton. Robots 43 (8):2111–30. doi:10.1007/s10514-019-09863-2.
- Li, Y., S. Q. Ma, X. F. Jia, Y. Zheng, S. Lu, and H. J. Zhao. 2016. Vertical distribution of atmospheric particulate matter during a heavy fog-haze event in Beijing observed by an unmanned aerial vehicle. J. Meteorol. Environ. 32 (6):179–83.
- Liu, Q., D. P. Ding, M. Y. Huang, P. Tian, D. L. Zhao, F. Wang, X. Li, K. Bi, J. J. Sheng, W. Zhou, et al. 2018. A study of elevated pollution layer over the North China Plain using aircraft measurements. Atmos. Environ. 190:188–94. doi:10.1016/j.atmosenv.2018.07.024.
- Li, X. B., D. F. Wang, Q. C. Lu, Z. R. Peng, Q. Y. Fu, X. M. Hu, J. T. Huo, G. L. Xiu, B. Li, C. Li, Wang, D. S., and Wang, H. Y. 2018a. Three-dimensional analysis of ozone and PM2.5 distributions obtained by observations of tethered balloon and unmanned aerial vehicle in Shanghai, China. Stochastic Environ. Res. Risk Assess. 32 (5):1189–203.
- Li, X. B., D. S. Wang, Q. C. Lu, Z. R. Peng, and Z. Y. Wang. 2018b. Investigating vertical distribution patterns of lower tropospheric PM2.5 using unmanned aerial vehicle measurements. Atmos. Environ. 173:62–71.
- Lu, S. J., D. S. Wang, X. B. Li, Z. Y. Wang, Z. R. Peng, and Y. Gao. 2017. Three-dimensional distribution of fine particulate matter measured by an UAV sampling platform. Sci. Technol. Eng. 17 (8):94–100.
- Lu, S. J., D. S. Wang, Z. Y. Wang, B. Li, Z. R. Peng, X. B. Li, and Y. Gao. 2019. Investigating the role of meteorological factors in the vertical variation in PM2.5 by unmanned aerial vehicle measurement. Aerosol Air Qual. Res. 19 (7):1493–507. doi:10.4209/aaqr.2018.07.0266.
- Ma, Y. J., H. J. Zhao, Y. S. Dong, H. Z. Che, X. X. Li, Y. Hong, X. L. Li, H. B. Yang, Y. C. Liu, Y. F. Wang, et al. 2018. Comparison of two air pollution episodes over Northeast China in winter 2016/17 using ground-based Lidar. J Meteorol. Res. 32 (2):313–23. doi:10.1007/s13351-018-7047-4.
- Miao, Y. C., S. H. Liu, L. Sheng, S. X. Huang, and J. Li. 2019. Influence of boundary layer structure and low-level jet on PM2.5 pollution in Beijing, a case study. Int. J. Environ. Res. Public Health 16 (4):616.
- Niu, J., and R. B. Wang. 2014. PM2.5 low altitude measurement system based on six-rotor UAV. Sci. Technol. Eng. 14 (36):72–76.
- Peng, S., P. Kang, X. L. Zhang, Schaefer, K., Yuan, L., Xiang, W. G., and Lei, Y. 2020. Size distribution of atmospheric particles in Chengdu and its influence on visibility. Acta Scientiae Circumstantiae 40 (12):4432–41.
- Peng, Z. R., D. S. Wang, Z. Y. Wang, Y. Gao, and S. J. Lu. 2015. A study of vertical distribution patterns of PM2.5 concentrations based on ambient monitoring with unmanned aerial vehicles, a case in Hangzhou, China. Atmos. Environ. 123:357–69.
- Puijenbroek, V. M. E. B., C. Nolet, D. A. V. Groot, J. M. Suomalainen, M. J. P. M. Riksen, F. Berendse, and J. Limpens. 2017. Exploring the contributions of vegetation and dune size to early dune development using unmanned aerial vehicle (UAV) imaging. Biogeosciences 14 (23):5533–49.
- Shi, L. L., L. J. Li, X. H. Wang, L. Jiang, L. K. Zhang, Y. Qiu, D. W. Zhang, and T. F. Kang. 2018. Analysis of characteristics of air pollution transmission in fall and winter by remote sensing in Beijing. Acta Scientiae Circumstantiae 38 (10):3834–45.
- Shi, H. X., S. Y. Wang, and S. D. Guo. 2019. Predicting the impacts of psychological factors and policy factors on individual’s PM2.5 reduction behavior, an empirical study in China. J. Clean. Prod. 241:118416.
- Villa, T. F., R. A. Brown, E. R. Jayaratne, L. F. Gonzalez, L. Morawska, and Z. D. Ristovsk. 2019. Characterization of the particle emission from a ship operating at sea using an unmanned aerial vehicle. Atmos. Meas. Tech. 12 (1):691–702. doi:10.5194/amt-12-691-2019.
- Villa, T. F., E. R. Jayaratne, L. F. Gonzalez, and L. Morawska. 2017. Determination of the vertical profile of particle number concentration adjacent to a motorway using an unmanned aerial vehicle. Environ. Pollut. 230:134–42. doi:10.1016/j.envpol.2017.06.033.
- Wang, Z., J. Huo, H. Du, D. Wang, Li, J., Zhang, C. B., Zhang, T., Wang, W., Wang, H. B., and Yang, W. Y. 2021. Long term characteristics and potential sources of PM2.5 in Rizhao City from 2015 to 2019. China Environ. Sci. 41 (9):3969–80.
- Wang, D. S., Z. R. Peng, B. Li, X. B. Li, and G. L. Xiu. 2019. Vertical atmospheric structure observation technology based on multi-rotor unmanned aerial vehicle (UAV) platform. Equip. Environ. Eng. 16 (6):35–40.
- Wang, W., L. H. Ren, Y. H. Zhang, J. H. Chen, H. J. Liu, L. F. Bao, S. J. Fan, and D. G. Tang. 2008. Aircraft measurements of gaseous pollutants and particulate matter over Pearl River Delta in China. Atmos. Environ. 42 (25):6187–202. doi:10.1016/j.atmosenv.2008.06.001.
- Wang, Y., X. Zhang, and R. Draxler. 2009. TrajStat: GIS-based software that uses various trajectory statistical analysis methods to identify potential sources from long-term air pollution measurement data. Environ. Modell. Software 24 (8):938–39. doi:10.1016/j.envsoft.2009.01.004.
- Weber, K., G. Heweling, C. Fischer, and M. Lange. 2017. The use of an octocopter UAV for the determination of air pollutants - a case study of the traffic induced pollution plume around a river bridge in Duesseldorf, Germany. Int. J. Environ. Sci. 2:63–66.
- Wei, H. H. 2019. Impacts of China’s national vehicle fuel standards and subway development on air pollution. J. Clean. Prod. 241:118399.
- Yuan, W. H., J. J. Li, L. Meng, X. N. Qin, and X. X. Qi. 2019. Measuring the area green efficiency and the influencing factors in urban agglomeration. J. Clean. Prod. 241:118092. doi:10.1016/j.jclepro.2019.118092.
- Zhang, Z. H., N. Chen, B. Zhu, H. T. Tao, and H. R. Cheng. 2022. Source analysis of ambient PM2.5 in Wuhan city based on random forest model. Environ. Sci. 43 (3):1151–58.
- Zhang, J., Y. Ji, J. Zhao, and J. Zhao. 2017. Optimal location of a particulate matter sampling head outside an unmanned aerial vehicle. Particuology 32 (3):153–59. doi:10.1016/j.partic.2016.09.012.
- Zhang, W., T. Zhu, W. Yang, Z. Bai, Y. L. Sun, Y. Xu, B. Yin, and X. Zhao. 2014. Airborne measurements of gas and particle pollutants during CARE Beijing-2008. Atmos. Chem. Phys. 14 (1):301–16. doi:10.5194/acp-14-301-2014.
- Zhao, H. J., H. Z. Che, X. Y. Zhang, Y. J. Ma, Y. F. Wang, H. Wang, and Y. Q. Wang. 2013. Characteristics of visibility and particulate matter (PM) in an urban area of Northeast China. Atmos. Pollut. Res. 4 (4):427–34. doi:10.5094/APR.2013.049.