
ABSTRACT
In cement kilns co-processing hazardous solid wastes, the material is transported to the calciner for incineration via pipelines. When the viscous material enters the calciner in the form of plug flow, the CO and NOx emitted by the cement kiln fluctuate greatly as a result of insufficient combustion. In order to improve the dispersion of materials, avoid accumulation and make the combustion more sufficient, an experimental system was established to study the influence of nozzle system i, distance d, and pushing speed v on the dispersion characteristics.The slump test showed that the material with a sludge mass fraction of 35 40% had good fluidity. Moreover, the shape of the dispersion area was V-shape when the dispersion length was less than 4 6 m and became a rectangle when the dispersion length was more than 6 m. Finally, the results showed that i = 3 yielded the best effect, followed by i = 5, and i = 2 had the worst effect. In addition, d = 160 mm yielded the best effect, followed by d = 240 mm, and d = 80 mm had the worst effect. As the pushing speed v increased, the dispersion effect gradually worsened. The material that was 2 m away from the spray gun accounted for about 50% of the total.
Implications: In this paper, a method based on multiple gas jets atomization of hazardous waste is proposed and verified. This method can atomize the plug hazardous waste into granules, which not only improves the combustion efficiency of hazardous waste, but also reduces the fluctuation of CO. We believe that this method can be widely used in industry to increase the output of cement kiln collaborative disposal of hazardous waste.
Introduction
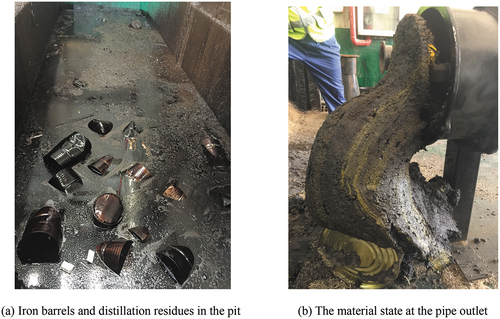
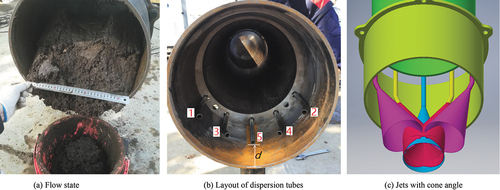
Hazardous wastes are solid wastes or liquid wastes that have one or more hazardous characteristics such as toxicity, corrosiveness, flammability, reactivity or infectivity, or that do not exclude hazardous characteristics and may have harmful effects on the environment or human health. Hazardous wastes usually include distillation residues, organic solvents, waste mineral oil, etc.Woven bags, iron barrels and wooden pallets transporting the hazardous wastes also belong to pollutants (Cudahy Citation1999; Hartenstein and Horvay Citation1996). Since the 1970s, developed countries such as Germany, Japan, the United States, Switzerland and Canada have begun to use the cement industry to dispose of waste. The collaborative disposal of hazardous waste in cement kilns has the advantages of high treatment temperature, stable combustion state, long incineration residence time, solidification of harmful elements and so on (Brunner Citation1993; David Citation1990). Cement kilns co-processing hazardous solid wastes mostly use crushing, mixing, and pumping processes to transport the hazardous waste to the cement kiln calciner through pipelines for incineration (Guangming Citation2018; Guangming et al. Citation2019; Guangming, Xiaowen, and Charnay Citation2018). As shown in , the hazardous waste pit contains a mixture of iron drum skins, woven bags, and plastic drums, which, after being crushed, are generally mixed with hazardous waste sludge and distillation residues in a certain proportion. Then the obtained mixture is pumped. Owing to the viscosity of the material, plug flow occurs during the pipeline transportation (Wu et al. Citation2016; Wu et al. Citation2013; Wu et al. Citation2014). When the viscous material enters the calciner in the form of plug flow, the CO and NOx emitted by the cement kiln fluctuate greatly due to insufficient combustion. In severe cases, the cement kiln is shut down due to the substandard emission.Therefore, it is very important to disperse the plug flow in order to combust sufficiently. Gas jet is an economical and feasible method at present.
The flow caused by ejecting gas from an orifice, nozzle, or slit is called a gas jet. When the speed at the outlet is high and the flow is in a turbulent state,the flow is called a free turbulent jet (Dong Citation1997; Liu Citation2008). Gong et al. (Citation2015, Citation2016) studied the process of gas jet impacting the particle layer of iron powder and obtained the cloud map of mass distribution around the impingement hole and the change of the impingement hole depth and diameter with the gas jet pressure. The simulation results were consistent with the experimental results. Li et al. (Citation2007) studied the relationship between the penetration depth of the circular jet and the jet velocity, jet diameter, and jet height. Tian and Gao (Citation2009) studied the impact of gas jet on the drying mechanism and fluidization of particulate materials. The study objects were food and dried fruits, such as apricots, grapes, and peppers. In addition, the particle size impacted by the gas jet was relatively large. Liu et al. (Citation2018a, Citation2018b, Citation2017) carried out experimental studies on limestone erosion by abrasive gas jets under different abrasive types and different target distances. Zhou et al. (Citation2019) studied the relationship of the cutting depth of hard clay with the cutting speed and jet pressure under the action of a high-pressure gas jet. Sun et al. (Citation2022) studied the secondary atomization of metal powder by gas jet tightly coupled annular slot nozzle, used the fluid volume method to couple the Reynolds stress model with the discrete phase model, combined with the Taylor analog instability crushing model to simulate the whole process of the primary and secondary atomization of tightly coupled annular slot nozzle, and carried out experimental verification. Fan et al. (Citation2022) used the simulation method based on fluent on the sludge atomization test platform to simulate the atomization and crushing of sludge in the gas assisted atomizer. Lin, Cai, and Liu (Citation2017) studied the variation of atomization characteristics of sludge single-phase nozzle, double channel external mixing nozzle, double channel internal mixing nozzle and three channel external mixing nozzle with liquid pressure, gas-liquid ratio, axial distance and radial distance. Zhang, Yu, and Zhang (Citation2013) studied the characteristics of atomization and combustion of oily sludge in pulverized coal boilers under the conditions of different mixing ratio of oily sludge and coal. Chu, Gao, and Ye (Citation2021) analyzed and compared the application and differences of spray gun in four different processes of combustion, denitration, semi dry absorption and wet washing in hazardous waste incineration system. Liu, He, and Guan (Citation2022) designed an atomizing nozzle based on Laval tube to generate supersonic flow of natural gas, shear and break the liquid flow into small droplets, and reduce the cross-sectional density and flow resistance of gas-liquid phase. Singh et al. (Citation2019) conducted atomization experiments with several nozzles with different structural parameters in the laboratory, and discussed the influence of nozzle structure on atomization effect. Jakobs et al. (Citation2012) established a CFD model of a high-pressure entrained flow gasifier and found that the gas velocity and reactor pressure had a significant impact on the average diameter of the spray produced. In order to obtain the influence of low temperature on the atomization characteristics of RP-3 aviation kerosene, Fu et al. (Citation2021) completed the atomization characteristics test of a nozzle with oil supply pressure of 300 700 kPa and fuel temperature of 25, −15, −35°C on the comprehensive test bench. A large number of scholars have carried out experimental research and simulation research in the fields of gas jet impacting cooling, impacting crushing, food drying, aviation kerosene atomization and so on,but no study has reported the use of a high-speed gas jet to disperse hazardous waste. It is feasible for gas jet to disperse hazardous waste.In this study, a spray gun dispersion characteristic test system based on free turbulent jet was established.The influences of different nozzle systems, different distances, and different pushing speeds on the dispersion characteristics were studied, which provides insights into the engineering application of high-speed air dispersion in hazardous waste treatment and the reduction of the impact on cement kilns.
Figure 1. Hazardous waste.
Materials and methods
Preparation materials
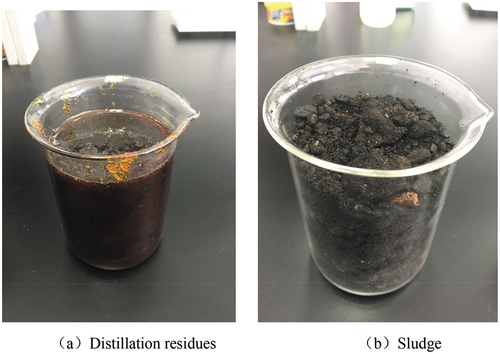
Distillation residues, organic solvents and waste mineral oil were the industrial wastes, and their calorific values were relatively high. They were usually transported in closed packaging in iron drums. As shown in , the distillation residues was liquid at normal atmospheric temperature and semi-solid at low temperature.As shown in , sludge was solid.The particle size of sludge was generally 0.1 3 mm, and some larger ones were 5 mm. The density was 1.04 1.08 × 10³kg/m3. Distillation residues had fluidity, but it was easy to adhere to the inside of the pipeline, causing pipeline blockage.The sludge did not have fluidity. Usually, high calorific value liquid hazardous wastes such as distillation residues were mixed with low calorific value sludge for pipeline transportation. The surface of the mixed sludge particles was covered with distillation residues, forming particle flocculation and plug flow, which can not only prevent the internal adhesion of the pipe, but also prevent the iron sheet from settling to the bottom of the pipe.
Figure 2. Distillation residues and sludge.
In this study, the sludge which was the largest output in industrial waste was mixed with distillation residues. The mixtures with 30%, 35%, 40%, and 45% sludge mass fraction were prepared respectively. The calorific values and chemical elements are shown in . The calorific value decreased with the increase of sludge mass fraction.Their calorific values met the minimum allowable calorific value of 11 MJ/kg of hazardous waste as an alternative fuel. The content of sulfur, chlorine and alkali metals was not high, which mets the requirements of kiln entry. If the excessive volatile substances such as sulfur, chlorine and alkali metals in hazardous wastes were recycled and enriched in the cement kiln, they not only caused corrosion damage to the kiln body, but also caused scaling blockage due to cool and melt in the pre-decomposition system at the kiln tail, and had an adverse impact on the quality of cement clinker.
Table 1. Calorific value and chemical element test results.
The working principle of slump is as follows: use a trumpet shaped bucket with an upper opening of 100 mm, a lower opening of 200 mm and a height of 300 mm to fill the materials in three times. After each filling, use a tamping hammer to evenly strike 25 times from the outside to the inside along the barrel wall. After tamping, smooth it. Then pull out the slump bucket, and the material will collapse due to its own weight. The height of the highest point of the material after the collapse is subtracted from the bucket height (300 mm), which is called the slump. If the difference is 10 mm, the slump is 10.The sludge was mixed with distillation residues to obtain mixed materials with 30%, 35%, 40%, and 45% sludge mass fraction.The slump test results are shown in and . According to the different slumps, the mixture could be divided into large-fluidity material (slump >150 mm), fluidity material (slump 100–150 mm), plastic material (slump 50–90 mm), and low-plasticity material (slump 10–40 mm) (Shen et al. Citation2016). The mixed material with a 30% sludge mass fraction belonged to large-fluidity material. It had good fluidity but was relatively thin. The iron sheet in the material was easy to settle in the pipeline transportation process, resulting in the delamination of the material and pipeline blockage.The mixed material with 45% sludge mass fraction belonged to plastic material. It had poor fluidity and was not conducive to pipeline transportation. The mixed material with a 35–40% sludge mass fraction belonged to fluidity material. It had good fluidity in the pipeline transportation. The iron sheet in the material would not settle, and the pumping process was characterized as plug flow. Therefore, a mixture with 35–40% sludge mass fraction was suitable for pipeline transportation.
Figure 3. Slump detection.
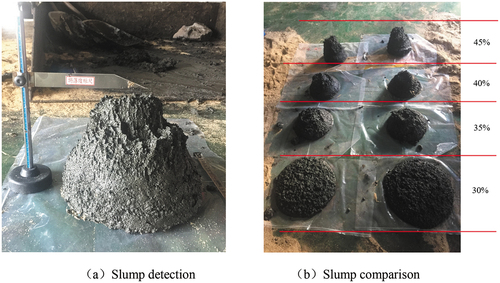
Table 2. Slump results.
Method
As shown in , the test system was mainly composed of the main body of the spray gun, the pneumatic system, and the hydraulic system. The main body of the spray gun mainly included a feed inlet, an outlet and pushing piston. A pneumatic system mainly included the air compressor, flowmeter, pressure gauge and the switch valves. So the multiple gas jets from different nozzles were formed. The hydraulic system could provide multiple pushing speeds. The working principle of the experimental system is as follows: First, the material was added from the upper feed inlet of the main body of the spray gun, and the hydraulic cylinder pushed the piston, which consequently pushed the material, causing it to slide along the inner wall of the charging cylinder to the outlet. Afterward, the air source was opened, and the materials were dispersed under the impact of multiple gas jets.
Figure 4. Spray gun dispersion characteristic test system.
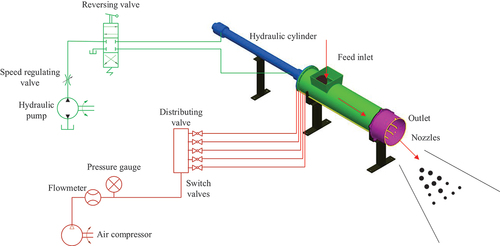
The main technical parameters are as follows: the diameter of the spray gun discharge port was 390 mm. The diameter of the material cylinder was 340 mm. The diameter of the gas dispersion tube was 14 mm. The displacement of the hydraulic cylinder was 1425 mm. The flow of the dispersed gas source was 1700 Nm3/h. The gas pressure was 20 bar. The adjustment range of the cylinder forward speed was 0 150 mm/s. The flow velocity at the gas tube outlet was 96–116 m/s.
The i represents the number of nozzles. As shown in , the material was concentrated on the middle and lower parts of the spray gun according to the flow state of the material at the spray gun outlet.As shown in , five gas tubes were symmetrically installed at the middle and lower parts of the spray gun, marked as 1, 2, 3, 4 and 5 respectively. Gas tube 5 was straight. The ends of gas tubes 1, 2, 3 and 4 featured a 20° elbow and were inclined toward the center of the outlet, which was beneficial to form a V-shape distribution. As shown in , the gas jet of the circular tube was conical. The staggered layered three-dimensional impact jet method was adopted to disperse the hazardous wastes. The straight tube 5 was used to directly impact the material at the bottom. The tubes 1, 2, 3 and 4 were respectively used on both sides to impact the material in the middle and high regions. The gas jet could completely impact the material at the outlet of the spray gun.
Figure 5. Structure of spray gun outlet.
As the material was dense and easy to jam after being exposed to high temperatures, straight-through pipes were used as the nozzles. A flowmeter was installed on the main gas tube which was divided into five branches using the distribution valve. Each gas branch had a manual ball valve, so the opening and closing of a single tube could be controlled. This would enable to study the dispersion characteristics of nozzle system 2, 3 and 5 respectively. Nozzle system i = 2 consisted of tube 3 and tube 4, nozzle system i = 3 consisted of tube 3, tube 4 and tube 5, and nozzle system i = 5 consisted of tube 1, tube 2, tube 3, tube 4 and tube 5.
The flow of the air compressor measured by the flowmeter was 1700 Nm3/h, and the gas temperature was 100°C. The flow velocity of nozzle system i = 2 was 116 m/s, the flow velocity of nozzle system i = 3 was 98 m/s, and the flow velocity of nozzle system i = 2 was 96 m/s.The same gas flow velocity(96 116 m/s) represented the same shear rate. The viscosity and shear stress of the material under the same shear rate were same.
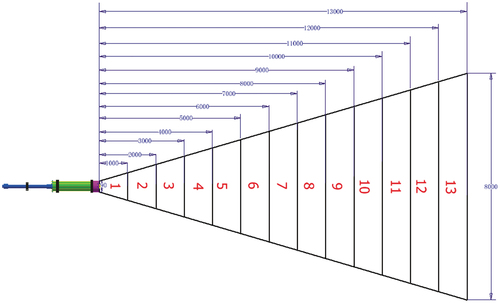
The d represents the distance between the air tube and the edge of the discharge port of the spray gun. If d was very small, the material had not been dispersed in the starting section and would fall directly near the spray gun. If d was large, the material would accumulate at the outlet and could not be dispersed because of its heavy weight. The length of the zone flow establishment was 12.4 multiplied by the nozzle radius 7 mm, i.e. 86.8 mm. The decay rate of the total kinetic energy of the circular free jet was fast in the range of 14 50 times of nozzle radius, i.e. 98 350 mm (Liu Citation2008). Therefore, d was designed as 80, 160 and 240 mm.
The speed v was mainly controlled using a speed regulating valve.The pushing speeds were 33, 48, 71, 88 and 105 mm/s which were consistent with that of the piston pump. presents the orthogonal experiment parameters.
Table 3. Parameters of orthogonal experiment.
Experiment procedure
Preparation materials: Material with 35% sludge mass fraction was prepared based on the slump test results.
Parameter set: The nozzle system i, distance d, and pushing speed v were set and recorded.
Feeding: The one-time pumping volume of the solid pump was 60 L. The density of the material was about 1.5 × 10³ kg/m3. The weight of each pumping was 90 kg. Material was added from the feed inlet.
Pushing: The piston was pushed by the hydraulic cylinder. The material was pushed to the spray gun outlet.
Dispersion: After the gas was open, the hydraulic cylinder continued to push the material at the set speed, and the material was dispersed under the effect of gas jets. The gas pressure and flow velocity during the dispersion were recorded.
Measurement:The experimental site was on a cement field which was in an open environment.The field was divided into V-shape areas according to an interval 1 m as show in . The included angle of V-shape was the dispersion angle. The width of each interval area and the total length of dispersion were measured using a tape. In addition, the material in each interval area was weighed. Three groups of test results were measured under the same working condition. The mean values were used.
Data processing: The experimental data were processed to obtain the area distribution, mass distribution curve, and area density curve.
Figure 6. V-shape experimental site.
Results and discussion
Area distribution
Influence of i on area distribution
The actual dispersion area distribution at i = 3, d = 160 mm, and v = 105 mm/s is shown in . The material belonged to non-Newtonian fluid and the maximum flow velocity was 0.105 mm/s. Since the material flow velocity was far lower than the gas flow velocity, the material was regarded as a static state. The material of non-Newtonian fluid was sheared by high velocity gas. The higher the shear rate, the lower the viscosity. The gas shear rate was about 2400 (1/s), and the viscosity of the material at this shear rate was very small. At the same time, the temperature of the gas reached 100°C, and the viscosity of the material decreased with the increase of temperature. When the viscous force was overcome, the particles were separated (Dzuy and Boger Citation1985).
Figure 7. The actual area distribution.
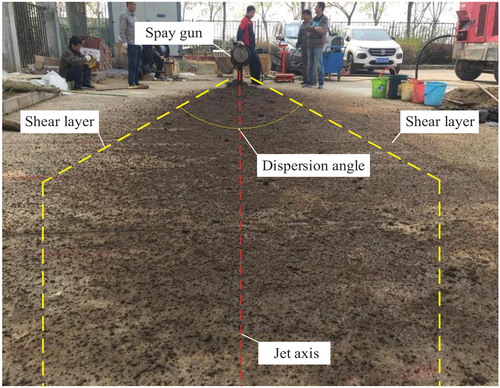
The shape of the dispersion area was V-shape near the spray gun. The included angle of V-shape was the dispersion angle. When the material was far from the spray gun, the shape of the dispersion area became a rectangle. The material was obviously completely dispersed. The particle size was about 5 mm. The jet axis direction was relatively dense, and the particles distributed on the shear layers were small and relatively sparse.The reason was that the center velocity of the jet axis was bigger than the velocities of both sides (Lefebver Citation1989).
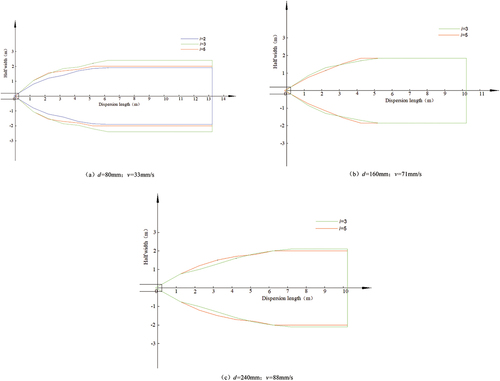
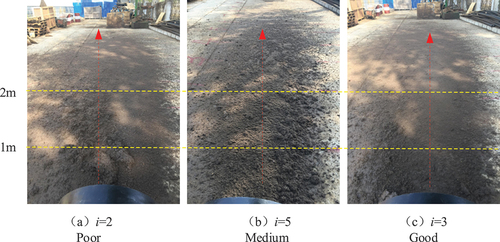
According to the key parameters such as the characteristic half-width of the jet flow, the maximum longitudinal velocity decay of the jet flow, and the frictional variation of the total kinetic energy, the dispersion area distribution in this study mainly refers to the dispersion length, half width and dispersion angle. As shown in , when d = 80 mm and v = 33 mm/s, the dispersion lengths of nozzle systems with two, three, and five nozzles (i.e., i = 2, 3, and 5) were all 13.2 m. The half dispersion widths were 1.9, 2.4, and 2 m, respectively. The nozzle system i = 3 showed the largest dispersion area, and the nozzle system i = 2 had the smallest distribution area. As shown in , when d = 160 mm and v = 71 mm/s, the dispersion lengths i = 3 and i = 5 were both 10.2 m, and the half dispersion widths were both 1.85 m. The dispersion areas at both nozzle systems were almost the same. As shown in , when d = 240 mm and v = 88 mm/s, the dispersion lengths at i = 3 and i = 5 were both 10.2 m. The half width at i = 3 was 2.1 m, and that of at i = 5 was 2 m. The distribution area of the nozzle system i = 3 was the largest. Therefore, the dispersion lengths were the same at the same distance d and pushing speed v. In addition, the half width and the distribution area of the nozzle system i = 3 were the largest.
Figure 8. Areas distribution with different nozzle systems at the same distance and pushing speed.
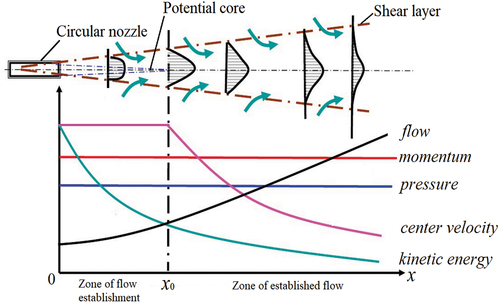
The parameters of a single free turbulent jet are shown in . The center velocity did not change in the zone of flow establishment, but the center velocity gradually decreased in the zone of established flow. The shear layers expanded to both sides, continuously introducing more static gas into the shear layer for momentum and mass exchange. With the increase of length, the velocity decreased, but the flow increased, that is, the momentum of the jet was a constant that did not change with the change of length. Although the mass was increased, it was not enough to offset the decrease of velocity, so the kinetic energy of free turbulent jet decreased with the increase of length.It could drop to zero as long as the distance was far enough (Liu Citation2008). Therefore, within 4–6 m from the spray gun, the shape of the dispersion area was the same as that of the single free turbulent jet, showing a V-shape. When the material was more than 6 m away from the spray gun, the shape of the dispersion area became a rectangle and the dispersion angle disappeared.The main reason was that the kinetic energy was reduced, and the gravity and buoyancy were not balanced, which makes the whole jet bend inward, but the whole jet can still be seen as symmetrical to the axis.
Figure 9. Parameter variation of free turbulent jet.
Influence of d on area distribution
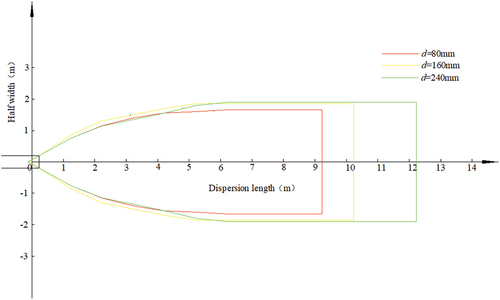
As shown in , when d = 80 mm, the dispersion length was 9.2 m and the half width was 1.65 m. When d = 160 mm, the dispersion length was 10.2 m and the half width was 1.65 m. When d = 240 mm, the dispersion length was 12.2 m and the half width was 1.9 m. The dispersion length and the half width increased with the increase in the distance d. The main reason was that the longer the distance d was, the longer the turbulent action time between the material and the gas was. The material produced particle separation under the high shear velocity of the gas. The particles accelerated along the exit edge under the dual actions of gas impinging acceleration and gas shearing acceleration.
Figure 10. Areas distribution with different distances at i = 3 and v = 71 mm/s.
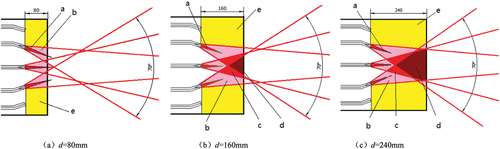
Multiple gas jets can not only increase the dispersion angle, but also increase the turbulent region. As shown in , the dispersion angle of single gas jet was 30° and the angle of ends of gas tubes 1, 2, 3 and 4 was 20°, so the dispersion angle of the two shear layers of multiple gas jets was 70°by graphical method.Area a was the potential core of a single nozzle. The potential core had the same flow velocity. The maximum flow velocity reached 100 m/s.The dispersion ability was the strongest.Area b was the dispersion area of a single nozzle. Area c was the overlapping collision area of two adjacent nozzles, where collision and mixing occurred. Area d was the overlapping collision area of three adjacent nozzles, where severe collision and mixing occurred. Area e was a dispersion blind area. Due to the arc of the spray gun and the self flow of the material, the material would converge in the middle and be dispersed by the nozzles. As shown in , after the material was dispersed and accelerated, there was no sliding distance and the material fell directly under the spray gun at d = 80 mm. At the same time, there was no overlapping collision area, indicating a poor dispersion effect. As shown in , although there was a relatively large overlapping collision area at d = 240 mm, the materials accumulated at the spray gun outlet, making the dispersion difficult. Moreover, there was an overlapping collision area and the material was not prone to accumulate in , therefore, the dispersion effect was good.
Figure 11. Gas jets at i = 3.
Influence of v on area distribution
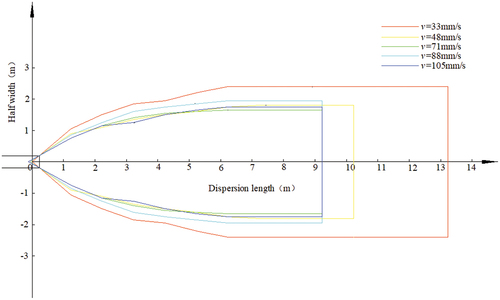
As shown in , when v = 33 mm/s, the dispersion length was 13.2 m and the half width was 2.4 m. when v = 48 mm/s, the dispersion length was 10.2 m and the half width was 1.8 m. when v = 71–105 mm/s, the dispersion lengths were all 9.2 m, and the half widths were 1.65–1.75 m. Therefore, it can be concluded that when the pushing speed was lower than 71 mm/s, as the pushing speed increased, the dispersion area gradually decreased. When the pushing speed was greater than 71 mm/s, the dispersion area was almost the same. The main reason was that the gas dispersion capacity has a limit value under the same gas jet pressure and flow velocity. When the pushing speed was lower than 71 mm/s, the higher the pushing speed, the greater the mass of materials to be dispersed, the worse the dispersion effect and the smaller the dispersion area. When the pushing speed was greater than 71 mm/s, the dispersion capacity had reached the limit value of the dispersion characteristic test system, so the dispersion area was almost the same.
Figure 12. Area distribution with different speeds at i = 3 and d = 80 mm.
Mass distribution
Influence of i on mass distribution
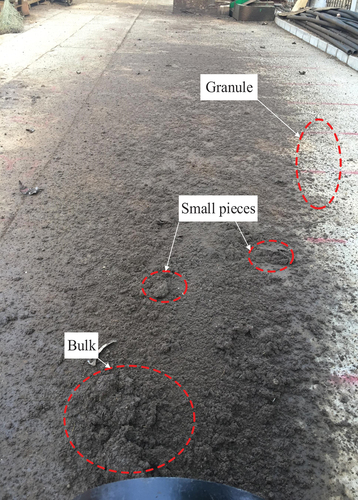
As shown in , when d = 80 mm, i = 2, v = 105 mm/s, the material flied out along the jet axis direction and the materials were separated. At the place 1 m away from the spray gun, there were bulk materials piled up, which are obviously not completely dispersed. At the place 2 m away from the spray gun, there were small pieces of materials with a particle size of 50 mm, and the particles on both shear layers were small.
Figure 13. Particle size at d = 80 mm, i = 2, v = 105 mm/s.
As shown in , when d = 80 mm and v = 33 mm/s, the mass of materials within 1 m of the spray gun when i = 2 was 36 kg, when i = 5 was 34.2 kg, when i = 3 was 27.9 kg, respectively. It can be concluded that the dispersion effect when i = 2 was the worst. The results were showed in . This was mainly because tube 5 was the main gas source for dispersion, and most of the materials were dispersed through the middle pipeline.
Figure 14. Mass distribution with different nozzle systems.
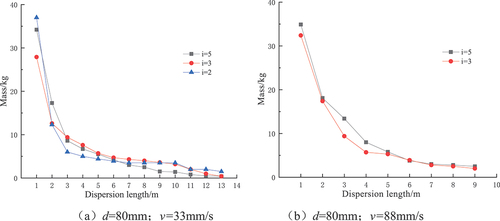
Figure 15. Mass distribution with different nozzle systems.
As shown in , when v = 88 mm/s, the mass distribution curves of i = 5 and i = 3 almost overlapped, indicating a similar dispersion effect. This was because the presence of both middle tubes and side tubes caused the materials to be evenly dispersed.
As shown in , the mass within 1 m of the spray gun was 30–40 kg, and 20 kg within 1–2 m of the spray gun. Therefore, the mass of materials within 2 m accounted for 50%–60% of the total mass of one pumping. In addition, the area within 2 m was relatively small, making the material distribution in this area relatively dense. The mass distribution outside the 2 m area accounted for about 50%. At the same time, the dispersion distribution area 2 m away was relatively large, the material distribution was thin, making the material easy to burn during the flying process.
As shown in , according to the particle size distribution, it can be divided into bulk area, dense atomization area and sparse atomization area. In bulk area,which was within 1 m of the spray gun, the material changed from plug to bulk after primary crushing under the action of potential core. After secondary crushing, the bulk was reduced to form dense atomization zone, and finally granular was formed in sparse atomization zone. Moerover, granular was on the shear layers (Batarseh et al. Citation2009; Mlkvik et al. Citation2015; Zürcher, Favrat, and Thome Citation2002).
Figure 16. Particle distribution.
Influence of d on mass distribution
As shown in , when i = 3, v = 48 mm/s, at 1 m in the bulk area, the mass was 31.4 kg when d = 80 mm, the mass was 19 kg when d = 160 mm, and the mass was 28.2 kg when d = 240 mm. The smaller the mass, the less the accumulation at the spray gun outlet, and the more the mass dispersed away from the spray gun. The result was as same as . It showed that d = 160 mm had the best dispersion effect.
Figure 17. Mass distribution at different distances.
Influence of v on mass distribution
As shown in , the higher the pushing speed, the bigger the mass within 1 m in the bulk area, the worse the mass distribution, and the shorter the dispersion length. Likewise, the lower the pushing speed, the better the mass distribution. This is because when the pushing speed was low, the material amount was relatively small. At a constant dispersion air pressure and flow velocity, the material with less mass could be easily dispersed, leading to large outlet acceleration and dispersion length.
Figure 18. Mass distribution at different pushing speeds.
Area density distribution
In this study, area density refers to the fraction of mass to area in the distribution area, which was used to characterize the distribution of materials. As shown in , the area density curve conforms to the distribution of power function. The maximum area density of the material was the largest within 1 m, indicating the densest distribution. With the increase in the dispersion length, the distribution area became larger, the dispersed material was less, and the area density gradually decreased, indicating sparse distribution. For the same i and d, as the speed increased, the area density curve gradually moved up within 1–3 m, indicating that the area density gradually increased and the material distribution gradually became denser, while the dispersion length gradually became shorter. The materials 2 m away from the spray gun account for about 50%. Due to the uniform distribution and small area density after being dispersed, the high-temperature air in the calciner can be fully burned during flight. For 50% of the materials within 2 meters from the spray gun, due to the large area density, the material accumulation was easy to cause insufficient combustion. In the follow-up study, multiple air cannons will be installed at the material accumulation under the spray gun for secondary dispersion.
Figure 19. Area density distribution at different speeds.
Conclusions
The mixtures with 30%, 35%, 40%, and 45% of sludge mass fraction were prepared respectively. The measured calorific value and chemical elements were studied, and their calorific values met the minimum allowable calorific value of 11 MJ/kg of hazardous waste as an alternative fuel. The slump test showed that the material with a sludge mass fraction of 35 40% had good fluidity.
The dispersion area distribution results showed that the dispersion angle was 70°. Within 4-6 m from the spray gun, the shape of the dispersion area was the same as that of the single free turbulent jet, showing a V-shape. When the material was more than 6 m away from the spray gun, the shape of the dispersion area became a rectangle.At the same distance and pushing speed, the dispersion lengths were the same. In addition, the half width and the distribution area of the nozzle system i = 3 were the largest.
The influences of different nozzle systems i, different distances d, and different pushing speeds v on the dispersion area distribution, mass distribution, and area density distribution were studied. The results showed that i = 3 produced the best dispersion effect, followed by i = 5, and then i = 2. In addition, the effect of d = 160 mm was the best, followed by d = 240 mm, and then d = 80 mm. As the pushing speed increased, the dispersion effect gradually worsened. The material that was 2 m away from the spray gun accounted for about 50% of the total.
3.0dispersion_characteristic.avi
Download Microsoft Video (AVI) (14.3 MB)Disclosure statement
No potential conflict of interest was reported by the author(s).
Data availability statement
The data that support the findings of this study are available from the corresponding author upon reasonable request.
Supplementary material
Supplemental data for this article can be accessed online at https://doi.org/10.1080/10962247.2022.2141918
Additional information
Funding
Notes on contributors
Guangming Guo
Guangming Guo is a doctoral student in the school of mechanical electronic & information engineering. He began his research in 2017. His current research focuses on pipeline transportation of hazardous wastes.
Xiaowen Zheng
Xiaowen Zheng is a professor in the school of mechanical electronic & information engineering. Her Ph.D. degree received in mechanical design and theory in 2005. Her current research focuses on the modern mechanical design method and its application.
Miao Wu
Miao Wu is a professor in the school of mechanical electronic & information engineering. His Ph.D. degree received in mechanical design and theory in 1992. His current research focused on pipeline transportation, disposal and utilization of high concentration viscous materials.
References
- Batarseh, F. Z., M. Gnirb, I.V. Roisman, and C. Tropea. 2009. Fluctuations of a spray generated by an air blast atomizer. Exp. Fluids 46 (6):1081–91. doi:10.1007/s00348-009-0612-y.
- Brunner, C. R. 1993. Handbook of hazardous wastes incineration. second ed. New York: McGraw-Hill.
- Chu, Y., Y. Gao, and Z. Ye. 2021. Study on the spraying application in hazardous waste incineration system. Shandong Chem. Ind. 50 (4):267–69.
- Cudahy, J. 1999. Review of commercial innovative technologies for hazardous waste. Environ. Prog. 18 (4):285–92. doi:10.1002/ep.670180416.
- David, A. T. 1990. Rotary incineration systems for solid hazardous wastes. Chem. Eng. Prog. 86 (7):19–30.
- Dong, Z. 1997. Impact jet. Beijing: Ocean Press.
- Dzuy, N. Q., and D. V. Boger. 1985. Direct yield stress measurement with the vane method. J. Rheol. 29 (3):335–47. doi:10.1122/1.549794.
- Fan, H., Z. Li, B. Li, Li, L., Shang, S., and Wang, J. 2022. Numerical investigation of gas-assisted sludge atomization and breakup based on VOF-DPM coupled model. Chin. J. Process Eng. 22 (3):1–10.
- Fu, S., H. Ma, Z. Wu, Yang, C., and Zhang, B. 2021. Test study on spray characteristics of RP-3 aviation kerosene at low temperature. Aeroengine 47 (6):26–31.
- Gong, S., F. He, K. Liu, and X. Long. 2015. Parameter characteristics of using the high-speed air jet to impact granular material layer. J. Mech. Eng. 51 (15):142–47. doi:10.3901/JME.2015.15.142.
- Gong, S., X. Long, F. He, K. Liu, and F. He. 2016. Experiment study of high pressure air micro-pore jet’s broken dispersion effect on bulk powder. Mech. Sci. Technol. Aerosp. Eng. 35 (5):790–94.
- Guangming, G. 2018. The feeding system for the incineration of hazardous waste in rotary kiln. 2018 National Academic Annual Conference Papers Collection, Beijing. Vol. II, 5.
- Guangming, G., Z. Xiaowen, and P. J. Charnay. 2018. Development of the solid pump for transporting hazardous wastes in pipelines. Hoisting Conveying Mach. (10):101–3+133.
- Guangming, G., Z. Yan, Z. Xiaowen, W. Miao, and J. C. Pierre. 2019. A pipeline transportation pressure monitoring and warning system for hazardous waste and its performance analysis. Environ. Eng. 37 (6):136–40.
- Hartenstein, H.-U., and M. Horvay. 1996. Overview of municipal waste incineration industry in west Europe(based on the German experience). J. Hazard. Mater. 47 (1–3):19–30. doi:10.1016/0304-3894(95)00124-7.
- Jakobs, T., N. Djordjevic, S. Fleck, Mancini, M., Weber, R., and Kolb, T. 2012. Gasification of high viscous slurry R&D on atomization and numerical simulation. Appl. Energy 93: 449–56. doi:10.1016/j.apenergy.2011.12.026.
- Lefebver, A. H. 1989. Atomization and spray. New York: Hemisphere publishing corporation.
- Li, S., M. Li, G. Liu, and Huang, Y. 2007. Numerical simulation on the penetration depth in water of round impinging jet. Metall. Equip. 20 (1):25–28.
- Lin, H., Y. Cai, and D. Liu. 2017. Comparison on spray characteristics of nozzles used for sludge drying. Ind. Boilers 42 (3):15–19.
- Liu, P. 2008. Jet theory of free turbulent. Beijing: Beijing University of Aeronautics and Astronautics Press.
- Liu, Y., C. Chen, J. Wei, and Zhang, J. 2018a. Comparison analysis on the rock breakage pressure induced by abrasive water jets and abrasive gas jets. J. China Coal Soc. 43 (9):2510–17. doi:10.13225/j.cnki.jccs.2017.1770.
- Liu, C., L. He, and E. Guan. 2022. Study of atomization law of gas-liquid two-phase l=flow based on Laval tube. J. Dalian Univ. Technol. 62 (2):179–87.
- Liu, Y., J. Wei, D. Wang, and Liu, X. 2018b. Erosive wear characteristic of rock impacted by abrasive gas jet. J. China Coal Soc. 43 (11):3033–41. doi:10.13225/j.cnki.jccs.2017.1770.
- Liu, Y., T. Zhang, J. Wei, and Liang, B. 2017. Research on influence of abrasive shape on erosion performance of abrasive gas jet. J. Saf. Sci. Technol. 13 (11):117–22.
- Mlkvik, M., P. StaHle, H. P. Schuchmann, V. Gaukel, J. Jedelsky, and M. Jicha. 2015. Twin-fluid atomization of viscous liquids: The effect o atomizer construction on breakup process, spray stability and droplet size. Int. J. Multiphase Flow 77 (6):19–31. doi:10.1016/j.ijmultiphaseflow.2015.06.010.
- Shen, H., A. Wu, L. Jiang, Wang, Y., Jiao, H., and Liu, X. 2016. Small cylindrical slump test for unclassified tailing paste. J. Cent. S. Univ. Sci. Technol. 47 (1):204–09.
- Singh, J., D. Croce, L. E. Zerpa, Partington, B., and Gamboa, J. 2019. Experimental evaluation of nozzles to mitigate liquid loading in gas wells. J. Nat. Gas Sci. Eng. 65:248–56.
- Sun, Y., L. Zhou, X. Gong, Zhang, P., and Hao, R. 2022. Numerical simulation of close-coupled annular nozzle atomization process in vacuum induction. Mater. Mech. Eng. 46 (4):75–81.
- Tian, S., and Z. Gao. 2009. Improved design of airflow distribution chamber in air-impingement oven based on fluent. Mod. Food Sci. Technol. 25 (6):612–16.
- Wu, A., H. Chen, Y. Wang, Wang, H., and Liu, X. 2016. Transport resistance characteristic of paste pipeline considering effect of wall slip. Chin. J. Nonferrous Met. 26 (1):180–87.
- Wu, A., H. Jiao, H. Wang, Li, H., Yi, H., Liu, X., and Liu, S. 2013. Yield stress measurements and optimization of paste tailings. J. Cent S. Univ. (Sci. Technol.) 44 (8):3370–76.
- Wu, A., X. Liu, H. Wang, Wang, Y., Jiao, H., and Liu, S. 2014. Resistance characteristics of structure fluid back filling slurry in pipeline transport. J. Cent S. Univ. (Sci. Technol.) 45 (12):4325–30.
- Zhang, W., Y. Yu, and Z. Zhang. 2013. Study on atomized oil sludge burning in pulverized coal boilers. Chem. Eng. Mach. 40 (3):311–5+326.
- Zhou, Z., J. Yin, S. Shi, and Hong, G. 2019. Numerical and experimental study on vertical cutting of hard clay by high pressure water jet under submerged condition. Port Waterw. Eng. 554 (4):1–6.
- Zürcher, O., D. Favrat, and J. R. Thome. 2002. Development of a diabatic two-phase flow pattern map for horizontal flow boiling. Int. J. Heat Mass Transf. 45 (2):291–301. doi:10.1016/S0017-9310(01)00146-6.