
 ?Mathematical formulae have been encoded as MathML and are displayed in this HTML version using MathJax in order to improve their display. Uncheck the box to turn MathJax off. This feature requires Javascript. Click on a formula to zoom.
ABSTRACT
Ambient particulate matter (PM2.5) is an important component of natural and human-generated air pollution and a major contributor to the global burden of disease. Short-term effects of PM2.5 exposure on respiratory illness have been described but most evidence arises from high pollution settings. We used case-crossover methods to estimate effects of outdoor PM2.5 levels on emergency department (ED) presentations and hospital admissions for a range of acute respiratory illnesses and age groups in Melbourne, Australia from 2014–2019, with and without adjustment for other pollutants and weather conditions, using daily and one-week averaged lags. We estimated incidence rate ratios for a 10 μg/m3 increase in 7-day average ambient PM2.5 of 1.043 (95% confidence interval (CI): 1.000–1.089) on ED presentation and 1.013 (95% CI: 0.971–1.056) on hospital admissions for acute respiratory illnesses for patients of any age. We observed distinct temporal patterns in daily lag effect by disease. The largest effects on acute lower respiratory tract infection and asthma were observed in children. Ambient PM2.5 levels rarely exceeded standards in place at the time. Although uncertainty around most point estimates was relatively wide, these findings are most compatible with adverse health effects of ambient PM2.5 at levels below currently established Australian national standards.Implications: Understanding the health impacts of air pollution is important for setting air quality targets, as well as for informing robust health system planning. Adverse effects of exposure to outdoor fine particulate matter on human respiratory health have been consistently described. However, most studies have been done in higher-pollution settings. Further, many studies have assessed health effects in broad categories such as all-cause respiratory mortality or hospitalization, and thus lack the granularity to inform detailed health service planning. Our study aimed to estimate effects of outdoor fine particulate matter on emergency department (ED) presentations and hospital admissions for a range of acute respiratory illnesses and age groups in Melbourne, Australia, a city with relatively good air quality by international comparison. Our study estimated consistent effects on both ED presentations and hospital admissions compatible with distinct patterns of adverse health effects at levels at or below established Australian national (and many international) standards. These results will help to inform both air quality policy and public health policy in similar settings.
Background
The World Health Organization (WHO) considers air pollution the most serious environmental risk to human health, through its contribution to the burden of stroke, ischemic heart disease, chronic obstructive pulmonary disease (COPD), lung cancer, and acute respiratory illnesses (World Health Organization Citation2016). Particulate matter 2.5 microns in diameter or smaller (PM2.5) is an important component of outdoor air pollution and is estimated to have been responsible for 4.2 million deaths worldwide in 2015 (Cohen et al. Citation2017). In September 2021, WHO issued new global air quality guidelines to replace those previously updated in 2005 (World Health Organization Citation2021). Changes to PM2.5 targets were motivated by accumulating evidence for effects on mortality at lower concentrations than previously recognized (Orellano et al. Citation2020; World Health Organization Citation2021). Under the new guidelines, targets for ambient PM2.5 were reduced from an annual mean of 10 μg/m3 to 5 μg/m3, and a maximum 24-hour mean of 25 μg/m3 to 15 μg/m3 (World Health Organization Citation2006, Citation2021).
In addition to mortality effects, numerous epidemiological studies have demonstrated short-term relationships between ambient PM2.5 and healthcare encounters for respiratory diseases (Orellano et al. Citation2017; Walter et al. Citation2021; Yee et al. Citation2021; Zheng et al. Citation2015). Mechanisms by which exposure to elevated PM2.5 might lead to acute respiratory illness include induction of bronchial hyperreactivity, acute pro-inflammatory effects, direct cytotoxicity, pathogen transfer via particulate matter, and effects on individual behavior which in turn might increase exposure to respiratory viruses, for example through causing people to spend more time together indoors (Brugha and Grigg Citation2014; Manisalidis et al. Citation2020; Vargas Buonfiglio and Comellas Citation2020).
In Australia, average annual ambient PM2.5 concentrations are lower than in much of the rest of the world (Shaddick et al. Citation2020). However, since 2009 levels have increased in most capital cities, and none have attained a substantial reduction (Emmerson and Keywood Citation2021). Despite relatively low levels of exposure, about 2% of deaths in Australia are attributable to anthropogenic ambient PM2.5 (Hanigan et al. Citation2020). Air pollution attributable deaths in Australia are mainly due to coronary heart disease (Australian Institute of Health and Welfare Citation2021). Australia’s current national air quality standards allow for ambient PM2.5 concentrations up to an annual mean of 8 μg/m3 and 24 hour mean of 25 μg/m3, with exemptions to the 24-hour standard allowed when the exceedance is directly related to bushfires, hazard-reduction burning or dust storms (National Environment Protection (Ambient Air Quality) Measure Citation2011). In 2025 the 24-hour standard for PM2.5 will be reduced to 20 μg/m3, although the 2021 State of the Environment report hints at pessimism that this new standard will be consistently achieved (Emmerson and Keywood Citation2021).
Despite a recognition among scientists that there is no known “safe” level of PM2.5 exposure (World Health Organization Citation2016), public perception of air pollution risk is often linked to immediate harm experienced as a result of extreme pollution events (Cori, Donzelli, and Gorini Citation2020), including extreme bushfires. This may in part be due to public reporting of air quality in terms of value-based categories such as “good” or “poor” (Environmental Protection Authority Victoria Citation2021). Although much attention has been given to the impacts of air pollution during extreme fire events, an individual’s typical PM2.5 exposure is far more likely to be at routine air pollution levels rather than the very high concentrations seen during air pollution events. Therefore, understanding the full morbidity impacts of lower-level exposures is still highly relevant.
Approximately half of published Australian studies on the short-term effects of ambient PM2.5 on respiratory ED presentations or hospital admissions have focussed primarily on effects related to bushfire or dust-storm events (Barnett, Fraser, and Munck Citation2012; Haikerwal et al. Citation2016; Johnston et al. Citation2014; Martin et al. Citation2013; Merrifield et al. Citation2013). Of the remainder, most have either provided inconclusive findings (Hansen et al. Citation2012; Hinwood et al. Citation2006), included suboptimal control for confounding through effects of other pollutants (Jalaludin et al. Citation2008), or studied only children (Barnett et al. Citation2005). Chen et al. described effects of increased PM2.5 concentrations on increased asthma hospitalizations in Adelaide, which were larger in children, but did not analyze emergency department (ED) presentations or other acute respiratory conditions (Chen et al. Citation2016). Studies conducted in Melbourne have focussed mainly on cardiovascular outcomes (Barnett et al. Citation2006; Dennekamp et al. Citation2015).
In setting new ambient PM2.5 targets based on short-term respiratory effects, WHO considered only impacts on mortality (Orellano et al. Citation2020; World Health Organization Citation2021). Assessments of impact based on mortality do not consider the total health system burden, because deaths are far outnumbered by healthcare encounters that end in discharge (Samek Citation2016). Further, most studies examining healthcare utilization have focussed on cities in the northern hemisphere, and there is evidence for region-specific effects (Atkinson et al. Citation2014; Zhu et al. Citation2020). We used case-crossover methods to estimate the short-term effects of ambient PM2.5 exposure on both ED presentations and hospital admissions for acute respiratory illness in Melbourne, Australia, between 2014 and 2019.
Methods
Target population and setting
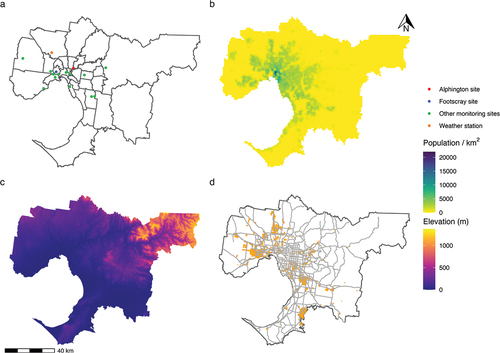
We chose the population and setting based largely on the availability of air monitoring data in Victoria. Because there is a relatively higher concentration of regulatory monitoring stations measuring PM2.5 in Melbourne compared to regional Victoria (Environment Protection Authority Victoria Citation2018), we limited our analysis to metropolitan Melbourne, an area with an estimated population of 5,079,123 residents as of 2019 (Australian Bureau of Statistics Citation2021), spanning approximately 9990 km2 (City of Melbourne Citation2021), and divided into 31 local government areas (LGAs) (). All but three LGAs fell on or above the fourth quintile for the Index of Relative Socio-economic Disadvantage at the 2016 Australian Census of Population and Housing, indicating lower than average socioeconomic disadvantage compared to other Australian LGAs (Australian Bureau of Statistics Citation2018). In Melbourne, ambient PM2.5 arises mainly from motor vehicles, wood burning (including for domestic wood heaters, land burning, and bushfires), industry, and natural sources such as dust and sea salt (Environment Protection Authority Victoria Citation2018). Exceedances of PM2.5 standards are usually attributed to either a combination of woodfire smoke and vehicular and industrial pollution during winter months, or smoke from bushfires and/or planned burns (Environment Protection Authority Victoria Citation2018). We chose a study period of 2014–2019 inclusive (2,191 days), based on relative availability of complete air monitoring data, including data on PM2.5.
Figure 1. Metropolitan Melbourne. (a) local government area (LGA) borders, location of monitoring sites and weather station used in analysis; (b) population density; (c) elevation; (d) industrial zoned areas (orange) and major roads (freeways, highways, and arterial roads; gray lines).
Data sources
Healthcare encounters for acute respiratory illness
From the Victorian Department of Health, we requested data on inpatient admissions to public and private hospitals (Victorian Department of Health Citation2020), and ED presentations to public hospitals (Victorian Department of Health Citation2020), for all episodes in 2014–2019 where the patient resided within metropolitan Melbourne, and a primary diagnosis consistent with acute respiratory illness was recorded. We received data in the form of daily counts aggregated by event type (ED presentation or hospital admission) and residential LGA, as well as prespecified diagnosis and age groups. Events were classified into the following diagnosis groups based on the International Statistical Classification of Diseases and Health Related Problems, 10th revision, Australian Modification (ICD-10-AM) primary diagnosis codes: acute upper respiratory infection (AURI), acute lower respiratory infection (ALRI), and asthma/COPD. A list of codes included in each group is included as supplementary material. Patient age was aggregated into the categories: 7 days − 4 years, 5–17 years, and 18 years or older; reflecting age-based changes in respiratory physiology (Quanjer et al. Citation2012) and varying paradigms for establishing an asthma diagnosis in children below versus above the age of 5 years (Yang, Gaffin, and Radhakrishnan Citation2019).
Exposure data
We obtained publicly available air monitoring data from the Environmental Protection Authority Victoria for 16 monitoring stations located within metropolitan Melbourne (Environment Protection Authority Victoria Citation2020). We obtained hourly measurements of ambient PM2.5, as well as other ambient pollutants which might confound the effect of PM2.5 exposure on respiratory health outcomes, due to their shared sources and independent effects on human health (Manisalidis et al. Citation2020). These included particulate matter less than or equal to 10 microns in diameter (PM10), ozone (O3), carbon monoxide (CO), sulfur dioxide (SO2), and nitrogen dioxide (NO2). Meteorological conditions, including temperature and relative humidity, may affect concentrations of airborne pollutants (Liu, Zhou, and Lu Citation2020), as well as incidence of acute respiratory illness (Mäkinen et al. Citation2009), and may therefore confound the effect of PM2.5 on healthcare encounter. We obtained hourly measures of dry bulb (Tdb) and dew point (Tdp) temperatures at Melbourne Airport from the Australian Bureau of Meteorology (Bureau of Meteorology Citation2021). We calculated 24 hour means (midnight to midnight) for each set of hourly measures.
Exposure assignment
Pollutant data were most complete for two long-term ambient monitoring sites at located 14.2 km apart at Alphington and Footscray. We therefore limited the analysis to data from these two sites. Most other stations collected data on a limited set of pollutants and/or were temporary monitors set up in response to local pollution concerns (Environment Protection Authority Victoria Citation2018). For the primary analysis, we assigned pollutant exposure for each event based on the station closest to the centroid of the patient’s residential LGA. We explored alternative exposure assignments in sensitivity analyses.
Handling of missing exposure data
In the original dataset, 9% of hourly measurements for the Alphington site and 25% for the Footscray site were missing. Handling of missing data by calculating 24 hour means for periods with a minimum proportion of non-missing data (e.g. 75% complete), followed by list-wise deletion, would have resulted in a substantial proportion of observations being dropped from the analysis. Instead, we used multiple imputation by chained equations, implemented in the “mice” package in R (van Buuren Citation2011), to impute missing hourly data for all independent variables based on available data from all 16 air quality monitoring sites and the weather station. We pooled estimates from analyses performed on 10 imputed datasets to incorporate uncertainty associated with imputed observations into the final parameter estimates (van Buuren Citation2011).
Study design
We used a time-stratified case-crossover design commonly applied to studies of the short-term effects of environmental exposures (Horne et al. Citation2018; Janes, Sheppard, and Lumley Citation2005; Pirozzi et al. Citation2018; Tecer et al. Citation2008). In this design, each day is matched to several referent, or control days within the same stratum (Janes, Sheppard, and Lumley Citation2005). We selected referent dates as the three or four dates in the same month and year that shared the same weekday with each event date. This design offers some advantages over a time-series analysis in the form of intrinsic adjustment for time-invariant confounding through individual factors such as age and comorbid conditions, as well as control for long-term trends in exposure and outcome (Fung et al. Citation2003; Janes, Sheppard, and Lumley Citation2005), but at the cost of reduced statistical precision (Fung et al. Citation2003). It relies on the assumption that the outcome of interest is rare at the individual level, i.e. that the same individual does not experience multiple events during the period for referent selection.
Statistical analysis
We assessed outcomes separately for each event type, noting that while most admissions begin with an ED presentation, they represent a narrower spectrum of more severe disease outcomes that may be of separate interest to policy makers. For each event type, we estimated an overall effect as well as subgroup effects defined by all combinations of diagnosis and age group strata.
Our primary analysis included a term for mean PM2.5 concentration, and adjusted for all pollutant (PM10, O3, CO, SO2, NO2) and weather covariates (Tdb, Tdp). We considered lags of between 0 and 6 days, with PM2.5 and covariate concentrations averaged over the same 24-hour period, as well as a model with all explanatory variables averaged across one week from days 0–6. Under the conditional quasi-Poisson model, the number of events on day in stratum
,
, conditional on the sum of events in each stratum,
, is given by (Armstrong, Gasparrini, and Tobias Citation2014):
Where other days in the same stratum are denoted by , and
is the transposed vector of model parameters to be estimated.
is a vector of variables corresponding to day
, in this case the exposure and covariate measures for the corresponding lag.
We ran separate conditional quasi-Poisson models for each subgroup and lag, using the “gnm” package (Turner and Firth Citation2020) in R version 3.6.1. Analysis using the conditional quasi-Poisson model provides more robust uncertainty estimates in the presence of overdispersed count data compared with the conditional logistic regression model traditionally applied to case-crossover studies (Armstrong, Gasparrini, and Tobias Citation2014). We excluded one highly influential outlier count from the regression models arising from an extreme thunderstorm asthma event in November 2016 (Thien et al. Citation2018). We expressed results of the analysis in the form of incidence rate ratio (IRRs), obtained by taking the exponent of estimated model coefficients for a 10 μg/m3 increase in PM2.5.
Sensitivity analyses
We conducted sensitivity analyses for the method of exposure assignment, including restricting analysis to only those events where the patient lived in an LGA less than 10 km from the Alphington or Footscray sites, as well as assigning exposure for all events from the site with the highest proportion of complete data (Alphington). We also conducted analyses examining the effects of removing from the models all pollutant covariates, all weather covariates, or both sets. Because ambient pollen exposure has been suggested to confound the effects of pollutants on respiratory illness (Gleason, Bielory, and Fagliano Citation2014; Goodman et al. Citation2017; Osborne et al. Citation2017), we conducted a sensitivity analysis by excluding all events occurring between 1 October and 31 January, months when outdoor grass pollen levels are elevated in Melbourne (Beggs et al. Citation2015).
Ethics approval
The study protocol was approved by the Australian National University Science and Medical Delegated Ethics Review Committee (protocol 2021/076).
Results
The average median 24 hour mean concentrations of PM2.5 over the study period were 6.9 μg/m3 at the Alphington site and 6.7 μg/m3 at the Footscray site (). Yearly mean PM2.5 concentrations remained below the 2005 WHO guideline (World Health Organization Citation2006) for an upper limit annual mean of 10 μg/m3, but above the 2021 WHO guideline (World Health Organization Citation2021) level of 5 μg/m3 in every year at both sites. At the Alphington site, the 2005 guideline for an upper limit 25 μg/m3 24-hour mean PM2.5 was exceeded on a median of 5 days per year (range: 4–9 days), and the 2021 24 hour-hour mean limit of 15 μg/m3 was exceeded on a median of 26 days per year (range: 21–41 days). There were no obvious long-term trends in concentrations of PM2.5, other pollutants, or weather variables across the study period ().
Table 1. Summary of original and imputed hourly pollutant measurements for the Alphington and Footscray monitoring sites, 2014–2019.
Table 2. Summary of original and imputed hourly meteorological measurements for the Melbourne airport weather station, 2014–2019.
Overall, ED presentations with a primary diagnosis classified as ALRI (n = 184,205) were more common than those classified as AURI (n = 164,365), or asthma/COPD (n = 121,714; ). Patterns differed by age group, with AURI being the most common classification for individuals aged <18 years. ALRI was the most common classification for hospital admission overall (n = 207,671), followed by asthma/COPD (n = 148,187), and AURI (n = 61,258), but asthma was the most common primary diagnosis for the 5–17 year age group.
Table 3. Recorded emergency department presentations and hospital admissions for acute upper respiratory infection (AURI), acute lower respiratory infection (ALRI), and asthma or chronic obstructive pulmonary disease (COPD), for residents of metropolitan Melbourne 2014–2019, by age.
Our analysis was consistently most compatible with positive short-term effects of elevated ambient PM2.5 on both ED presentations (day 0–6 lag; IRR: 1.043, 95% confidence interval (CI): 1.000–1.089) and hospital admissions (day 0–6 lag; IRR: 1.013, 95% CI: 0.971–1.056) for acute respiratory illness (). For ED presentations, IRR estimates from all daily lag models were >1, and were highest for the day 4 lag (IRR: 1.022, 95% CI: 1.001–1.044). For admissions, all estimates were >1 except for the day 0 and day 5 lag models, although all 95% CIs crossed the null except for in the day 0 lag model (IRR: 0.979, 95% CI: 0.959–0.999).
Figure 2. Incidence rate ratios for the estimated short-term effects of for a 10 µg/m3 increase in ambient PM2.5 concentration on emergency department (ED) presentations and hospital admissions for acute respiratory illnesses. Lags refer to the number of days from exposure/covariate measurement to outcome. Lag “Days 0-6” refers to the effect of exposures averaged across days 0–6 prior to outcome measurement. AURI: acute upper respiratory infection, ALRI: acute lower respiratory infection, COPD: chronic obstructive pulmonary disease. Vertical lines represent 95% confidence intervals.
For asthma/COPD, the largest effects were estimated for the day 4 lag for both ED presentations (IRR: 1.045, 95% CI: 1.008–1.084), and admissions (IRR: 1.034, 95% CI: 1.004–1.065). Larger effects were estimated in the 7 days − 4 years and 5–17 years groups (). For ALRI, larger estimates generally arose from longer lag models, with the largest daily effects estimated for the day 6 lag for both ED presentations (IRR: 1.030, 95% CI: 1.001–1.059), and admissions (IRR: 1.034, 95% CI: 1.007–1.062). The largest effects on ALRI events were estimated for the 7 days − 4 years group. Day 0 lag ALRI models produced estimates <1 (ED presentations: IRR: 0.980, 95% CI: 0.953–1.008. Admissions: IRR: 0.979, 95% CI: 0.954–1.005).
Figure 3. Incidence rate ratios for the estimated short-term effects of for a 10 µg/m3 increase in ambient PM2.5 concentration on emergency department (ED) presentations and hospital admissions for acute respiratory illnesses by age group. Lags refer to the number of days from exposure/covariate measurement to outcome. Lag “Days 0-6” refers to the effect of exposures averaged across days 0–6 prior to outcome measurement. AURI: acute upper respiratory infection, ALRI: acute lower respiratory infection, COPD: chronic obstructive pulmonary disease. Vertical lines represent 95% confidence intervals.
For AURI, IRR estimates for the effect of elevated ambient PM2.5 were >1 for ED presentations (0–6 day IRR: 1.037, 95% CI: 0.973–1.104), but <1 for admissions (0–6 day IRR: 0.910, 95% CI: 0.832–0.995). There were no clear patterns in AURI age effects or trends in daily lag estimates.
Altering the method of exposure assignment had only small and inconsistent effects on model point estimates (Supplementary figure S3). Estimates obtained from models excluding weather covariates were similar to those from the primary analysis; however, exclusion of pollutant covariates typically led to substantially higher IRR estimates (Supplementary figure S4). Excluding pollen-season months from the analysis led to similar or slightly higher estimates (Supplementary figure S5).
Discussion
Our results provide further evidence for short-term exposures of ambient PM2.5 increasing the overall number of healthcare events for acute respiratory illness, including both increased ED presentations and hospital admissions for ALRI and asthma/COPD, as well as on increased ED presentations but not hospital admissions for AURI across the age range. Larger effects were generally observed among children compared with adults aged 18 years or older. Confidence intervals for the primary analysis were wide, generally including an IRR of 1, but taken together with previous research on respiratory healthcare encounters (Atkinson et al. Citation2014; Orellano et al. Citation2017; Zhu et al. Citation2020) and other respiratory outcomes (Liu et al. Citation2017; Lu et al. Citation2015; Orellano et al. Citation2020), our findings provide further support that relatively low-level exposures to ambient PM2.5 increase healthcare utilization for acute respiratory illnesses. We provide additional evidence on how these effects might differ across age groups and impact hospital use in a city with generally low levels of outdoor air pollution.
Meta-analyses of time-series and case-crossover studies on short-term effects of ambient PM2.5 on respiratory healthcare events have produced relatively consistent estimates, with 1–3% increased risk associated with a 10 μg/m3 increase in 24-hour PM2.5 for hospitalizations (Atkinson et al. Citation2014), COPD-specific admissions (Zhu et al. Citation2020), ED presentations or hospitalisations (Orellano et al. Citation2017), pneumonia admissions (Yee et al. Citation2021), and asthma ED visits and hospitalisations (Zheng et al. Citation2015). Walter et al. (Walter et al. Citation2021) published a recent systematic review of 72 epidemiologic air pollution studies conducted in Australia up to January 2019, however did not undertake a meta-analysis due to significant heterogeneity in design and reporting. Ten of the included studies examined effects of PM2.5 on respiratory ED presentations, admissions, or mortality, three of which studied only children, and five of which focussed on bushfire or dust storm events. Most describing positive effects which were generally largest for 0–1 day lags (Walter et al. Citation2021).
In contrast, we observed distinct lag patterns peaking on day 4 for asthma/COPD and day 6 for ALRI. These differences could reflect distinct primary short-term pathogenic mechanisms of PM2.5, for example induction of bronchial hyperreactivity for asthma and increased susceptibility to infection for ALRI. For ALRI and asthma/COPD presentation and admissions we observed the lowest IRRs, at or slightly less than 1, for the day 0 lag. These findings are consistent with reduced cumulative exposure to outdoor air pollution on the event day, either because of events occurring early in the day, or for admissions, because of a substantial proportion of the event day is spent in air-conditioned hospital environment. In Melbourne, day-to-day elevations in ambient PM2.5 typically peak around midday if resulting from planned burns, or in the evening if arising from domestic wood heaters (Environment Protection Authority Victoria Citation2018). Most of the proposed mechanisms for the respiratory effects of PM2.5 are most consistent with at least 1–2 days between exposure and the need for hospital admission (Brugha and Grigg Citation2014; Manisalidis et al. Citation2020; Vargas Buonfiglio and Comellas Citation2020). However larger effects for lags of 0–1 days are often reported for extreme pollution events, such as bushfires (Martin et al. Citation2013). This may be related to higher doses of particulate matter received in extreme events, or synergistic effects with other pollutants. There has been significant heterogeneity in lag selection strategies for air pollution case-crossover studies (Orellano et al. Citation2017). An agreed standardized approach to lag specification might reduce the potential for selective reporting of “statistically significant” outcomes and simplify the process of meta-analysis.
In our study, effects on ALRI and asthma were generally larger among children. Childhood exposure to air pollution has been associated with long-term reductions in lung function (Tham et al. Citation2019), impaired neurological development (Sunyer Citation2008), and a trend toward increased mortality (Hanigan et al. Citation2019). Worryingly, the full scale of long-term sequelae of childhood exposure to ambient air pollution remains unknown due to the challenges inherent in linking early life exposures to effects that might not become apparent until late adulthood, such as heart disease, stroke, or malignancy (World Health Organization Citation2016).
We observed a negative effect of ambient PM2.5 on hospital admissions for AURI but not on ED presentations. Such effects are is biologically unlikely and previous studies have reported positive associations between PM2.5 and upper respiratory symptoms (Ratajczak and Badyda Citation2021). In our sensitivity analysis excluding pollutant covariates, AURI admission IRRs were centered around the null (Supplementary Figure S4). It may be that other pollutants have greater effects on the upper airways. If this is the case then in patients suffering from both upper and lower respiratory disease induced by pollution, higher levels of PM2.5 may act to shift admission diagnoses toward lower respiratory pathologies, and therefore away from AURI, due to predominant PM2.5 effects on the lower airways (Manisalidis et al. Citation2020). We observed the largest negative effects in children (), an age group more likely to require admission for upper respiratory infection but also more vulnerable to effects of PM2.5 on the lower airways (World Health Organization Citation2021).
Bushfires can cause massive spikes in ambient PM2.5 and other pollutants, resulting in significant short-term increases in morbidity and mortality (Borchers Arriagada et al. Citation2020; Vardoulakis et al. Citation2020). Such events rightly attract public and media attention due to obvious changes in perceptible air quality (Cockburn Citation2019). The reduction in air quality in Melbourne in January 2020 as a result of the 2019–20 bushfire season far outstrips anything recorded over the period of our study, with the 24-hour average PM2.5 concentration reaching 233.6 µg/m3 (Woodley Citation2020). However, the important effects of routine lower-level exposures may be underappreciated by some policy makers and members of the public due to lack of obvious (to human sensory perception) change in air quality. This problem might be compounded by value-laden reporting of air quality levels that imply “safe” levels of exposure (Emmerson and Keywood Citation2021; Zosky et al. Citation2021).
Limitations of our study include the lack of data on primary health care presentations and reliance on coding data. We did not have data for a separate elderly age group, and were unable to fractionally attribute ambient PM2.5 to particular sources. Some degree of exposure measurement error will have occurred as a result of using pollution and weather data from fixed sites to infer individual exposure, along with reliance on recorded residential address (Sheppard et al. Citation2012). This could be partly addressed by the use of more sophisticated location-based models of exposure (Hanigan et al. Citation2019). However, availability of adequate hourly PM2.5 data over the study period was limited to a few closely clustered sites, and sensitivity analyses using alternative exposure assignment methods resulted in only small changes to our estimates.
The validity of our effect estimates depends on the compatibility of our implicit causal and explicit statistical models with reality. In particular, residual confounding remains a concern in studies of environmental exposures (Fewell, Davey Smith, and Sterne Citation2007). Our primary analysis controlled for all major ambient pollutants known to have short-term effects on respiratory health (Manisalidis et al. Citation2020), using concentrations averaged over the same period as the PM2.5 exposure. Confidently untangling the contribution of individual ambient pollutants is challenging due to the potential for synergistic effects, and differences in timing of short-term effects between pollutants (Manisalidis et al. Citation2020). Further, our analysis did not consider other meteorological variables such as air pressure, wind speed, sunshine or rainfall that may contribute to determining of asthma exacerbations (Hu et al. Citation2020; Huang et al. Citation2022). Grass pollen exposure is associated with asthma hospitalization in Australian children (Shrestha, Lambert, and Erbas Citation2021), and several studies have suggested that pollen exposure might weakly confound the effects of PM2.5 on asthma (Gleason, Bielory, and Fagliano Citation2014; Goodman et al. Citation2017; Osborne et al. Citation2017). In our setting, year-round pollen monitoring data were not readily available. However, sensitivity analysis excluding events occurring during the pollen season did not result in substantially different estimates (Supplementary figure S5), indicating that such confounding may cause minimal bias in the current study.
Conclusion
We found that short-term ambient PM2.5 levels were associated with increased incidence of ED visits and hospital admissions for acute respiratory illness, particularly among children, during a period when national particulate matter air quality standards were rarely exceeded. Our study relied on relatively crude exposure assignment but alternate specifications in sensitivity analyses resulted in similar estimates. These findings provide support for initiatives to further reduce background ambient PM2.5 exposure in low-pollution settings to lessen morbidity and health service burden. We welcome the recent introduction of more stringent air quality standards, but also echo calls for continuous improvement processes that promote ongoing improvement in air quality and population behavior regardless of current levels (Zosky et al. Citation2021).
Data availability
Exposure and outcome data:
Historical air quality data collected by the Environmental Protection Authority Victoria is publicly available through DataVic (https://discover.data.vic.gov.au/dataset/epa-air-watch-all-sites-air-quality-hourly-averages-yearly/historical; CC BY 4.0). Historical Australian weather data is available on request from the Australian Bureau of Meteorology (http://www.bom.gov.au/climate/data-services/data-requests.shtml). Data from the Victorian Admitted Episodes Dataset and Victorian Emergency Minimum Dataset are available on request from the Victorian Agency for Health Information (https://vahi.freshdesk.com/support/home).
Geospatial data:
Monitoring site and weather station locations were extracted from the relevant exposure datasets. LGA boundary files (2020) were obtained from Geoscape Australia and are publicly available (https://data.gov.au/dataset/ds-dga-bdf92691-c6fe-42b9-a0e2-a4cd716fa811/details; CC BY 4.0). Australian population grid files (2018) were obtained from the Australian Bureau of Statistics and are publicly available (https://www.abs.gov.au/AUSSTATS/[email protected]/DetailsPage/3218.02017-18?OpenDocument). Vicmap digital elevation model files (2022), industrial land files (2020), and Vicmap road line files (2022) published by the Victorian Department of Environment, Land, Water & Planning were obtained from DataVic and are publicly available (https://discover.data.vic.gov.au/dataset/vicmap-elevation-dem-10m; https://discover.data.vic.gov.au/dataset/urban-development-program-industrial-land-2020; https://discover.data.vic.gov.au/dataset/road-network-vicmap-transport; CC BY 4.0).
pm25_resp_illness_supp_submission.docx
Download MS Word (589.4 KB)Disclosure statement
No potential conflict of interest was reported by the author(s).
Supplementary material
Supplemental data for this article can be accessed online at https://doi.org/10.1080/10962247.2022.2146810
Additional information
Funding
References
- Armstrong, B. G., A. Gasparrini, and A. Tobias. 2014. Conditional poisson models: A flexible alternative to conditional logistic case cross-over analysis. BMC Med. Res. Methodol. 14:122.
- Atkinson, R. W., S. Kang, H. R. Anderson, I. C. Mills, and H. A. Walton. 2014. Epidemiological time series studies of PM2.5 and daily mortality and hospital admissions: A systematic review and meta-analysis. Thorax 69 (7):660.
- Australian Bureau of Statistics. 2018. 2033.0.55.001 - Census of population and housing: Socio-economic indexes for areas (SEIFA), Australia, 2016. https://www.abs.gov.au/ausstats/[email protected]/Lookup/by/20Subject/2033.0.55.001~2016~Main/20Features~SOCIO-ECONOMIC/20INDEXES/20FOR/20AREAS/20SEIFA/202016~1.
- Australian Bureau of Statistics. 2021. Regional population, 2019-2020. https://www.abs.gov.au/statistics/people/population/regional-population/2019-20.
- Australian Institute of Health and Welfare. 2021. Australian burden of disease study: Impact and causes of illness and death in Australia 2018. Canberra: AIHW.
- Barnett, A. G., J. F. Fraser, and L. Munck. 2012. The effects of the 2009 dust storm on emergency admissions to a hospital in Brisbane, Australia. Int. J. Biometeorol. 56 (4):719–26.
- Barnett, A. G., G. M. Williams, J. Schwartz, T. L. Best, A. H. Neller, A. L. Petroeschevsky, R.W. Simpson. 2006. The effects of air pollution on hospitalizations for cardiovascular disease in elderly people in Australian and New Zealand cities. Environ. Health Perspect. 114 (7):1018–23.
- Barnett, A. G., G. M. Williams, J. Schwartz, A. H. Neller, T. L. Best, A. L. Petroeschevsky, R. W. Simpson. 2005. Air pollution and child respiratory health: A case-crossover study in Australia and New Zealand. Am. J. Respir. Crit. Care Med. 171 (11):1272–78.
- Beggs, P. J., C. H. Katelaris, D. Medek, F. H. Johnston, P. K. Burton, B. Campbell, A. K. Jaggard, D. Vicendese, D. M. Bowman, I. Godwin, et al. 2015. Differences in grass pollen allergen exposure across Australia. Aust. N Z J. Public Health 39 (1):51–55.
- Borchers Arriagada, N., A. J. Palmer, D. M. Bowman, G. G. Morgan, B. B. Jalaludin, and F. H. Johnston. 2020. Unprecedented smoke-related health burden associated with the 2019-20 bushfires in eastern Australia. Med. J. Aust. 213 (6):282–83.
- Brugha, R., and J. Grigg. 2014. Urban air pollution and respiratory infections. Paediatr. Respir. Rev. 15 (2):194–99. doi:10.1016/j.prrv.2014.03.001.
- Bureau of Meteorology. 2021. Data requests and enquiries. http://www.bom.gov.au/climate/data-services/data-requests.shtml.
- Chen, K., G. Glonek, A. Hansen, S. Williams, J. Tuke, A. Salter, P. Bi. 2016. The effects of air pollution on asthma hospital admissions in Adelaide, South Australia, 2003–2013: Time-series and case–crossover analyses. Clini. Exp. Allergy 46 (11):1416–30.
- City of Melbourne. 2021. Melbourne facts and figures. https://www.melbourne.vic.gov.au/about-melbourne/melbourne-profile/Pages/facts-about-melbourne.aspx.
- Cockburn, P. 2019. Sydney smoke at its ‘worst ever’ with air pollution in some areas 12 times ‘hazardous’ threshold. ABC News (Online). Accessed December 10, 2019. https://www.abc.net.au/news/2019-12-10/sydney-smoke-returns-to-worst-ever-levels/11782892.
- Cohen, A. J., M. Brauer, R. Burnett, H. R. Anderson, J. Frostad, K. Estep, K. Balakrishnan, B. Brunekreef, L. Dandona, R. Dandona, et al. 2017. Estimates and 25-year trends of the global burden of disease attributable to ambient air pollution: An analysis of data from the global burden of diseases study 2015. Lancet (London, England) 389 (10082):1907–18.
- Cori, L., G. Donzelli, and F. Gorini. 2020. Risk perception of air pollution: A systematic review focused on particulate matter exposure. Int. J. Environ. Res. Public Health 17 (17):6424.
- Dennekamp, M., L. D. Straney, B. Erbas, M. J. Abramson, M. Keywood, K. Smith, M. R. Sim, D. C. Glass, A. Del Monaco, A. Haikerwal, et al. 2015. Forest fire smoke exposures and out-of-hospital cardiac arrests in Melbourne, Australia: A case-crossover study. Environ. Health Perspect. 123 (10):959–64.
- Emmerson, K., and M. Keywood. 2021. Australia state of the environment 2021: Air quality, independent report to the Australian government minister for the environment, commonwealth of Australia. Canberra: Commonwealth of Australia.
- Environmental Protection Authority Victoria. 2021. Current air quality. https://www.epa.vic.gov.au/EPAAirWatch.
- Environment Protection Authority Victoria. 2018. Air pollution in Victoria – a summary of the state of knowledge, August 2018. Melbourne, Australia: EPA Victoria.
- Environment Protection Authority Victoria. 2020. EPA air watch all sites air quality hourly averages - yearly. DATA VIC.
- Fewell, Z., G. Davey Smith, and J. A. Sterne. 2007. The impact of residual and unmeasured confounding in epidemiologic studies: A simulation study. Am. J. Epidemiol. 166 (6):646–55.
- Fung, K. Y., D. Krewski, Y. Chen, R. Burnett, and S. Cakmak. 2003. Comparison of time series and case-crossover analyses of air pollution and hospital admission data. Int. J. Epidemiol. 32 (6):1064–70.
- Gleason, J. A., L. Bielory, and J. A. Fagliano. 2014. Associations between ozone, PM2.5, and four pollen types on emergency department pediatric asthma events during the warm season in New Jersey: A case-crossover study. Environ. Res. 132:421–29.
- Goodman, J. E., C. T. Loftus, X. Liu, and K. Zu. 2017. Impact of respiratory infections, outdoor pollen, and socioeconomic status on associations between air pollutants and pediatric asthma hospital admissions. PloS One 12 (7):e0180522.
- Haikerwal, A., M. Akram, M. R. Sim, M. Meyer, M. J. Abramson, and M. Dennekamp. 2016. Fine particulate matter (PM2.5) exposure during a prolonged wildfire period and emergency department visits for asthma. Respirol. 21 (1):88–94.
- Hanigan, I. C., R. A. Broome, T. B. Chaston, M. Cope, M. Dennekamp, J. S. Heyworth, G. B. Marks, Y. Guo, M. Cope, A. Bauman, et al. 2020. Avoidable mortality attributable to anthropogenic fine particulate matter (PM(2.5)) in Australia. Int. J. Environ. Res. Public Health 18 (1):254.
- Hanigan, I. C., M. I. Rolfe, L. D. Knibbs, F. Salimi, C. T. Cowie, J. Heyworth, G. B. Marks, Y. Guo, M. Cope, A. Bauman, et al. 2019. All-cause mortality and long-term exposure to low level air pollution in the ‘45 and up study’ cohort, Sydney, Australia, 2006-2015. Environ. Int. 126:762–70.
- Hansen, A., P. Bi, M. Nitschke, D. Pisaniello, P. Ryan, T. Sullivan, A. G. Barnett. 2012. Particulate air pollution and cardiorespiratory hospital admissions in a temperate Australian city: A case-crossover analysis. Sci. Total Environ. 416:48–52.
- Hinwood, A. L., N. De Klerk, C. Rodriguez, P. Jacoby, T. Runnion, P. Rye, L. Landau, F. Murray, M. Feldwick, J. Spickett. 2006. The relationship between changes in daily air pollution and hospitalizations in Perth, Australia 1992-1998: A case-crossover study. Int. J. Environ. Health Res. 16 (1):27–46.
- Horne, B. D., E. A. Joy, M. G. Hofmann, P. H. Gesteland, J. B. Cannon, J. S. Lefler, D. P. Blagev, E. K. Korgenski, N. Torosyan, G. I. Hansen, et al. 2018. Short-term elevation of fine particulate matter air pollution and acute lower respiratory infection. Am. J. Respir. Crit. Care Med. 198 (6):759–66.
- Huang, J. Q., J. Zhang, C. L. Hao, and Z. R. Chen. 2022. Association of children wheezing diseases with meteorological and environmental factors in Suzhou, China. Sci. Rep. 12 (1):5018.
- Hu, Y., Z. Xu, F. Jiang, S. Li, S. Liu, M. Wu, C. Yan, J. Tan, G. Yu, Y. Hu, et al. 2020. Relative impact of meteorological factors and air pollutants on childhood allergic diseases in Shanghai, China. Sci. Total Environ. 706:135975.
- Jalaludin, B., B. Khalaj, V. Sheppeard, and G. Morgan. 2008. Air pollution and ED visits for asthma in Australian children: A case-crossover analysis. Int. Arch. Occup. Environ. Health 81 (8):967–74.
- Janes, H., L. Sheppard, and T. Lumley. 2005. Case-crossover analyses of air pollution exposure data: Referent selection strategies and their implications for bias. Epidemiol. (Cambridge, Mass) 16 (6):717–26.
- Johnston, F. H., S. Purdie, B. Jalaludin, K. L. Martin, S. B. Henderson, and G. G. Morgan. 2014. Air pollution events from forest fires and emergency department attendances in Sydney, Australia 1996-2007: A case-crossover analysis. Environ. Health 13:105.
- Liu, Q., C. Xu, G. Ji, H. Liu, W. Shao, C. Zhang, C. Zhang, A. Gu, P. Zhao. 2017. Effect of exposure to ambient PM(2.5) pollution on the risk of respiratory tract diseases: A meta-analysis of cohort studies. J. Biomed. Res. 31 (2):130–42.
- Liu, Y., Y. Zhou, and J. Lu. 2020. Exploring the relationship between air pollution and meteorological conditions in China under environmental governance. Sci. Rep. 10 (1):14518.
- Lu, F., D. Xu, Y. Cheng, S. Dong, C. Guo, X. Jiang, X. Zheng. 2015. Systematic review and meta-analysis of the adverse health effects of ambient PM2.5 and PM10 pollution in the Chinese population. Environ. Res. 136:196–204.
- Mäkinen, T. M., R. Juvonen, J. Jokelainen, T. H. Harju, A. Peitso, A. Bloigu, S. Silvennoinen-Kassinen, M. Leinonen, J. Hassi. 2009. Cold temperature and low humidity are associated with increased occurrence of respiratory tract infections. Respir. Med. 103 (3):456–62.
- Manisalidis, I., E. Stavropoulou, A. Stavropoulos, and E. Bezirtzoglou. 2020. Environmental and health impacts of air pollution: A review. Front. Public Health 8:14. doi:10.3389/fpubh.2020.00014.
- Martin, K. L., I. C. Hanigan, G. G. Morgan, S. B. Henderson, and F. H. Johnston. 2013. Air pollution from bushfires and their association with hospital admissions in Sydney, Newcastle and Wollongong, Australia 1994-2007. Aust. N Z J. Public Health 37 (3):238–43.
- Merrifield, A., S. Schindeler, B. Jalaludin, and W. Smith. 2013. Health effects of the September 2009 dust storm in Sydney, Australia: Did emergency department visits and hospital admissions increase? Environ. Health 12 (1):32.
- National Environment Protection (Ambient Air Quality) Measure. 2011. National environment protection (ambient air quality) measure review: review report. Canberra, Australia: National Environment Protection Council Service Corporation.
- Orellano, P., N. Quaranta, J. Reynoso, B. Balbi, J. Vasquez, and Q. Sun. 2017. Effect of outdoor air pollution on asthma exacerbations in children and adults: Systematic review and multilevel meta-analysis. PloS One 12 (3):e0174050.
- Orellano, P., J. Reynoso, N. Quaranta, A. Bardach, and A. Ciapponi. 2020. Short-term exposure to particulate matter (PM10 and PM2.5), nitrogen dioxide (NO2), and ozone (O3) and all-cause and cause-specific mortality: Systematic review and meta-analysis. Environ. Int. 142:105876. doi:10.1016/j.envint.2020.105876.
- Osborne, N. J., I. Alcock, B. W. Wheeler, S. Hajat, C. Sarran, Y. Clewlow, R. N. McInnes, D. Hemming, M. White, S. Vardoulakis. 2017. Pollen exposure and hospitalization due to asthma exacerbations: Daily time series in a European city. Int. J. Biometeorol. 61 (10):1837–48.
- Pirozzi, C. S., B. E. Jones, J. A. VanDerslice, Y. Zhang, R. Paine 3rd, and N. C. Dean. 2018. Short-term air pollution and incident pneumonia. A case-crossover study. Ann. Am. Thorac. Soc. 15 (4):449–59.
- Quanjer, P. H., S. Stanojevic, T. J. Cole, X. Baur, G. L. Hall, B. H. Culver, P. L. Enright, J. L. Hankinson, M. S. Ip, J. Zheng. 2012. Multi-ethnic reference values for spirometry for the 3-95-yr age range: The global lung function 2012 equations. Eur. Respir. J. 40 (6):1324–43.
- Ratajczak, A., and A. Badyda. 2021. Air pollution increases the incidence of upper respiratory tract symptoms among polish children. J. Clin. Med. 10 (10):2150.
- Samek, L. 2016. Overall human mortality and morbidity due to exposure to air pollution. Int. J. Occup. Med. Environ. Health 29 (3):417–26.
- Shaddick, G., M. L. Thomas, P. Mudu, G. Ruggeri, and S. Gumy. 2020. Half the world’s population are exposed to increasing air pollution. Npj Climate Atmos. Sci. 3 (1):23. doi:10.1038/s41612-020-0124-2.
- Sheppard, L., R. T. Burnett, A. A. Szpiro, S. Y. Kim, M. Jerrett, C. A. Pope, B. Brunekreef. 2012. Confounding and exposure measurement error in air pollution epidemiology. Air Quality, Atmosphere & Health 5 (2):203–16.
- Shrestha, S. K., K. A. Lambert, and B. Erbas. 2021. Ambient pollen concentrations and asthma hospitalization in children and adolescents: A systematic review and meta-analysis. J. Asthma 58 (9):1155–68.
- Sunyer, J. 2008. The neurological effects of air pollution in children. Eur. Respir. J. 32 (3):535–37.
- Tecer, L. H., O. Alagha, F. Karaca, G. Tuncel, and N. Eldes. 2008. Particulate matter (PM(2.5), PM(10-2.5), and PM(10)) and children’s hospital admissions for asthma and respiratory diseases: A bidirectional case-crossover study. J. Toxicol. Environ. Health Part A 71 (8):512–20.
- Tham, R., D. Bui, G. Bowatte, and S. Dharmage. 2019. The long-term effects of outdoor air pollution on child, adolescent and adult lung function – a systematic review. Environ. Epidemiol. 3:392.
- Thien, F., P.J. Beggs, D. Csutoros, J. Darvall, M. Hew, J. M. Davies, P. G. Bardin, T. Bannister, S. Barnes, R. Bellomo. 2018. The Melbourne epidemic thunderstorm asthma event 2016: An investigation of environmental triggers, effect on health services, and patient risk factors. The Lancet Planet. Health 2 (6):e255–63.
- Turner, H., and D. Firth. 2020. Generalized nonlinear models in R: An overview of the gnm package (R package version 1.1-1). Accessed December 2021. https://cran.r-project.org/web/packages/gnm/index.html.
- van Buuren, S. 2011. Groothuis-oudshoorn K. mice: Multivariate imputation by chained equations in R. J. Stat. Softw. 45 (3):67.
- Vardoulakis, S., B. B. Jalaludin, G. G. Morgan, I. C. Hanigan, and F. H. Johnston. 2020. Bushfire smoke: Urgent need for a national health protection strategy. Med. J. Aust. 212 (8):349–53.e1.
- Vargas Buonfiglio, L. G., and A. P. Comellas. 2020. Mechanism of ambient particulate matter and respiratory infections. J. Thorac. Dis. 12 (3):134–36.
- Victorian Department of Health. 2020. Victorian admitted episodes dataset. https://www2.health.vic.gov.au/hospitals-and-health-services/data-reporting/health-data-standards-systems/data-collections/vaed.
- Victorian Department of Health. 2020. Victorian emergency minimum dataset (VEMD). https://www2.health.vic.gov.au/hospitals-and-health-services/data-reporting/health-data-standards-systems/data-collections/vemd.
- Walter, C. M., E. K. Schneider-Futschik, N. L. Lansbury, P. D. Sly, B. W. Head, and L. D. Knibbs. 2021. The health impacts of ambient air pollution in Australia: A systematic literature review. Intern. Med. J. 51 (10):1567–79. doi:10.1111/imj.15415.
- Woodley, M. 2020. ‘Hazardous’ Melbourne air considered worst in the world. News GP (Online). 14 January 2020.
- World Health Organization. 2006. Air quality guidelines global update 2005. Geneva: World Health Organization.
- World Health Organization. 2016. Ambient air pollution: A global assessment of exposure and burden of disease. Geneva: World Health Organization.
- World Health Organization. 2021. WHO global air quality guidelines: particulate matter (PM2.5 and PM10), ozone, nitrogen dioxide, sulfur dioxide and carbon monoxide. Geneva: World Health Organization.
- World Health Organization. 2021. New WHO global air quality guidelines aim to save millions of lives from air pollution 2021. Accessed October 23, 2021. https://www.who.int/news/item/22-09-2021-new-who-global-air-quality-guidelines-aim-to-save-millions-of-lives-from-air-pollution.
- Yang, C. L., J. M. Gaffin, and D. Radhakrishnan. 2019. Question 3: Can we diagnose asthma in children under the age of 5 years? Paediatr. Respir. Rev. 29:25–30.
- Yee, J., Y. A. Cho, H. J. Yoo, H. Yun, and H. S. Gwak. 2021. Short-term exposure to air pollution and hospital admission for pneumonia: A systematic review and meta-analysis. Environ. Health 20 (1):6. doi:10.1186/s12940-020-00687-7.
- Zheng, X. Y., H. Ding, L. N. Jiang, S. W. Chen, J. P. Zheng, M. Qiu, Y. X. Zhou, Q. Chen, and W. J. Guan. 2015. Association between air pollutants and asthma emergency room visits and hospital admissions in time series studies: A systematic review and meta-analysis. PloS One 10 (9):e0138146.
- Zhu, R. X., X. H. Nie, Y. H. Chen, J. Chen, S. W. Wu, and L. H. Zhao. 2020. Relationship between particulate matter (PM(2.5)) and hospitalizations and mortality of chronic obstructive pulmonary disease patients: A meta-analysis. Am. J. Med. Sci. 359 (6):354–64.
- Zosky, G. R., S. Vander Hoorn, M. J. Abramson, S. Dwyer, D. Green, J. Heyworth, B. B. Jalaludin, J. McCrindle-Fuchs, R. Tham, G. B. Marks. 2021. Principles for setting air quality guidelines to protect human health in Australia. Med. J. Aust. 214 (6):254–6.e1.