
ABSTRACT
It is generally believed that bio-waste is a suitable substrate for valorizations through fermentation with biogas production. An increasing number of municipalities in Poland implement selective collection of bio-waste. Limited qualitative and quantitative data are available on the composition of household bio-waste, including the contaminant content. This paper presents the adopted research method and the analysis results of the composition of household bio-waste segregated at source from 4 rural and 4 urban communes, from districts with single-family and multi-family housing. Household bio-waste is mostly food waste (43.9 to 56.0%), with a smaller percentage of garden waste (27.4 to 46.3%). According to data from other countries, in Poland, “fruit and vegetable” waste constitutes the main part of household bio-waste (from 40.0 to 53.8%). The share of “contaminants” is relatively high. The most contaminated waste is that collected in containers in city districts with multi-family housing (16.6%). The share of contaminants in bio-waste collected in bags (rural areas and cities with single-family housing exceeded 10.0%).
Implications: This article presents the results of an empirical analysis of the morphological composition, occurring contaminants and seasonal fluctuations in the stream of biodegradable waste delivered to the mechanical-biological treatment (MBT) installation in Marszow (Poland, Lubuskie province). This installation serves the area of 22 municipalities with more than 200.000 residents. Nearly 98% of households and housing estates are covered by regular waste collection. The study covered 12 streams of bio-waste delivered to the installation, divided into rural and urban areas with single-family and multi-family housing during the 2 seasons of autumn and winter.
The importance of the conducted research is emphasized by the fact that the analysis of the morphological composition of bio-waste generated in households is rare, which is probably due to its labor- and time-consuming nature.
The data obtained are a source of valuable information for both national and local governments, as well as can help meet the ambitious targets set for EU member states in terms of preparing for reuse and recycling of municipal waste, which are unlikely to be achieved without proper management of bio-waste.
Another important argument is to reduce food waste in line with the sustainable development goal of reducing food waste by 50% by 2030.
Introduction
According to Directive 2008/98/EC, the term “bio-waste” includes “biodegradable garden and park waste, food and kitchen waste from households, offices, restaurants, wholesalers, canteens, mass catering establishments and retail and comparable waste from food processing plants” (Directive Citation2018/851). At the household level, food waste accounts for the largest share of bio-waste; especially in large urban centers, the share of garden waste is relatively small (Malamis et al. Citation2015).
According to the European Topic Centre on Sustainable Consumption and Production (ETC/SCP) calculations, bio-waste accounted for 37% of municipal waste in Europe (EU 27 excluding Cyprus) between 2008 and 2010 (Biowaste selective collection Citation2016). Differences in waste composition were found between developed and developing countries. Asase et al. (Citation2009) found that in London (UK), the share of biodegradable waste in household waste was 30%, while Kumasi waste in Ghana was 64%. Bölükbaş and Akinci (Citation2018) found that in Germany the share of biodegradable waste in household waste is 30% (2006), in England 38% (2007) and in Greece 48% (2014). In Poland, the share of biodegradable waste in 2021 was about 31% (Jedrczak Citation2021).
In 2012, bio-waste recycled in the EU-28 Member States accounted for 15% of the mass of Municipal Solid Waste (MSW) generated (average 486 kg per capita in 2012) and 17% in 2018 (491 kg (cap·y)−1) (Eurostat Citation2021). These values and their increments are low. They indicate that a greater emphasis on bio-waste recycling (composting or digestion) is needed.
There are many possible ways to improve the overall recycling rate of municipal waste.
Increasing bio-waste recycling is necessary because the European Commission in May 2018 proposed new, more ambitious targets for municipal waste recycling (65% by 2035) and landfill reduction (10% by 2035) in the “Closed Economy Package” (Directive Citation2018/851).
In the EU, there is not yet a recycling obligation and target for biowaste but a provision has appeared in the Directive that, from 31 December 2023 at the latest, “biowaste shall be separated and recycled at source or collected separately and not mixed with other types of waste”.
Proper handling of biowaste requires knowledge of its material composition and degree of contamination. Unfortunately, studies of the morphological composition of bio-waste from households are rare, probably due to labor-intensive and time-consuming procedures (Alessi et al. Citation2020; Hanc et al. Citation2011; Lebersorger and Schneider Citation2011). More information is available on the composition of garden waste, which has different properties from segregated kitchen waste (Boldrin and Christensen Citation2010; Ward, Litterick, and Stephen Citation2005).
Bio-waste composition data is of interest to a range of stakeholders, such as national and local authorities, as well as waste management companies, researchers and the general public, in order to:
(a) determine the types of pollutants and their content in bio-waste;
(b) collect information on measures to reduce food waste;
(c) develop or revise a separate collection scheme for bio-waste;
(d) decide on an appropriate method of bio-waste disposal;
(e) design bio-waste treatment facilities;
(f) establish the characteristics of the final product and any special process requirements;
(g) predict how the composition and parameters of bio-waste will vary depending on the season can affect both the course and results of bio-waste treatment;
This paper presents the results of a study of bio-waste collected in rural areas and in cities from urban settlements with multi-family and single-family housing to assess differences in its quantity and morphological composition. The work is intended to provide scientific support in the decision-making process for developing or revising a separate collection programme for biowaste and selecting treatment solutions.
Methodology
Types of waste tested
Twelve bio-waste streams were included in the study:
four streams from rural municipalities (single-family housing) (R) - Żary, Żagań, Trzebiel and Wymiarki;
urban municipalities - Żary, Żagań, Gozdnica and Łęknica:
- four streams from single-family housing (US),
- four streams from multi-family housing (UM).
Bio-waste is collected in a door-to-door system. In single-family housing areas (rural and urban), biowaste is collected in bags, while in multi-family housing areas it is collected in bins or containers located in the courtyard or other area accessible from the building.
Waste sampling
Waste sampling and analysis was carried out by staff at the Central Laboratory of the Institute of Environmental Engineering. The laboratory is accredited for waste sampling and testing, valid until 02/01/2023 (Accreditation certificate Citation2018).
General waste sampling and laboratory sample preparation were carried out using the methods developed by Szpadt and Jędrczak (Citation2006), taking into account the recommendations contained in the guidelines set for the Ministry of the Environment (Pietrzyk et al. Citation2018).
Laboratory samples of bio-waste were prepared by collecting waste from 10 randomly selected bags delivered from the study area (single-family housing) or sampling of approximately 15 kg each from 10 randomly chosen containers (multi-family housing). The average total weight of samples for testing should be at least 100 kg.
Three samples of waste were analyzed in each measurement series from every place of origin.
Frequency and scope of tests
The research was carried out on a monthly basis between November 2021 and April 2022. The scope of the study was to perform morphological analysis of the bio-waste.
Various systems have been developed to categorize the main components of separately collected organic or food waste from households (Asase et al. Citation2009; Hanc et al. Citation2011; Heaven et al. Citation2010; WRAP Citation2009). The paper distinguishes 3 main categories of ingredients: food waste, garden waste and pollution (). Based on the definition of “food waste” (Special Report Citation2016), that is any product or part of a product, whether processed, partially processed or unprocessed, intended for human consumption, that would have been consumed had it been processed or stored differently. Food waste is divided into two categories of edible and non-edible waste, with 5 types of waste distinguished.
Table 1. Scope of material analysis of bio-waste.
Research results
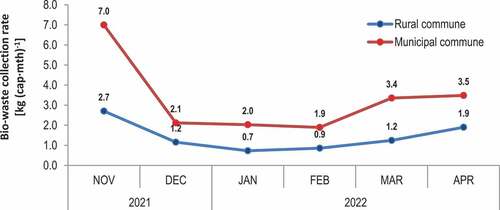
Between November and April, rural residents collected an average per capita per month of 1.4 kg (cap·mth)−1 of bio-waste and urban residents collected 3.3 kg (cap·mth)−1; during the study period, the amount of bio-waste selectively collected in December, January and February was significantly lower than in November, March and April ().
Figure 1. Monthly changes in the amount of separately collected bio-waste in urban and rural areas between November 2021 and April 2022.
Bio-waste collected from urban areas with multi-family housing in urban and rural areas contained more food waste (56.0 ± 19.0% and 54.9 ± 19.8%, respectively) than bio-waste from single-family dwellings in urban areas (43.9 ± 23.8%). Edible waste accounted for between 5.0% (US) and 9.1% by weight of bio-waste (R) (). Edible food waste was dominated by fruit and vegetable waste, whose share ranged from 50.7% (UM) to 68.5% (R) (). The proportion of bread and bakery products was also high, ranging from 19.9% (R) to 35.0% (US). Inedible food waste, fruit and vegetable waste accounted for 98.7 and 99.1% by weight, respectively ().
Figure 2. Share of garden waste, food waste, contaminants and bags for separate collection (bin bags) in bio-waste from households, urban single-family (A) and multi-family housing (B) and rural municipalities (C).
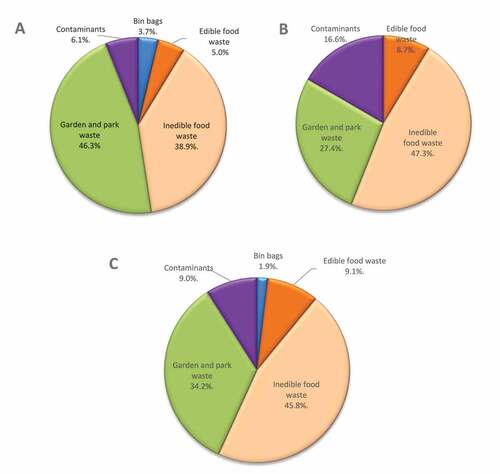
Table 2. Breakdown of the food waste fractionate occurring in separately collected bio-waste from households, urban single-family and multi-family housing and rural areas.
The results obtained are similar to the data of Hanc et al. (Citation2011). They showed that food waste in the autumn-winter period accounted for between 55.0 and 70.0% by weight of bio-waste. The waste mainly consisted of non-citrus fruits and vegetables, citrus fruits and small amounts of bread.
In Poland, “fruit and vegetable” waste is the main part of household bio-waste, as in other European countries. Fruit and vegetables accounted for 60.2% in Greece (Malamis et al. Citation2015) and between 44.5 and 69.0% of food waste collected in Finland, the UK, Portugal and Italy (WRAP Citation2008).
The share of garden waste in bio-waste from urban areas averaged 27.4 ± 20.5% (multi-family housing) and 46.3 ± 24.6% (single-family housing), and 34.2 ± 20.6% in bio-waste collected in rural areas (). The high share of garden waste in bio-waste from single-family housing in urban areas is understandable. These houses tend to have small gardens, which are usually used as small orchards, flower gardens, lawns and flowerbeds. The relatively mild winter of 2021/22 was conducive to carrying out minor cleaning work during the study period.
Contaminants accounted for 9.0 ± 4.1% of the weight of bio-waste collected in rural areas, excluding the bags in which this waste is collected (). The weight of the bags after emptying accounted for 1.9 ± 0.3% of the weight of bio-waste. The share of contaminants in bio-waste from single-family dwellings in urban areas averaged 6.1 ± 3.2%, and bags 3.7 ± 0.9%. In bio-waste from multi-family housing in cities, which is collected in containers, the share of contaminants was the highest, averaging 16.6 ± 6.3%.
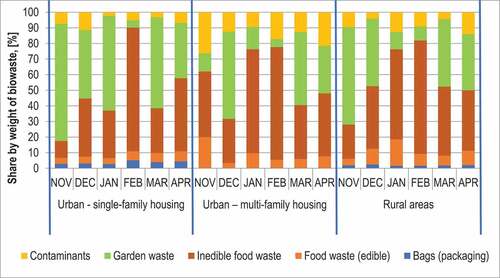
A comparison of the monthly average morphological compositions of the waste from November to April shows some interesting changes ():
Bio-waste collected in January and February from multi-family housing in urban and rural areas and from single-family housing in urban areas only in February contained minimal amounts of garden waste;
Bio-waste from single-family housing in urban and rural areas contained noticeably less food waste in November than in the remaining months
Figure 3. Changes in the shares of garden waste, edible and non-edible food waste, contaminants and selective collection bags in household bio-waste from urban single-family and multi-family housing and from rural municipalities.
shows the types of pollutants and their content in household bio-waste collected from single-family and multi-family housing in urban and rural municipalities.
Figure 4. Composition and contaminant content of household bio-waste collected from single-family (US) and multi-family (UM) developments in urban and rural municipalities (R).
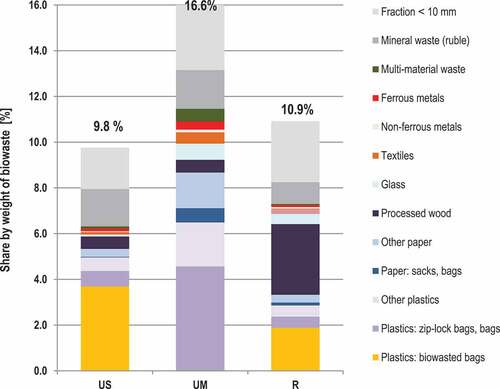
The material composition of the pollutants present in the bio-waste from the analyzed generation areas varied considerably. Among the contaminant components in bio-waste from single-family housing in cities, plastics were the most abundant (5.0 ± 1.4% by weight of bio-waste).
The <10 mm fraction (1.8 ± 1.3%) and mineral waste (1.6 ± 2.4%) were also present in large quantities. In bio-waste from multi-family housing in urban areas, plastics were also present in the highest quantities (6.5 ± 1.5% of bio-waste mass), even though this waste is collected in containers. The <10 mm fraction (3.5 ± 3.4%) and mineral waste (1.7 ± 3.7%) were also present in large quantities.
In contrast, plastics accounted for 2.9 ± 0.5% of bio-waste weight from rural areas. The share of treated wood was also high (3.1 ± 4.1%).
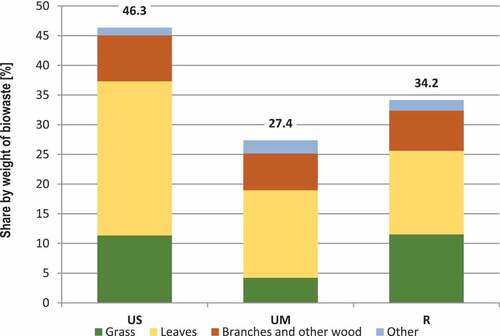
The garden waste fraction from November to April was dominated by leaves irrespective of where the waste was generated (41.2 to 56.0% by weight of garden waste). Branches and untreated wood accounted for 16.7 to 19.8% of the waste, and grass from 15.4 to 33.8% (). A similar composition of garden waste during the autumn and winter seasons was found by Hanc et al. (Citation2011). The garden waste collected in Prague consisted mainly of leaves of deciduous trees (74.5 and 35.8%, respectively). Another component was small branches from tree and shrub cuts (17.5% on average annually). Hanc et al. (Citation2011) did not show the presence of grass in the autumn and winter waste. In contrast, garden waste in Aarhus, Denmark collected in autumn and winter (November-March) was dominated by fine components, i.e., grass, soil, flowers, leaves, etc. (50–80%), while the proportion of branches and wood ranged from 10.0 to 45.0%. This was due to reduced winter garden activity and a focus on pruning trees and shrubs (Boldrin and Christensen Citation2010).
Figure 5. Types and average content of garden waste components in household bio-waste collected from single-family (US) and multi-family (UM) developments in urban and rural municipalities (R) in the period November to April.
Conclusion
The results of research on the morphology of bio-waste collected in urban areas in bags (single-family housing) and containers (multi-family housing) and in rural areas in bags showed a number of interesting information.
Fruit and vegetable waste is the main component of bio-waste from urban households from neighborhoods with multi-family housing and from rural municipalities (51.6 and 54.3% by weight of bio-waste, respectively). In the bio-waste collected from residents from single-family houses in cities, usually with small gardens, fruit and vegetable waste accounted for 45.3% by weight of bio-waste.
Garden waste predominates in bio-waste from single-family housing in urban areas – approximately 46.3%. Their share of bio-waste from rural areas was 34.2% and from multi-family housing in cities, 27.4%. In autumn and winter, garden waste was dominated by leaves.
The proportion of contamination was relatively high. The most contaminated waste was that collected in bins in urban districts with multi-family housing (16.6%). The share of contaminants in bio-waste collected in bags (rural areas and cities with single-family housing) was 10.9 and 9.8%, respectively.
Disclosure statement
No potential conflict of interest was reported by the author(s).
Data availability statement
The data that support the findings of this study are available from the corresponding author, [WD], upon reasonable request.
Additional information
Notes on contributors
Wojciech Dronia
Wojciech Dronia is a PhD student at The Doctoral School of Exact and Technical Sciences, University of Zielona Gora, Poland. He earned his MSc Eng. in Environmental Engineering from the University of Zielona Gora. He is an engineer at the Municipal Waste Treatment Plant in Marszów.
Jacek Połomka
Jacek Połomka is the CEO of the Municipal Waste Treatment Plant in Marszów. He earned a PhD in Environmental Engineering, Mining and Energy. He has authored/co-authored numerous refereed journal publications in the field of waste management.
Andrzej Jędrczak
Andrzej Jędrczak is a professor at the Institute of Environmental Engineering, University of Zielona Góra, Poland. Professor Andrzej Jędrczak is the author/co-author of 135 publications, 4 monographs, 1 book in the field of Environmental Engineering and 55 design documentations over 250 reviews, evaluations and opinions and 2 patents.
References
- Accreditation certificate of testing laboratory No AB 772 is valid until 02/01/2023. 2018. PCA, Warsaw.
- Alessi, A., A. C. P. Lopes, W. Muller, F. Gerke, S. Robra, and A. Bockreis. 2020. Mechanical separation of impurities in biowaste: Comparison of four different pretreatment systems. Waste Manage. 106:12–20. doi:10.1016/j.wasman.2020.03.006.
- Asase, M., E. K. Yanful, M. Mensah, J. Stanford, and S. Amponsah. 2009. Comparison of municipal solid waste management systems in Canada and Ghana: A case study of the cities of London, Ontario, and Kumasi, Ghana. Waste Manage. 29 (10):2779–86. doi:10.1016/j.wasman.2009.06.019.
- Biowaste selective collection schemes. 2016. ACR+, Brussels, March. Accessed April 14, 2020. https://www.turkeycomposts.org/files/resources/ACR_Biowaste_selective_collection_schemes_2016.pdf.
- Boldrin, A., and T. H. Christensen. 2010. Seasonal generation and composition of garden waste in Aarhus (Denmark). Waste Manage. 30 (4):551–57. doi:10.1016/j.wasman.2009.11.031.
- Bölükbaş, A., and G. Akinci. 2018. Solid waste composition and the properties of biodegradable fractions in Izmir City, Turkey: An investigation on the influencing factors. J. Environ. Health Sci. Eng. 16 (2):299–311. doi:10.1007/s40201-018-0318-2.
- Directive (EU) 2018/851 of the European Parliament and of the Council of 30 May 2018 amending. Directive 2008/98/EC on waste (Text with EEA relevance) (OJ EU. L. 150/109, 14/6/2018).
- Eurostat. 2021. Accessed April 14, 2020. https://ec.europa.eu/eurostat/web/waste/data/database.
- Hanc, A., P. Novak, M. Dvorak, J. Habart, and P. Svehla. 2011. Composition and parameters of household bio-waste in four seasons. Waste Manage. 31 (7):1450–60. doi:10.1016/j.wasman.2011.02.016.
- Heaven, S., Y. Zhang, R. Arnold, T. Paavola, F. Vaz, and C. Cavinato. 2010. Project acronym: VALORGAS project full title: Valorisation of food waste to biogas grant agreement no.: 241334 D2.1: Compositional analysis of food waste from study sites in geographically distinct regions of Europe. Accessed April 12, 2020. https://www.valorgas.soton.ac.uk/Deliverables/VALORGAS_241334_D2-1_rev[1]_130106.pdf.
- Jedrczak, A. 2021. Unpublished work.
- Lebersorger, S., and F. Schneider. 2011. Discussion on the methodology for determining food waste in household waste composition studies. Waste Manage. 31 (9–10):1924–33. doi:10.1016/j.wasman.2011.05.023.
- Malamis, D., K. Moustakas, A. Bourka, K. Valta, O. Skiadi, Ε. Stamatopoulou, A. Sotiropoulos, V. Panaretou, M. Margaritis, C. Papadaskalopoulou, et al. 2015. Compositional analysis of food waste from study sites in Greek municipalities. Waste Biomass Valorisation 6 (5):637–46. doi:10.1007/s12649-015-9406-z.
- Pietrzyk, J., I. Rackiewicz, J. Leoniewska-Gogola, and M. Pochwała. 2018. Guidelines for local government units on the implementation of research in the analysis of morphological composition of waste, physical and chemical properties of waste and verification of research results. ATMOTERM SA, Opole, Krakow, Warsaw, November.
- Special Report. 2016. Combating food waste: An opportunity for the EU to improve the resource-efficiency of the food supply chain. no 34. Publications Office of the European Union, Luxembourg. Accessed April 12, 2020. https://www.eca.europa.eu/Lists/ECADocuments/SR16_34/SR_FOOD_WASTE_en.pdf.
- Szpadt, R., and A. Jędrczak. 2006. Determination of research methodology of sieve, morphological and chemical composition of municipal waste. Kamieniec Wrocławski, Zielona Góra, 110s.
- Ward, C., A. Litterick, and N. Stephen. 2005. Assessment of the potential for site and seasonal variations of composted materials across the UK. Final report: project ORG005. WRAP, Banbury, UK.
- WRAP. 2008. The food we waste. ISBN 1-84405-383-0 (version 2). Accessed April 10, 2020. https://wrap.s3.amazonaws.com/the-food-we-waste.pdf.
- WRAP. 2009. Household food and drink waste in the UK ISBN 1-84405-430-6. WRAP, Banbury, UK. Accessed April 12, 2020. https://wrap.org.uk/resources/report/household-food-and-drink-waste-uk-2009.