
ABSTRACT
The chemical industry releases various types of volatile organic compounds (VOCs) into the atmosphere, and the concentration of VOCs emitted from chimneys is regulated worldwide. However, some VOCs such as benzene are highly carcinogenic, while others such as ethylene and propylene may cause secondary air pollution, owing to their high ozone-generating ability. Accordingly, the US EPA(United State, Environment Protect Agency) introduced a fenceline monitoring system that regulates the concentration of VOCs at the boundary of a facility, away from the chimney source. This system was first introduced in the petroleum refining industry, which simultaneously emits benzene, affecting the local community because of its high carcinogenicity, and ethylene, propylene, xylene, and toluene, which have a high photochemical ozone creation potential (POCP). These emissions contribute to air pollution. In Korea, the concentration at the chimney is regulated; however, the concentration at the plant boundary is not considered. In accordance with the EPA regulations, Korea’s petroleum refining industries were identified and the limitations of the Clean Air Conservation Act were studied. The average concentration of benzene at the research facility examined in this study was 8.53 µg/m3, which complied with the benzene action level of 9 µg/m3. However, this value was exceeded at some points along the fenceline, in proximity to the benzene-toluene-xylene (BTX) manufacturing process. The composition ratios of toluene and xylene were 27% and 16%, respectively, which were higher than those of ethylene or propylene. These results suggest that reduction measures in the BTX manufacturing process are necessary. This study shows that legal regulations should enforce reduction measures through continuous monitoring at the fenceline of petroleum refineries in Korea.
Implications: Although volatile organic compounds(VOCs) are essential in various industrial sites, they adversely affect the health of people in the near community. Benzene is highly carcinogenic, so it is dangerous if exposed continuously. In addition, there are various types of VOCs, which combine with atmospheric ozone to generate smog. Globally, VOCs are managed as Total VOCs. However, through this study, VOCs have priority, and in the case of the petroleum refining industry, it is suggested that VOCs should be preemptively measured and analyzed to be regulated. In addition, it is necessary to minimize the impact on the local community by regulating the concentration at the fenceline beyond the chimney measurement.
Introduction
For the effective management of volatile organic compounds (VOCs) in the atmosphere, it is necessary to build an inventory of emission sources and develop emission factors or measure them periodically. However, to date, emission factors remain under developed and are rarely measured (Kim Citation2006).
It is difficult to comprehensively reflect the status of emissions from Korean industries using the methods of the United States Environmental Protection Agency (US EPA) or those of the European Union (EU) CORINAIR (a program to establish an inventory of air pollutant emissions in Europe), as well as ascertain the accuracy and reliability of the results. Currently, in Korea, in accordance with Article 38 of the Clean Air Conservation Act, the concentration of VOCs is measured once a year depending on the target industry, with 35 types of substances subject to management, and 11 types of substances applied by the refinery industry, and the resulting values are regulated. In addition, although the emission of hazardous air pollutants (HAPs) is regulated by classifying emission sources into point and non-point pollutant sources, this method has limitations, such as difficulties in measuring and infrequent (once yearly) measuring (Kim, Kim, and Kim Citation2018).
In the US, since the Clean Air Act (CAA) was amended in 1977, the number of large-scale emission sources, emitting more than 100 tons of VOCs per year, began to reduce. By dividing the hazardous areas into five stages, the regulation systematization and regulation of mobile emission sources were strengthened. Each state is required to submit a state implementation plan listing on VOC reduction measures to maintain federal air quality standards for at least 10 years (Reitze Citation2004).
Therefore, the state and local governments enact state and local laws based on federal laws in consideration of local pollution characteristics. In conclusion, federal and state governments in the US are gradually strengthening VOC regulations by setting specific VOC reduction targets and expanding the scope of their application (Grover and Bradford Citation2001).
In 1994, the EU took steps to reduce VOC emissions throughout Europe by passing the EU Act on VOC Emission Control from Oil Storage, Shipping, and Sales Facilities. They also manage VOCs separately for each country. Efforts are being made to reduce VOC emissions from facilities by implementing this plan (Wolkoff Citation2003).
There are several methods for implementing VOCs reduction measures. One is to estimate the amount of VOC emitted into the atmosphere. Most VOCs are emitted into the atmosphere, and the sources of these VOCs should be determined before a reduction plan is established (Lübkert and Schöpp Citation1989).
Some VOCs are important precursor substances that can lead to the generation of other pollutants such as by catalyzing the photochemical reaction process of ozone generation. These VOCs require preferential management (Derwent et al. Citation1998).
To this end, the US EPA has proposed fenceline monitoring to track and manage the concentration of VOCs in the near surrounding petroleum refinery facilities community areas. This system involves the measurement of the boundary concentration of air pollutant VOCs representing benzene (benzene is an essential VOC, while other VOCs may also be selected for monitoring depending on the state and business site) (Widdowson and Barden Citation2015).
The purpose of the scheme is to make it easier to track air pollution leaks from pipes, flanges, and other industrial facilities using atmospheric measurement technology. Such measurements would aid in identifying the location of a leak as well as the chemicals being released, such that the appropriate mitigation measures can be taken. Not all VOCs come from chimneys; therefore, undetected leaks are a significant source of emissions which can occur in industries, refineries, energy production facilities, and natural gas pipelines. Fenceline monitoring is implemented to solve this leak problem for the protection of workers and nearby communities, and to reduce a company’s operating costs (Parker Citation2015).
However, the fenceline monitoring scheme is not targeted at all business sites but preferentially aimed at the petroleum-refining industries. In addition, detailed regulations are set for each state to establish management policies suitable for local communities (Schultz and Maher Citation2015). Benzene is a commonly monitored chemical, because it is a representative carcinogen that poses a risk to community residents, even at low concentrations. In the US, the regulations state that the concentration of benzene in the fenceline of the petroleum refining industry should be maintained below 9 µg/m3, the benzene action level. Fenceline monitoring regulations also regulates the monitoring of concentrations of toluene, xylene, and ethylbenzene, known as BTX substances (Olive, Gamiles, and Wicking-Baird Citation2019).
Through these regulations, oil refinery industries can control the emission status and concentration of VOCs through continuous monitoring and analyze the average annual concentration and weather conditions to identify points that require reduction or materials that should be regulated. However, in Korea, only the emission concentration from chimneys is managed according to the Clean Air Conservation Act. Because chimneys are point sources of pollutants, the Act is limited by a lack of data relating to the concentration of pollutants in the atmosphere or the concentration or composition ratio at facility boundaries. Therefore, the Act does not facilitate the identification of VOCs that affect ozone generation, or the suggestion of reduction measures based on concentrations at the boundary of an industry or the composition ratio of emitted VOCs (Korea Environmental Preservation Association Citation2004).
Accordingly, in this study, VOC concentrations were measured and analyzed at the fenceline of a petroleum refining facility, and the results were compared with REL(Recommended Exposure Limit). The purpose of this study was to determine whether the benzene concentration of the VOCs was maintained below the action level specified by the EPA. The composition ratio of VOCs with high ozone-generating ability was also determined. In particular, reduction measures are required in the case of a facility or process that produces a large concentration of VOCs with high ozone-generating ability. The petroleum refining industry is large and has the advantage of undertaking similar processes in each facility. Consequently, the results of this study can be applied to other petroleum-refining industries. This study analyzes the limitations of the Clean Air Conservation Act currently regulated in Korea, the VOC concentrations at measurement points along the fenceline of a petroleum refining facility, and suggests the need for legal regulation that can enforce long-term reduction measures in the future.
Material and methods
Classification of VOC emission sources by process in petroleum refining industry
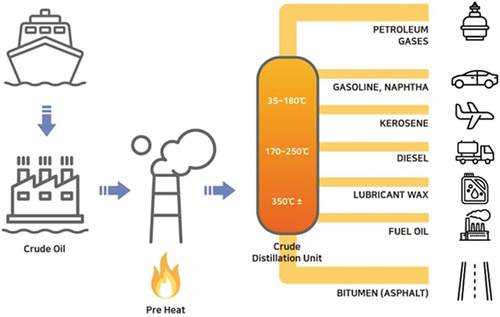
Crude oil is a collection of many types of hydrocarbon compounds, and usually contains 82.1%–87.1% carbon, 11.7%–14.7% hydrogen, 0.5%–3% sulfur, 0.01%–0.1% oxygen, and 0.1%–1.0% nitrogen. In addition, metallic elements such as vanadium are present in trace amounts. The boiling temperature of crude oil components varies over a wide range. Petroleum refining refers to the distillation of crude oil to manufacture various petroleum and semi-finished products. Hydrocarbons are the main components of crude oil, and differences in the shape or size of hydrocarbon molecules, affect the properties of these chemical substances. Crude oil is distilled to obtain various types of hydrocarbons such as methane, propane, and benzene. Distillation utilizes the different boiling points of hydrocarbons to separate and extract products such as the gasoline, kerosene, and diesel from crude oil. The processes conducted at a petroleum refining facility can be classified as follows (Kim et al. Citation2011).
Residue Fluid Catalytic Cracking unit (RFCC)/Residue Desulfurization (RDS) process
This process uses the residue of the atmospheric distillation process (or AR) as an input material. Intermediate products and materials include hydrogen, methane, ethane, propane, propylene, butane, naphtha, kerosene, light oil, and hydrogen sulfide. The final products include propane, propylene, butane, gasoline, diesel, and slurry oil (supplied as a raw material to a carbon black plant) (Cheng et al. Citation2004).
Crude Distillation Unit (CDU) process
Concentrated crude oil is used as the raw material in this process and mainly includes naphtha component, while the intermediate products and handling materials are methane, ethane, propane, butane, naphtha, aromatic compounds, kerosene, light oil, and hydrogen sulfide. The final products of this process are propane, butane, kerosene, light oil, and aromatic products (benzene, toluene, and xylene) (Liau, Yang, and Tsai Citation2004).
BTX process
Naphtha and mixed xylene are used as raw materials to generate hydrogen, methane, ethane, propane, butane, aromatic compounds, and hydrogen sulfide as intermediate products. The final products include benzene, toluene, para-xylene, and ethylbenzene (Radwan, Gar Alalm, and El-Etriby Citation2019).
CDU/Hydrodesulfurization (HDS) process
This is similar to the CDU and BTX processes. Raw materials include crude oil and hydrogen, and intermediate materials such as hydrogen, methane, ethane, propane, butane, naphtha, gasoline (containing BTX substances), kerosene, diesel, AR oil, and hydrogen sulfide. The final products include propane, butane, gasoline containing BTX substances, kerosene, diesel, and bunker C oil (Jarullah, Mujtaba, and Wood Citation2012).
Vacuum Distillation Unit (VDU)/Hydrocrack (HCR)/Delayed Coking Unit (DCU)/HDS process
The input material is crude oil, with intermediate production of hydrogen, methane, ethane, propane, naphtha, gasoline, BTX material, kerosene, light oil, AR, asphalt, coke, and hydrogen sulfide. The final products are propane, butane, naphtha, gasoline, BTX material, kerosene, diesel, bunker C oil, asphalt, and coke (Park et al. Citation2010).
Wastewater treatment process
To treat wastewater in a factory, acidic and basic substances are added to adjust the pH, and then, the wastewater is discharged after physical processing, chemical reaction, and slurry treatment. Theoretically, there are no emissions, but there is a possibility that the wastewater could contain substances generated by the BTX manufacturing process; hence, it was included in the analysis.
Crude oil storage tank, product storage tank, and warehouse area
A crude oil storage tank contains crude oil comprising various amounts of methane, ethane, propane, butane, naphtha, kerosene, diesel, and bunker C oil, and a product storage tank may contain naphtha, gasoline, kerosene, and diesel. In a warehouse containing various subsidiary materials, it is likely that there will be no separate substances.
A schematic diagram featuring each process is presented in .
Figure 1. Process diagram of petroleum refining industry.
The measurement point for each process was taken as the value obtained at the point closest to the process, and the chemical substances expected to be emitted are as follows: ()
Table 1. Expected VOC emissions by process.
Regulation and measurement of VOCs
Methods for regulation, measurement, and analysis of VOCs followed the EPA Methods 325A and 325B as guidelines for measurement and analysis of fenceline monitoring. When monitoring a fenceline, emissions should be managed so that the average annual sampling result of benzene is 9 µg/m3 or less, which is the action level of benzene suggested in EPA-HQ-OAR-2010–0682–0993. Other VOCs vary from state to state, but in California, the EPA determines whether each substance exceeds the reference exposure level (REL) criteria and discloses the results. The REL value is a numerical value indicating the concentration at which a substance will not have any effect on the health or air quality levels of a community. These REL values are updated by the California EPA. For substances that do not have an REL value, a threshold limit value (TLV) may be applied (DeWees Citation2015). The REL values for benzene, ethylene, propylene, toluene, and xylene are listed in .
Table 2. REL values of representative substances to be monitored.
The EPA has proposed six site boundary monitoring techniques that can be used by the petroleum refining industry. This study used an active monitoring station (AMS) method with a manual pump (). For direct measurement at the research site, 6 L samples were collected twice in the morning and three times in the afternoon using a sample suction pump (SIBATA, MP-Σ30) at a flow rate of 200 mL/min for 30 min. For the sampling tube, a Carbotrap 300 (1/4 in.×3 1/2 in, Sigma) was filled with Carbopack C + Carbopack B + Carbosieve SIII, with reference to the Guidelines for Sorbent Selection of EPA Method TO-17. The cold trap used a carbon trap. ().
Figure 2. Six types of EPA fenceline monitoring techniques.
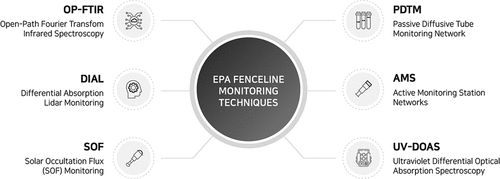
Table 3. Measurement methods and targets.
For the direct measurement sample, the sample collected in the solid adsorption tube was thermally desorbed, concentrated in a low-temperature concentration trap, thermally desorbed again, and then analyzed using gas chromatography mass spectrometry (GC-MS). RESTEK’s Ozone Precursor Mixture/PAMS (57 components, 1 ppm) and RESTEK’s TO-15 (54 components, 100 ppb) were used as gaseous standard mixtures for the quantitative analysis of VOCs ().
Table 4. Gas chromatography analysis conditions.
Selection of measurement points for each process according to fenceline monitoring regulations
The number of measurement points was selected based on the site area of the target facility according to the EPA fenceline monitoring technique, and measurements were made every 20° from the center point of the site. The EPA fenceline monitoring technique was applied to compare emissions by process, but the distance was adjusted for parts with a common process (). In this way, the processes adjacent to each of the 18 measurement points were matched as stated in .
Table 5. Nearby processes for each measurement point in the research plant.
Types of highly reactive VOCs linked to ozone generation and their POCO in research plant
Ethylene, propylene, xylene, and toluene are major precursor VOCs and photochemical pollutants that act as catalysts in the photochemical production of ozone. In general, the contribution of VOCs to ozone production is affected by their concentration and photochemical ozone creation potential (POCP). The ozone-generating potential of a substance was determined by its degree of reactivity with OH in the atmosphere, and the reference material was ethylene (POCP = 100). Therefore, the contribution rate of VOCs to ozone generation was calculated using the VOC concentration and POCP value as variables. At each measurement point in this study, a ratio of the top 10 VOCs contributing to ozone generation among the 56 ozone precursor substances was determined. () The point or process at which many of these substances are emitted was identified as a major contributor of VOCs, especially of those that are ozone generating (Marlowe and Bone Citation1999).
Table 6. POCP values suggested by the EU for VOCs with high emission potential in this study.
Results
Exceeding the action level of benzene
The Korea Clean Air Conservation Act regulates the concentration of benzene emitted from chimneys to 10 ppm (approximately 30 mg/m3). However, the EPA suggests a benzene action level at a fenceline of 2.8 ppb (9 µg/m3), which is 3500 times lower than the Korean standard. It is not possible to regulate the concentration in a fenceline with only the concentration of benzene emitted from the chimney. This is because the concentration that effects on the local community is not the concentration in the chimney, but in the fenceline. The EPA requires every workplace to submit a report of periodic measurements of benzene concentrations (Feitshans Citation1989). Some petroleum refinery facilities have established a real-time measurement network and the concentration of benzene is reported to the local community. The measured results are converted to average values and the annual average concentration is also reported.
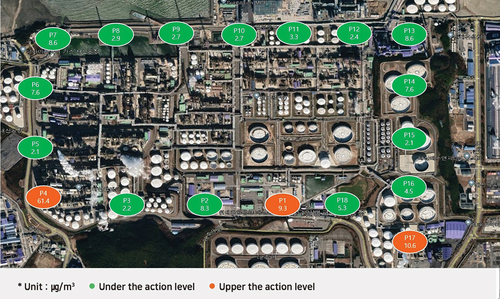
In this study, the benzene concentrations were measured at 18 points around the study site and then compared (). The study site had an average benzene concentration of 8.53 µg/m3, but there was a large variation between each measurement point. Reduction targets were identified as points where the concentration was 9 µg/m3 or higher. In particular, the benzene concentration near the BTX process was nearly seven times higher than the action level. There are three points where the action level of benzene, 9 µg/m3, is exceeded. These points are points 1, 4, and 17. The highest concentration of benzene is at point 4(61.4 µg/m3). Point 4 is close to the CDU process and the BTX process. Among the whole process. benzene is emitted at a high level in the BTX manufacturing process. Also, points 1 and 17 are processes near the crude oil storage tank. Although the action level of 9ug/m3 has been exceeded, the 1st point is 9.3 µg/m3 and the 17th is 10.6 µg/m3, and the excess is insignificant and there is no big difference from other nearby points (). This suggests that management is necessary in the BTX process or storage tank process among emission sources in the petroleum refining industry.
Figure 3. Process layout diagram for each measurement point in the research plant.
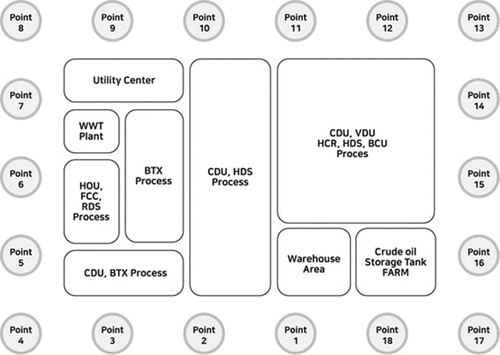
Figure 4. Measured concentrations and comparison with action level for benzene at each measurement point at the fenceline.
Exceeding REL value of ozone-generating and highly reactive VOCs
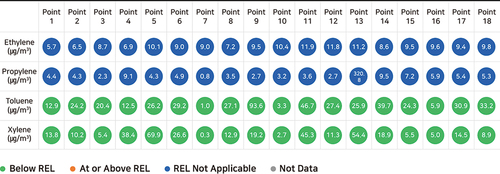
To monitor highly reactive ozone-generating VOCs other than benzene, the concentrations of ethylene, propylene, toluene, and xylene in the fenceline were compared with their respective REL values stipulated by the EPA (). The concentrations at all measurement points were below the REL value or not applicable (in the case of ethylene and propylene). In the case of ethylene, the REL value is not presented and is currently presented as TLV, and in the case of propylene, it is indicated as REL not applicable because it is not applicable in the case of chronic standards. The concentration of benzene at Point 4, adjacent to the BTX process, was approximately 10 to 30 times higher than that at the other points in the fenceline. However, in the BTX process, four substances, ethylene, propylene, toluene, and xylene, were discharged at a concentration of less than 1% of the total REL value, which was satisfactory.
Figure 5. Concentration of ozone-generating substances and comparison with REL values at each measurement point in the fenceline.
Composition of highly reactive VOCs linked to ozone generation
Besides benzene, some VOCs have a greater effect on ozone generation than on the community. Previous studies have shown that substances with high POCP have a strong effect on ozone generation, causing secondary and tertiary pollution and increasing fine dust concentrations in the long term (Lee et al. Citation2007). Therefore, to prevent long-term air pollution, it is important to manage VOCs sources with high POCP and establish a reduction plan. To achieve this, a system for measuring and analyzing substances is required. Currently, in Korea, the total VOCs are measured, and the acceptable concentration, as per the regulations, corresponds to 1000 ppm in the chimney (Hwang, Roh, and Park Citation2018). However, because there are various types of VOCs, it is necessary to selectively measure those that are more likely to cause air pollution and take measures to reduce them.
All the VOCs with high POCP 10th rank were detected in this study. The overall emissions were composed of 26.9% toluene, followed by propylene (22.2%) and xylene (15.7%). Propylene and ethylene, which have relatively high POCP and are lightweight, are VOCs emitted in large quantities from petroleum refining and plastic manufacturing. However, propylene and ethylene are not managed separately in the Korean Clean Air Conservation Act. The measured emission ratios and the average values for the entire business site are presented in . More detail data are presented in appendix .
Table 7. Concentration of VOCs with high POCP at each measurement point in the petroleum refining facility.
Table 8. Concentration and emission ratio (%) of highly reactive VOCs with high ozone generating ability.
Discussion
In this study, we analyzed the types of VOCs at the site boundary, deviating from the total VOCs (TVOCs) regulated by the Korea Clean Air Conservation Act, which targets the petroleum refining industry. VOCs are becoming more diverse as the industry develops, and many are highly volatile or toxic and easily generate radicals ability by reacting with ozone, which can cause secondary pollution. Such substances are designated as having high POCP. Currently, VOCs are regulated in various ways worldwide, because they are secondary pollutants that act as catalysts by reacting with NOx (Kleinman et al. Citation2005). However, in Korea, only TVOCs in chimneys are monitored. In addition, there are no regulations relating to substances with high POCP. The petroleum refining industry is a representative business site that emits a large amount of highly toxic VOCs, such as benzene. Various by-products are generated in the various processes of refining crude oil and resynthesizing it into aromatic hydrocarbons. Accordingly, the US EPA regulates the emission concentration of benzene, a carcinogenic substance, as well as other high-POCP substances, through monitoring at fencelines of petroleum refining facilities. This leads to reduction measures by tracing the emission process and emission sources at high concentrations through continuous measurement and analysis of the plant. In addition, the goal is not only to reduce emissions but also to reduce operating costs by identifying leaks in plants.
Accordingly based on the action level for benzene set for the petroleum industry in Korea, and the processes and locations emitting large amounts of VOCs with high POCP were studied. In Korea, the action level of benzene is 9 µg/m3, and the average annual concentration at each measurement point must be below this value. Most of measurement points showed concentrations below the action level; however, the concentration at one point was nearly 7 times greater than the action level. This finding suggests that causal analysis and management are necessary. This point was adjacent to the BTX manufacturing process, which emits a large volume of aromatic hydrocarbons. In Korea, this does not have legal implications because it satisfies the 30 mg/m3 emission concentration requirement at the chimney. However, this study used the average value of the concentration measured five times over 1 h. The EPA analyzes the causes of high concentrations by comparing them with concentrations measured over one year and analyzing them by season and time. In the United States, some petroleum refining companies establish 24-h instantaneous monitoring systems and disclose the results to the local community (Sanchez et al. Citation2019). The lack of long-term measurements is a limitation of this study, and it is necessary to manage the workplace through continuous measurements and analysis.
In addition, our analysis of the REL values of high-POCP substances (ethylene, propylene, xylene, and toluene), in addition to benzene, returned satisfactory results. The highest concentration was ethylene, at 101 µg/m3, which has an REL of 250,000 µg/m3. As a percentage of the REL, the concentrations of ethylene, propylene, toluene, and xylene were 0.04%, 10%, 1%, and 0.3%, respectively. The REL suggested by the State of California is different from the concentration in the atmospheric environment, as it currently applies to the regulated concentration in the work environment. Regulations related to VOCs other than benzene are continuously being updated in the United States (Johnston et al. Citation2021).
The composition of VOCs in the workplace is as important as their emitted concentration. This is because reduction measures are established by analyzing the number of VOCs with a high POCP at each business site. For example, workplaces with a high composition ratio of toluene should establish measures to reduce aromatic hydrocarbons, while workplaces with a high composition ratio of low-molecular-weight substances, such as ethylene and propylene, should increase the production rate of these substances to reduce their emission as by-products (Maadhah et al. Citation2008). Toluene and xylene were the high-POCP substances emitted in large quantities from this plant. They accounted for 27% and 16% of the total emissions, respectively. Thus, in the case of this plant, it is possible to reduce the production of aromatic hydrocarbons.
Conclusion
Based on results of this study, an amendment to Korea’s Clean Air Conservation Act is necessary. In addition to the existing regulations for the chimney, periodic measurements of the concentration and emission composition at the site boundary are required, as this affects the local community. This can have economic benefits by reducing air pollution and the impact on the health of residents, as well as managing leak points in the workplace. In addition to benzene, it is necessary to prioritize the selection of VOCs through additional research. This conclusion is supported by measurements and analysis at plants in various industries.
Author contributions
M.-G.K, J.H.K, H.E.L, and K.W.M. conducted and designed the study; H.E.L performed data processing and coding. J.H.K and S.H.C analyzed the results. J.U.Y and M.-G.K wrote the manuscript. C.W.K. modeled the PRTR. H.E.L and J.H.K were involved in the analysis modeling program and chemicals; K.W.M. edited the manuscript. All authors contributed to and approved the final manuscript.
Supplemental Material
Download MS Word (66.9 KB)Supplementary material
Supplemental data for this article can be accessed online at https://doi.org/10.1080/10962247.2023.2182385.
Disclosure statement
No potential conflict of interest was reported by the authors.
Data availability statement
Data openly available in a public repository that does not issue DOIs.
Additional information
Funding
Notes on contributors
Min-Gyu Kim
Min-Gyu Kim is a researcher at Korea University's Department of Health and Safety Convergence Science and Environmental Risk Lab. His research activities include measurement and analysis of VOCs, atmospheric environment modeling, and chemical risk assessment.
Jeong Hun Kim
Jeong Hun Kim Ph.D., is affiliated with the National Institute of Environmental Research. His research is atmospheric environmental engineering and the effect of VOCs in the atmosphere.
Seok J. Yoon
Seok J. Yoon Ph.D., is a research scientist at Korea culture based safety. He is a professor in the Department of Health Science, Korea University. His research activities include analyzing VOCs in the air and evaluating the effects of chemical substances.
Sung Hwan Cho
Sung Hwan Cho is affiliated with the National Institute of Environmental Research. His research is atmospheric environmental engineering and the effect of VOCs in the atmosphere.
Jeong Ung Yu
Jeong Ung Yu is affiliated with the National Institute of Environmental Research. His research is atmospheric environmental engineering and the effect of VOCs in the atmosphere.
Cheon Woong Kang
Cheon Woong Kang is affiliated with the National Institute of Environmental Research. His research is atmospheric environmental engineering and the effect of VOCs in the atmosphere.
Kyong Whan Moon
Kyong Whan Moon He is a professor at the School of Health and Environmental Science at Korea University. His research spans both substantive and methodological studies in order to investigate and prevent risks in the natural environment and workplace. His major research areas include heavy metals, biocides, pesticides, asbestos, long-term exposure, and health impact assessments.
Hyo Eun Lee
Hyo Eun Lee Ph.D., is a research scientist at Safety partners KOREA. She studied at the Department of Health science at Korea University. Her research activities include using atmospheric modeling and VOCs measurement, analysiss to assess and quantify air quality and public health.
References
- Cheng, X., T. Zhao, X. Fu, and Z. Hu. 2004. Identification of nitrogen compounds in RFCC diesel oil by mass spectrometry. Fuel Process. Technol. 85 (13):1463–72. doi:10.1016/j.fuproc.2003.10.004.
- Derwent, R.G., M.E. Jenkin, S.M. Saunders, and M.J. Pilling. 1998. Photochemical ozone creation potentials for organic compounds in northwest Europe calculated with a master chemical mechanism. Atmos. Environ. 32 (14–15):2429–41. doi:10.1016/S1352-2310(98)00053-3.
- DeWees, J.M. 2015. Refinery fenceline monitoring & method 325A/B. In National air toxics monitoring and data analysis workshop, ed. Measurement Technology Group and National Air Toxics Monitoring and Data Analysis Workshop, vol. 28, 4–28. North Carolina: Research Triangle Park.
- Feitshans, I.L. 1989. Law and regulation of benzene. Environ. Health Perspect. 82:299–307. doi:10.1289/ehp.8982299.
- Grover, R., and M. L. Bradford. 2001. Texas NOx state implementation plan for Houston-Galveston area. Environ. Prog. 20 (4):197–205. doi:10.1002/ep.670200407.
- Hwang, S.H., J. Roh, and W.M. Park. 2018. Evaluation of PM10, CO2, airborne bacteria, TVOCs, and formaldehyde in facilities for susceptible populations in South Korea. Environ. Pollut. 242:700–08. doi:10.1016/j.envpol.2018.07.013.
- Jarullah, A.T., I.M. Mujtaba, and A.S. Wood. 2012. Whole crude oil hydrotreating from small-scale laboratory pilot plant to large-scale trickle-bed reactor: Analysis of operational issues through modeling. Energy Fuels 26 (1):629–41. doi:10.1021/ef201406r.
- Johnston, J.E., K. Okorn, Y.O. Van Horne, and A. Jimenez. 2021. Changes in neighborhood air quality after idling of an urban oil production site. Environ. Sci. Process. Impacts 23 (7):967–80. doi:10.1039/D1EM00048A.
- Kim, B., H.C. Kim, and S. Kim. 2018. A recently improved approach to develop effective emission inventory for air quality planning in US. J. Korean Soc. Atmos. Environ. 34 (2):342–55. doi:10.5572/KOSAE.2018.34.2.342.
- Kim, J.-C. 2006. Trends and control technologies of volatile organic compound. J. Korean Soc. Atmos. Environ. 22:743–57.
- Kim, J.-H., J.M. Gang, B.H. Lee, and J.S. Her. 2011. Research on the analysis of unregulated organic pollutant compounds in soil (focusing on 16 polycyclic aromatic hydrocarbons). J. Korean Appl. Sci. Technol. 28:64–74.
- Kleinman, L.I., et al. 2005. A comparative study of ozone production in five US metropolitan areas. J. Geophys. Res. 110.D2. doi:10.1029/2004JD005096.
- Korea Environmental Preservation Association. 2004. Environmental laws. Bull. Korea Environ. Preserv. Assoc. 26: 58–60.
- Lee, J.H., J.S. Han, H.K. Yun, and S.Y. Cho. 2007. Evaluation of incremental reactivity and ozone production contribution of VOCs using the PAMS data in Seoul metropolitan area. J. Korean Soc. Atmos. Environ. 23 (3):286–96. doi:10.5572/KOSAE.2007.23.3.286.
- Liau, L.C., T.C. Yang, and M. Tsai. 2004. Expert system of a crude oil distillation unit for process optimization using neural networks. Expert Syst. Appl. 26 (2):247–55. doi:10.1016/S0957-4174(03)00139-8.
- Lübkert, B., and W. Schöpp. 1989. The effects of selected NOx reduction scenarios on long-term nitrogen deposition and episodic ozone levels in Europe. Environ. Pollut. 58 (2–3):237–54. doi:10.1016/0269-7491(89)90067-5.
- Maadhah, A.G., et al. 2008. A new catalytic cracking process to maximize refinery propylene. Arabian J. Sci. Eng (Springer Sci. Bus. Media BV) 33.
- Marlowe, I.T., C.M. Bone. 1999. The categorisation of volatile organic compounds. Department of the environment : HMIP-commissioned research, DOE Report No: DoE/HMIP/RR/95/009.
- Olive, B., D. Gamiles, and M. Wicking-Baird. 2019. Open path UV as an alternative method to meet Benzene Fence-line monitoring provisions.
- Park, S., S. Lee, S.J. Jeong, H.-J. Song, and J.-W. Park. 2010. Assessment of CO2 emissions and its reduction potential in the Korean petroleum refining industry using energy-environment models. Energy 35 (6):2419–29. doi:10.1016/j.energy.2010.02.026.
- Parker, S. 2015. EPA weakens final refinery air toxics rule, reducing compliance costs. Inside Epa’s Clean Air Rep. 26 (21):20–22.
- Radwan, M., M.G. Gar Alalm, and H.K. El-Etriby. 2019. Application of electro-Fenton process for treatment of water contaminated with benzene, toluene, and p-xylene (BTX) using affordable electrodes. J. Water Process Eng. 31:100837. doi:10.1016/j.jwpe.2019.100837.
- Reitze, A.W., Jr. 2004. Air quality protection using state implementation plans-thirty-seven years of increasing complexity. Villanova Environ. Law J. 15:209.
- Sanchez, N.P., et al. 2019. Results of three years of ambient air monitoring near a petroleum refinery in Richmond, California, USA. Atmosphere 10 (7):385.
- Schultz, M., and S.T. Maher. 2015. Changes in the PSM/RMP regulatory framework (California and national) global congress on process safety.
- Widdowson, C., and D. Barden. 2015. How to comply with method 325 for refinery Fenceline monitoring. LC GC North Am. 33: S14–S14.
- Wolkoff, P. 2003. Trends in Europe to reduce the indoor air pollution of VOCs. Indoor Air 13 (Supplement 6):5–11. doi:10.1034/j.1600-0668.13.s.6.1.x.