
ABSTRACT
During thermal processes utilized in affixing fluoropolymer coatings dispersion to fibers and fabrics, coating components are vaporized. It is suspected that per- and polyfluoroalkyl substances (PFAS) from the dispersions may undergo chemical transformations at the temperatures used, leading to additional emitted PFAS thermal byproducts. It is important to characterize these emissions to support evaluation of the resulting environmental and health impacts. In this study, a bench-scale system was built to simulate this industrial process via thermal application of dispersions to fiberglass utilizing relevant temperatures and residence times in sequential drying, baking, and sintering steps. Experiments were performed with two commercially available dispersions and a simple model mixture containing a single PFAS (6:2 fluorotelomer alcohol [6:2 FTOH]). Vapor-phase emissions were sampled and characterized by several off-line and real-time mass spectrometry techniques for targeted and nontargeted PFAS. Results indicate that multiple PFAS thermal transformation products and multiple nonhalogenated organic species were emitted from the exit of the high temperature third (sintering) furnace when 6:2 FTOH was the only PFAS present in the aqueous mixture. This finding supports the hypothesis that temperatures typical of these industrial furnaces may also induce chemical transformations within the fluorinated air emissions. Experiments using the two commercial fluoropolymer dispersions indicate air emissions of part-per-million by volume (ppmv) concentrations of heptafluoropropyl-1,2,2,2-tetrafluoroethyl ether (Fluoroether E1), as well as other PFAS at operationally relevant temperatures. We suspect that E1 is a direct thermal decomposition product (via decarboxylation) of 2,3,3,3-tetrafluoro-2-(heptafluoropropoxy)propanoic acid (commonly referred to as HFPO-DA) present in the dispersions. Other thermal decomposition products, including the monomer, tetrafluoroethene, may originate from the PFAS used to stabilize the dispersion or from the polymer particles in suspension. This study represents the first researcher-built coating application simulator to report nontargeted PFAS emission characterization, real-time analyses, and the quantification of 30 volatile target PFAS.
Implications: Thermal processes used to affix fluoropolymers to fabrics are believed to be a source of PFAS air emissions. These coating operations are used by many large and small manufacturers and typically do not currently require any air emissions control. This research designed and constructed a bench-scale system that simulates these processes and used several off-line and advanced real-time mass spectroscopy techniques to characterize PFAS air emissions from two commercial fluoropolymer dispersions. Further, as the compositions of commercial dispersions are largely unknown, a model three-component solution containing a single PFAS was used to characterize emissions of multiple PFAS thermal transformation products at operationally relevant conditions. This research shows that fluoropolymer fabric coating facilities can be sources of complex mixtures of PFAS air emissions that include volatile and semivolatile PFAS present in the dispersions, as well as PFAS byproducts formed by the thermal transformation of fluorocarbon and hydrocarbon species present in these dispersions.
Introduction
Fluorinated coatings are applied to fibers, fabrics, paper, and many other surfaces to impart desired hydrophobic and lipophobic properties as well as increase durability and protection from mechanical, thermal, chemical, and ultraviolet degradation. Fluorinated coatings can be applied in liquid or powdered forms, with liquid dispersions commonly used to coat fibers and fabrics. Dispersion formulations include the fluoropolymer (e.g. polytetrafluoroethylene, PTFE) particles, additives, water, and surfactants (fluorinated and nonfluorinated) needed to suspend the particles and provide ideal surface tension and wettability properties (McKeen Citation2006). Per- and polyfluoroalkyl substances (PFAS) are generally added as dispersion surfactants but are also found in the dispersions as residual PFAS-based polymer processing aids (PPAs) (Hassel Citation2016). These modifiers and components can be adjusted to improve processing and produce desired physical properties in the final product. Most fabric coating facilities purchase dispersions from specialty dispersion manufacturers that have extensively researched and perfected their coating formulations for specific applications (McKeen Citation2006). These formulations are not typically disclosed and are protected as confidential business information. Dispersion formulations have changed with time and updated technology. Before its discontinued use in 2006, perfluorooctanoic acid (PFOA) was the most common PPA used for fluoropolymer production (Prevedouros et al. Citation2006). However, today newer shorter-chain and less studied PPAs such as the ammonium salt of perfluoro-2-propoxypropanoic acid, commonly known by its trademark name, GenX, have replaced PFOA (Dupont Citation2010).
Industrial fabric coating facilities apply fluoropolymer dispersions to materials and then thermally process the materials to dry and affix the polymer. A common dispersion application approach involves dipping the textile into a pan containing the aqueous fluoropolymer dispersion, metering the amount of dispersion with a roller, and then pulling the coated material vertically through a three-furnace tower to dry, bake, and to sinter the fluoropolymer onto the fabric. Targeted coated surface temperatures range from 100°C in the bottom drying furnace, to 165–190°C in the middle baking furnace, to 360–400°C in the upper sintering furnace (Hassel Citation2016; The Chemours Company Citation2017, Citation2020a, Citation2020b, Citation2022). During this thermal treatment, the water, surfactants, additives, and residual PPAs are vaporized by the first two furnaces, leaving only the fluoropolymer behind (McKeen Citation2006). The fluoropolymer can then be sintered onto the fabric by the third, higher temperature, furnace. Often, fabric is coated with successive fluoropolymer layers consisting of multiple dispersion formulations to achieve the desired characteristics such as polymer thickness, color, flexibility, conductivity, and tensile strength (Hassel Citation2016; McKeen Citation2006).
Furnaces used to heat treat the fabric often use infrared elements to provide radiant heat to the coated surfaces (McKeen Citation2006). Compared to convective heat transfer, radiant heating provides advantages of improved thermal efficiency as more energy is directed via radiation to the coated surface, and less is used to heat the gases within the furnaces. While peak temperatures are controlled to avoid significant thermal degradation of the product, PTFE has been shown to degrade at temperatures within the temperature range of the top furnace (360–400°C) (Conesa and Font Citation2001; Ellis et al. Citation2001; Lewis and Naylor Citation1947). When dispersion-coated fabric is heat treated, vaporization of water, surfactants, PPAs, and other volatile additives occurs by design, but this also suggests that portions of the fluoropolymer may also be degraded and vaporized depending on the processing conditions and composition of the dispersion (Ellis et al. Citation2001, Citation2003; Lewis and Naylor Citation1947; McKeen Citation2006; Schlummer et al. Citation2015).
Multiple studies have investigated the pyrolysis and destruction of PTFE at high temperatures (Ellis et al. Citation2001, Citation2003; Huber et al. Citation2009; Lewis and Naylor Citation1947) and several have examined the degradation of PTFE at temperatures commonly used to sinter PTFE to fabrics (Baker and Kasprzak Citation1993; Conesa and Font Citation2001; Ellis et al. Citation2001, Citation2003; Waritz and Kwon Citation1968). PTFE is stable up to 250°C, but above this temperature the polymer begins to slowly decompose by depolymerization (Huber et al. Citation2009). At 350°C, exposure to emissions causes polymer fume fever in humans, a temporary flu-like illness (Greenberg and Vearrier Citation2015; Waritz and Kwon Citation1968). At 375°C, emissions begin to show toxicity in animals, likely due to the perfluoroisobutylene (PFIB) and carbonyl difluoride emissions that have been reported (Treon et al. Citation1955). Between 400°C and 500°C, tetrafluoroethylene (TFE), fluoro-formaldehyde, hexafluoropropylene (HFP), and octafluorocyclobutane were also identified in the vapor phase (Ellis et al. Citation2003; Huber et al. Citation2009). However, these studies only examined the fluorinated polymer, not the complex chemical mixture contained in dispersions.
Fabric coating processes vary in scale and complexity and produce air emissions that are not well characterized. To our knowledge, only one published research study has collected air samples associated with industrial fabric coating facilities, though through an occupational exposure lens, where selected neutral and ionic PFAS species were quantified in air, wastewater, dust, and airborne particles at a textile manufacturing plant in China (Heydebreck et al. Citation2016). Neutral, semivolatile species targeted by gas chromatography-mass spectrometry (GC-MS) included fluorotelomer alcohols (FTOHs) and acrylates, as well as perfluoroalkane sulfonamides and sulfonamidoethanols, and the ionic species targeted by liquid chromatography-tandem mass spectrometry (LC-MS/MS) included fluorinated carboxylic and sulfonic acids. Another study performed by the US EPA and the New Hampshire Department of Environmental Quality employed qualitative nontargeted analysis by high-resolution LC-MS/MS to compare compositions of dispersion “dip pans” with air emissions from a fabric-coating tower. It was discovered that compounds identified in the dispersion dip pan differed from those found in the air emissions collected from fabric-coating towers and that the air emissions contained a large number of unique compounds. This suggests that dispersion components can undergo transformations during industrial fabric coating processes to create new compounds not present in the original dispersion mixture (Watkins Citation2019). In addition to vapor-phase emissions, post-furnace temperature profiles, vapor pressures, and high solubilities of the organic components in water may lead to particle nucleation, condensation, and the formation of submicron particles with mixed compositions. The result is a mixture of vapor and liquid-phase emissions (fluorinated and nonfluorinated) that contain components present in the original dispersion plus degradation products formed as the result of thermal processing. Once emitted, diffusion, deposition, high water solubilities, and low surface tension properties may promote PFAS mobility to local soils and groundwater (D’Ambro et al. Citation2021). As most facilities lack post-process control technologies (e.g., thermal oxidizers, sorbent beds, or acid gas scrubbers), it is important to understand what PFAS and/or degradation products are emitted to the environment.
In this study, a bench-scale three-furnace tower was used to simulate the industrial coating and thermal processing of a dispersion-coated braided fiberglass wick using a three-component model PFAS containing mixture, and two commercially available PFAS dispersions. Once dipped, the coated fiber was exposed to a controlled thermal environment, and gas-phase species were extracted from three process locations representative of exhausts from the drying, baking, and sintering furnaces. These gases were then directed to instruments for real-time analyses and collected by several sampling methodologies for off-line analyses. The objectives of this study are to 1) provide a description of the bench-scale three-furnace tower, its operation, and associated analytical capabilities; 2) examine the potential for the formation and emission of PFAS thermal degradation by-products using a model three-component mixture (water, Tergitol, and 6:2 fluorotelomer alcohol (6:2 FTOH)); 3) characterize air emissions during thermal application processes from two commercial dispersions containing different fluoropolymers (Chemours TeflonTM FEPD 121 Fluoroplastic Resin and Chemours TeflonTM PTFE DISP 30 Fluoroplastic Dispersion); and 4) provide emission factor estimates for gas-phase thermal transformation products from each of the aforementioned dispersions.
Experimental approach
Bench-scale three-furnace tower
The three-furnace tower was constructed using three electrically heated infrared tube furnaces (3.4 cm ID by 33.5 cm long) arranged vertically in series (0–1010°C, Sola Basic, Type 55035, Watertown, WI). A diagram of the experimental apparatus is presented in , and further details regarding system component specifications are provided in the Supplementary Information (SI) Text S1. Temperatures within each furnace can be adjusted independently to simulate drying (~100°C; bottom furnace 1), baking (~165–190°C; middle furnace 2), and sintering (~360–400°C; top furnace 3) zones (Hassel Citation2016). The entire three-furnace tower is enclosed within a plexiglass cabinet, maintained at a slight negative pressure (~1.3 cm H2O) to prevent fugitive emissions. All glassware used was 22/25 mm ID/OD with 35/25 ground glass ball/socket end adapters. Quartz tubes (45.7 cm) are mounted inside each furnace, joined between furnaces and above the top furnace by quartz crosses with ball end adapters. All open cross-ends are either covered by quartz socket endcaps or caps with #7 thread access ports fitted with TeflonTM septa and threaded caps. All quartz-to-quartz connections are ungreased and secured with size 35 stainless steel pinch clamps. These access ports provide locations for furnace exit gas temperature measurements (Type J thermocouple) and allow for collection of vapor-phase samples after each furnace. The quartz cross-sections inside of the enclosure are wrapped in alumina-silicate fiber insulation to minimize heat loss at exposed joints between ovens.
Figure 1. String Reactor diagram with sketch of sampling apparatus and insert of pulling mechanism (not to scale). Insulation shown on the middle port only for illustration but is present on all exposed quartz.
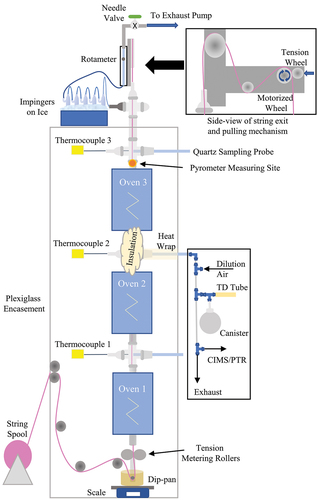
Braided fiberglass (1.9 mm diameter) is used as the fabric (1376 Round Fiberglass Wick, Pepperell Braiding Company, Pepperell, MA). From a 366 m roll, the fiber is pulled over guides and pulleys, dipped in PFAS dispersion, and pulled through adjustable tension metering rollers at the bottom of the first furnace before continuing up through the center of the quartz tubes. At the top of the quartz tube assembly, the string passes vertically through a 0.32-cm access port, over a pinch roller controlled by a variable speed motor and collected for visual inspection and disposal (, Inset). At the bottom of the system, below the first furnace, the dispersion dip pan sits on a balance. Weight and time are recorded manually during the experiments. Co-current with the string, induced room air is drawn in through the 22-mm ID open quartz tube at the bottom of the first furnace. As the coated string is heated, water and other vapor-phase emissions from the PFAS dispersion are liberated, and flow vertically up through the three heating zones. After the third furnace, the gases are directed horizontally, through a quartz to 0.318-cm stainless steel tube transition, through a series of four or five mini impingers immersed in an ice bath (to remove moisture), a rotameter, and to a rotary vane pump (0–30 L/min, GAST, Benton Harbor, MI). From the pump, the gases are vented to a laboratory point exhaust. The experimental system is designed to allow the independent control of the string speed and string residence time, drying, baking, and sintering zone coated fiber exit temperatures, and air volumetric flows and air residence time.
Normally, three-furnace towers would not include a physical separation between the infrared heating elements and the coated fabric. We included the quartz tubing to contain vaporized gases, control and quantify air flows and residence times, control in-leakage and prevent out-leakage of gases to occupied laboratory spaces, and help direct gas-phase species for analyses. The quartz tubing also collected the deposition of semi-volatile organic species and PFAS to interior quartz tube surfaces allowing for cleaning between experiments and minimizing cross-contamination between experimental conditions. It should be noted that the quartz tubing is optically transparent to radiation from the electrically heated infrared tube furnaces.
The infrared heating element and furnace gas exit temperatures were monitored for each of the three infrared furnaces. Infrared heater face temperatures are controlled by individual controllers to maintain a constant temperature. The furnace exit gas temperatures were monitored by thermocouples inserted into the center of the gas stream. The coated fiber surface temperature at the exit of furnace 3 was continuously monitored by an optical spot pyrometer (Fluke, Everett, WA). All temperature measurements were collected in real-time using a data acquisition system (IOtech, Personal Daq/56, Norton, MA) and processed to produce one-minute averages and standard deviations for analysis. For the drying and baking furnaces, heating element temperatures were pre-set based on exit string temperatures, determined by optical pyrometry. As seen in commercial fabric-yarn towers, the infrared heater face temperatures are always hotter than the measured fabric temperatures, and unless specified otherwise, temperatures presented here are those of the coated fabric determined by optical pyrometry.
Although the simulator allows for full control of process conditions (temperatures, flows, residence times, application rates, dispersion composition), results presented below hold process parameters constant and focus on the formation and emission of volatile organic species and PFAS from each heating stage in the tower. Based on industrial target parameters (Hassel Citation2016; McKeen Citation2006; The Chemours Company Citation2020a, Citation2020b; Watkins Citation2019; Weston Solutions Inc. Citation2016) and the bench-scale three-furnace tower dimensions, the string speed was set at 120 cm/min and the volumetric air flow at 9–10 L/min (at 93°C) to give string and gas residence times of ~90 sec and 2–3 sec, respectively. The first two processing ovens (drying and baking) were set at temperatures referenced by typical coating facilities, while the final oven was either held steady or ramped between temperatures of 315°C and 721°C to account for both under- and over-sintering of the final product (Hassel Citation2016; The Chemours Company Citation2020a, Citation2020b).
Experimental sequence
A summary of static and dynamic experiments and the simulator settings is presented in . Static experiments maintained constant simulator operating conditions. Fiber speed of 120 cm/min, air flows of 9–10 L/min, and furnace 1, 2, and 3 element control temperatures set to 204°C, 316°C, and 721°C, respectively. These furnace temperature settings were selected to achieve coated fiber exit temperatures of 100°C, 190°C, and 350–380°C, respectively. These target temperatures were selected from industrial practice and chosen to achieve sintering temperatures slightly above and below that for PTFE and FEP dispersions (Hassel Citation2016; The Chemours Company Citation2020a, Citation2020b; McKeen Citation2006). The sampling sequence progressed from bottom to top, beginning with the drying furnace, baking furnace, and finally the sintering furnace.
Table 1. Fabric coating simulator settings for static experiments (constant settings) and dynamic experiments (varying furnace 3 fiber exit temperature).a
Dynamic experiments were conducted in a similar manner, except that only real-time CIMS and PTR instruments were used. Furnaces 1 and 2 (drying and baking) were maintained at their respective temperatures (204°C and 316°C) and a slower fiber speed of ~70 cm/min was used to conserve dispersion for continuous sampling. Experiments started with furnace 3 (sintering) set to the same temperature as furnace 2 (316°C), and then incrementally increased to 722°C. Temperatures were held at each temperature until the real-time CIMS/PTR spectra stabilized (~5–10 min). Once the upper temperature (722°C) was reached, the temperatures were then reduced incrementally until the original temperature (316°C) was reached.
Prior to every experiment, all the quartz glassware was disassembled, cleaned, and reassembled. Disposable quartz sample tubes were replaced. Prior to sampling, the exhaust pump and fiber motor were turned on, and the three furnaces were energized and brought up to temperatures. Once temperatures were stabilized, water was deployed for dipping and blank samples were collected at target temperatures for each furnace. Following blank collection, PFAS solutions or dispersions were deployed, time and weight recorded, and coating operations initiated. After approximately 10 min to ensure steady state operations, gas sampling flows were established, and real-time analyses and sample collections conducted.
Analytical methods
Exit gas sampling
Gas samples were collected at the exits of each of the three furnaces through disposable quartz tubes that penetrated the threaded port endcaps and Teflon™ septa and were pushed to the furnace centerline. Outside the furnace, the quartz tubes were supported by 0.953 cm rigid tubing mounted to the cabinet structure. The entire external sampling probe assemblies were wrapped in heating tape (Thermolyne, Dubuque, IA) and fiberglass fabric insulation. During sampling, the heating tape was maintained at 121°C using a Type J thermocouple and temperature controller to prevent water condensation. Gas samples were pulled through the disposable quartz tubes and into a 0.635 cm perfluoroalkoxy (PFA) tube sampling apparatus with multiple ports from which diluted samples were collected or directed to real-time instrumentation (). One L/min of the sample was diluted with 8 L/min of Ultra Zero Air (UZA, Airgas, Radnor, PA) and pulled through the bottom portion of the sampling apparatus by a vacuum pump. Gas samples were pulled through the disposable quartz tubes and into a 0.635 cm perfluoroalkoxy (PFA) tube sampling apparatus with multiple ports from which diluted samples were collected or directed to real-time instrumentation ().
Sample collection ports branching from the sampling apparatus included canisters and thermal desorption (TD) tubes, as well as direct lines to in situ instrumental analysis by time-of-flight (TOF) mass spectrometers. Evacuated 6 L silonite-coated stainless steel canister samples (Entech Instruments, Simi Valley, CA) were collected in duplicate for 10 min and analyzed by quantitative, targeted gas chromatography-mass spectrometry (GC-MS) analyses. Universal TD tube (C3-CAXX-5266, Markes International, Sacramento, CA) samples were collected in triplicate at a flow rate of 100 mL/min for 3 min and analyzed by qualitative targeting of PFAS-characteristic ions and nontargeted GC-MS methods. Brief descriptions of the canister and TD tube analyses are outlined below, and further details are provided in SI Texts S2 and S3.
Targeted PFAS analysis of canister samples
A UNITY concentration unit (Markes International) equipped with a greenhouse gas (GHG) trap was used to concentrate gas samples from 6 L canisters to 15 and 200 mL volumes. Samples were desorbed onto an Agilent Technologies GC (Santa Clara, CA) coupled to a Markes International time-of-flight (TOF) MS for separation and detection to quantify selected PFAS (Table S1) amenable to gas-phase collection and TO-15 type analysis (US EPA Citation1999). A 15 mL volume was chosen for tetrafluoromethane analysis and quantification to stay below the breakthrough volume of 25 mL (nominal calibration value for tetrafluoromethane is 20 mL). The remaining target analytes used the 200 mL sample volume for quantification. Detailed instrument method parameters for targeted canister analysis of the 30-component PFAS mixture are provided in SI Table S2.
All reported PFAS were quantified using a 7-level 30-component PFAS calibration performed within a month of sample analysis (Table S3), and daily calibration checks and blanks were included. The calibration range for tetrafluoromethane ranged between 50 and 200 ppbv. The other PFAS targets were calibrated at a range between 0.5 and 20 ppbv, except hexafluoroethane, which was calibrated at a range between 2.5 and 50 ppbv. Further details regarding canister methods and analysis are provided in SI Text S2.
Qualitative and nontargeted TD-GC-MS analyses
Details regarding the TD-100×R unit (Markes International) parameters are provided in SI Text S3, and full TD-GC-MS details are outlined in Table S4. Briefly, TD tube samples were analyzed qualitatively by GC-quadrupole-MS (Agilent Technologies), utilizing a selected ion monitoring (SIM)/Scan method that combined both full-scan and SIM acquisition modes to tentatively identify PFAS species using NIST17 spectral library matching of full-scan data and PFAS fragment ion targeting through SIM. Electron ionization (EI) full-scan data were processed and analyzed using Agilent’s Unknowns Analysis software.
Follow-up analyses of recollected TD tube samples were then conducted to obtain accurate-mass (60,000 resolution) data using a UNITY-xR (Markes International) and a GC-Orbitrap MS (Thermo Scientific, Waltham, MA). Data were collected in both EI full-scan and positive chemical ionization (PCI) data-dependent acquisition, where full-scan and MS/MS product ion scan data were collected in the same run. High-resolution EI and PCI data were processed using nontargeted analysis (NTA) workflows in Thermo Scientific’s Compound Discoverer 3.3 software. Details regarding GC-MS instrumentation, analysis parameters, SIM, and analytical workflows of the TD tube samples are provided in SI Text S3.
Real-time mass spectrometric analyses: PTR and CIMS
Two types of fast (1 Hz), online measurements of gaseous organics were performed using TOF-MS (Tofwerk AG, Thun, Switzerland and Aerodyne Research Inc., Billerica, MA): 1) proton-transfer reaction TOF-MS (PTR-TOF-MS) utilizing a Vocus ionization source and 2) TOF-chemical ionization mass spectrometer (TOF-CIMS) utilizing iodide (I-) reagent ions was used for detection of oxygen-containing PFAS and other oxygenated and/or nitrogenated VOCs.
CIMS and PTR data acquisition were controlled using Aquility software (version 2.3.13; Tofwerk AG) running in Igor Pro 7 (WaveMetrics Inc, Portland, OR). CIMS and PTR mass spectra were acquired between 30 and 1000 m/z and 20 and 500 m/z, respectively. Instrumental background (or zero) measurements were performed by monitoring instrumental response while overflowing the instrument inlet with humidified UZA. CIMS and PTR mass spectral data were processed using Tofware (version 3.2.3; Tofwerk AG) running in Igor Pro 7 to perform mass calibration, calculate mass spectral baseline, and extract CIMS or PTR signal time series from individual mass spectral peaks. Details regarding sample dilution and introduction to MS, instrumental parameters, ions/masses of interest, and data acquisition/processing are provided in SI Text S4.
PFAS solutions and dispersions
Two aqueous Teflon™ dispersions were chosen specifically based on their commercial uses. Teflon™ PTFE DISP 30 is intended for coating fiberglass fabric via a dipping technique (The Chemours Company Citation2020b) and Teflon™ FEPD 121 is an aqueous fluorinated ethylene propylene (FEP) “general purpose” dispersion used for “coating or impregnating high-temperature fabrics” (The Chemours Company Citation2020a). The recommended sintering temperature for FEPD 121 is 285°C, unless it is used as a top coat over PTFE, where it is sintered at the PTFE desired temperature of 337°C (The Chemours Company Citation2020a). Little is known about the exact composition of these dispersions; they were chosen for these experiments due to their apparent simplicity, reporting only PTFE/FEP as a fluoropolymer and no apparent dyes or metals. Additionally, the high-temperature utilization of FEPD 121 despite this lower sintering temperature, and different fluoropolymer, piqued interest.
A simple polymer-free mixture was made to simulate properties of fluorinated dispersions to better understand potential transformations of PFAS during the heated coating processes. This was an aqueous solution (96 wt% deionized water) of a nonfluorinated surfactant/stabilizer (3 wt% Tergitol NP-9) and 0.3 wt% of 6:2 FTOH. Further three-component mixture and dispersion details can be found in SI Text S5, including disclosed ingredients and physicochemical properties.
Estimation of thermal transformation product emission factors
An emission factor is a representative value that attempts to relate the quantity of a pollutant released into the atmosphere with an activity associated with the release of that pollutant. Emission factors are typically represented as the weight of the pollutant divided by a unit of the activity emitting the pollutant (US EPA Citation2023). Emission factors are calculated for the 6:2 FTOH dispersion based on the mass, in µg, of the sum of measured thermal degradation products as well as individually for the monomer tetrafluoroethene per unit mass of 6:2 FTOH introduced (). For the PTFE and FEPD dispersions, emission factors for the release of Fluoroether E1 are calculated per mass of dispersion. Details of the calculation can be found in SI Text S7.
Table 2. Canister GC-MS data for static Water-Tergitol-6:2 FTOH experiments (ppbv).a,b
Results and discussion
Static experiments: Water, Tergitol, 6:2 FTOH mixtures
Canister GC-MS results
The fluorocarbon and chloro-fluorocarbon emissions were measured in the water, water-Tergitol, and water-Tergitol-6:2 FTOH static experiments (). These concentrations were corrected for the dilution air in the sampling apparatus and are representative of concentrations flowing through the furnaces. This analysis includes 30 volatile nonpolar PFAS (SI Tables S1 and S3) but does not include 6:2 FTOH. In the water and water-Tergitol experiments, five C1 and C2 species were quantified, typically at concentrations <1 ppbv. CCl3F and CHClF2 were identified in almost every sample, while C2F6, C2HF5, and C2H2F4 were identified in several samples at concentrations of ~0.32–0.94 ppbv. The water and water-Tergitol samples provided blank, halogen-free results for comparison. While minor, the presence of fluorocarbon and chloro-fluorocarbon species in these samples may be due to system or analytical contaminants, including unknown components or coatings used during the production of the fiberglass string. The fiberglass string is sold commercially for use as wick material for candles and, although not disclosed, may have been coated to reduce shedding of fibers during handling.
The emissions from the first two furnaces for the water-Tergitol-6:2 FTOH experiment are listed in . The same volatile species were observed with the first two furnaces and eight additional per- and poly-fluorocarbon species were identified and quantified at the exit of furnace 3. These C1 to C8 fluorocarbons were present in concentrations 3 to 400 times greater than any other quantified compound. Most interesting, is the presence of 21–52 ppbv concentrations of 1 H-perfluorooctane (C8HF17) and 166–353 ppbv concentrations of tetrafluoroethene (C2F4, TFE). These results suggest that the thermal conditions encountered in the sintering furnace set at 721°C (see ), a temperature known to degrade FTOHs, caused the thermal degradation of 6:2 FTOH, resulting in a mixture of volatile C1-C8 PFAS and a relatively large concentration of TFE. TFE is the monomer used to produce PTFE as well as a variety of FTOHs (Buck et al. Citation2011). The presence of high concentrations of TFE may suggest a mechanism by which FTOHs thermally decompose to reform TFE, as is known to happen with PTFE (Ellis et al. Citation2001).
The amount of 6:2 FTOH added to the three-component mixture is intentionally low and only represents the FTOH residuals estimated from Washington et al. (Citation2014), not the other fluoro-fractions that were also discovered. Based on the air flow rate and liquid feed rates in , the approximate upper limit of 6:2 FTOH in the gas-phase (if completely vaporized) was calculated as 31.5 ppmv. For perspective, the sum of quantified C1-C8 fluorocarbons sampled from furnace 3 is 0.22 – 0.47 ppmv (). Emission factors were calculated for the quantified C1-C8 fluorocarbons including TFE based on concentrations in (SI Text S7). Emission factors across replicate measurements range from 2500 to 5700 µg of quantified thermal degradation products per g 6:2 FTOH input (). Of those degradation products, TFE represents the largest fraction with emission factors of 1400 – 3100 µg TFE/g 6:2 FTOH. These emission factors are for selected C1-C8 fluorocarbons and do not include other possible degradation products that were not quantified, PFAS that remained incorporated within the string, or PFAS that deposited on system surfaces.
Table 3. Fluorinated compounds detected in thermal desporption (TD) tube samples (static experiments).a
TD tube GC-MS results
presents the results for the nontargeted, qualitative TD tube samples. Three to four TD tube samples were collected at each of the three furnace exits for the water, water-Tergitol, and water-Tergitol-6:2 FTOH experiments, and the samples were analyzed by TD-GC-Quadrupole-MS and TD-GC-Orbitrap-MS. No fluorocarbon compounds were detected in the water or water-Tergitol samples using either instrument. 6:2 FTOH (C8H5F13O) was identified in emissions at the exits of all three furnaces for water-Tergitol-6:2 FTOH experiments. The other three compounds detected in these samples, perfluoro-2-methylbutane (C5F12), 1 H,1 H,2 H-perfluoro-1-octene (C8H3F13), and C8H3F12O, represent tentative degradation products of 6:2 FTOH at the exits of furnaces 2 and 3. Structural assignments for C5F12 and C8H3F13 were tentatively determined by spectral match in EI mode, while C8H3F12O was assigned as a molecular formula via exact mass with high-resolution MS using the TD-GC-Orbitrap-MS. 1 H,1 H,2 H-perfluoro-1-octene (C8H3F13) was likely formed through dehydration (H2O loss) of the 6:2 FTOH at high temperatures within the furnace. Mass spectra, library matches, and area counts for the compounds listed in can be found in SI Text S2.
CIMS and PTR-MS results
Several nonfluorinated, small-chain organic acids and alcohols were detected as background compounds in all experiments, including the water and water-Tergitol experimental conditions. Details regarding CIMS and PTR background and other nonhalogenated features are included in the SI (Text S6).
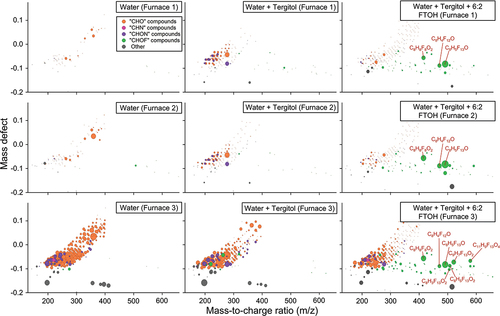
The right column in presents the CIMS data for the water-Tergitol-6:2 FTOH experiments in which a single PFAS was intentionally added, showing the presence of many vapor-phase CHOF species (several of which were identified) even at low drying temperatures. Here, enhancements in CIMS signals corresponding to “CHO,” “CHN,” and “CHON” compounds were observed, consistent with PTR-MS observations (iodide CIMS is not sensitive toward “CH” compounds). However, in the water-Tergitol-6:2 FTOH experiment, substantial CIMS signal enhancements corresponding to “CHOF” compounds in the 300–600 m/z range were also observed, and these features increased in number and concentration with increasing temperature. These “CHOF” compound enhancements are absent from the water and water-Tergitol experiments, given the lack of fluorinated precursor material in these variations of the three-component mixture. Note that 6:2 FTOH (C8F13H5O) was identified, and that the other vapor-phase CHOF (PFAS) compounds were both larger and smaller (as evident by m/z). These data provide evidence that typical temperatures encountered in fabric coating facilities can alter PFAS chemistry and air emissions.
Figure 2. Mass defect visualizations of CIMS data from each port during PFAS-free H2O (left column), H2O + Tergitol (center column), and H2O + Tergitol+6:2 FTOH (right column).
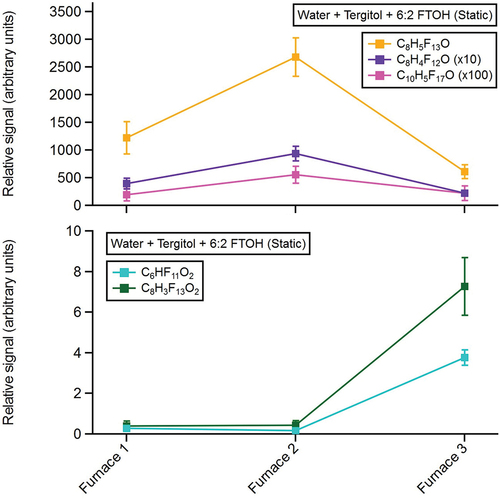
Several fluorinated organic compounds from the reactor were measured with the CIMS during the water-Tergitol-6:2 FTOH experiment (, top panel). Among these included C8H5F13O, C8H4F12O, and C10H5F17O, likely corresponding to 6:2 FTOH, 6:2 FTOH minus an HF group, and 8:2 FTOH, respectively. Riedel et al. (Citation2021) previously observed 6:2 FTOH, and the corresponding -HF product as an ionization chemistry byproduct in iodide CIMS spectra. 8:2 FTOH was likely present as a trace impurity in the stock 6:2 FTOH solution. CIMS signals for these three compounds were observed significantly above instrument background levels while sampling from all three furnace locations but peaked at the exit of the second furnace. Additionally, enhanced CIMS signals corresponding to C6HF11O2 and C8H3F13O2 were observed while sampling from the third furnace (, bottom panel). These formulas likely correspond to perfluorohexanoic acid (PFHxA) and 6:2 fluorotelomer carboxylic acid (FTCA), respectively. These compounds have previously been observed as photochemical oxidation products of 6:2 FTOH (Ellis et al. Citation2004). Given that these compounds solely arose at higher temperatures (furnace 3), these compounds likely resulted from the thermal decomposition of 6:2 FTOH.
Figure 3. CIMS measurements from the Water + Tergitol + 6:2 FTOH experiment.
Static experiments: PTFE DISP 30 & FEPD 121 Dispersions
Canister GC-MS results
presents the results for the targeted, quantitative canister samples collected during the static PTFE DISP 30 and FEPD 121 experiments. Before each dispersion was introduced to the reactor, samples were collected with string being dipped into water and passed through the reactor at target temperatures. This represented the “blank” sample to distinguish PFAS contributions from the room air, braided fiberglass, and residual reactor contaminants. Then, the water was replaced by the dispersion, steady-state operation was reestablished, and new canister samples were collected. As with the 6:2 FTOH experiments, these samples were analyzed using the same 30 component mix PFAS standards. While blank and dispersion results are presented, the dispersion concentrations have not been blank corrected. Differences in compound concentration between duplicate experiments shown in are likely due to the complexity in perfectly replicating/maintaining experiment parameters throughout the 10-min sample collection. This includes maintaining consistent string speed with no breakage string, slippage or sticking, as well as ensuring consistent dispersion depth to adequately coat the string.
Table 4. Canister GC-MS data for static dispersion experiments (ppbv).a,b,c
Canister measurements indicate the intermittent presence of seven chloro-fluoro and fluoro-organic compounds typically at concentrations of ~1 ppbv or less within the water blanks. As with the 6:2 FTOH experiments, these compounds are attributed to be minor concentrations of chloro-fluorocarbons present in the room air, water, or furnace contaminants. PTFE DISP 30 experiments were performed with the furnace set for nominal operation as in 6:2 FTOH experiments (). However, it was noted that the measured furnace 3 exit string temperature using this dispersion (~380°C) was 10°C to 35°C warmer than those measured for the 6:2 FTOH experiments. The recommended sintering temperature for PTFE DISP 30 is 337°C (The Chemours Company Citation2020b). This difference in string temperature may be due to a difference in water content between the 6:2 FTOH 3-component mixture and the commercial dispersion. indicates that the gases exiting furnaces 1, 2, and 3 contained several PFAS not found in the water blanks and indicates multiple PFAS species being formed as temperatures were increased. One PFAS, heptafluoropropyl-1,2,2,2-tetrafluoroethyl ether, which is also identified by the trade name Fluoroether E1 (E1), increased from 360, 1020, to 2060 ppbv from furnaces 1, 2, and 3, respectively. Further, E1 is a known decomposition product of 2,3,3,3-tetrafluoro-2-(heptafluoropropoxy)propanoic acid (HFPO-DA) and GenX (Liberatore et al. Citation2020). Note that the CIMS detected a chemical formula consistent with HFPO-DA, while the canister method was used to quantify E1. Due to chemical differences in these compounds, they could not both be measured on the same instrument. Octafluorocyclobutane was also quantified at the exits of furnaces 2 and 3. Octafluorocyclobutane is a known decomposition product of PTFE and could have resulted from either decomposition of other PFAS species in the dispersion or from the PTFE polymer (Lewis and Naylor Citation1947).
Following this initial experiment using PTFE DISP 30, the furnace 3 exit string temperature was reduced to ~250°C (). For these experiments, it was important that the dispersions were not inadvertently exposed to unrealistically high temperatures. The string speed was also reduced from 119 to 69 cm/min to conserve string and dispersion. The maximum string temperature reached in these experiments was ~250°C, well below the polymer sintering temperature stated in the product literature (The Chemours Company Citation2020b). This temperature was chosen as it produced a shiny, clear, appearance of the coated string as described in industry materials (Figure S2, 371°C) (McKeen Citation2006). indicates that the results for the PTFE DISP 30 (low temperature) experiments were largely consistent with those for the nominal temperature experiments. In general, the same PFAS (E1, octafluorocyclobutane, tetrafluoroethene, and hexafluoropropene) were measured. Concentrations of these PFAS are higher and may be related to the slower string speed and more residence time for vaporization and chemical transformation. E1 concentrations of ~5 ppmv were measured at the exit of furnace 2, but these fell to ~400 ppbv at the exit of furnace 3. This may indicate the formation of additional thermal degradation products from E1 within the sintering furnace even at these reduced temperatures.
The reduced temperature conditions were repeated for the FEPD 121 (low temperature). indicates several similar and several new PFAS. E1 emissions were reduced through furnace 2, perhaps reflecting a different mix of PFAS within this dispersion. Results showed that E1 and octafluorocyclobutane were present in all dispersion samples at all three furnace exits. These compounds are known products of GenX and fluoropolymer thermal treatment and could also be generated by other PFAS present (Liberatore et al. Citation2020).
Emission factors for E1 were calculated (SI Text S7) for each of the static dispersion experiments from concentrations in and dispersion use rates in . Emission factors across replicate measurements range from 4 µg/g dispersion for furnace 1 FEPD 121 low temperature to as high as 475 µg/g dispersion for furnace 2 PTFE DISP 30 low temperature (). The E1 emission factors reach their highest values, exiting furnace 2 for both the PTFE DISP 30 low temperature and FEPD 121 low temperature experiments. At temperatures higher than those seen in furnace 2, E1 may be transforming to additional thermal degradation products.
Table 5. Calculated emission factors (EF).a
These emission factors could be used to approximate the E1 emissions from commercial fabric coating processes based on the use rate of dispersions by those facilities. Some facilities maintain separate process gas exhausts from each furnace. In these instances, and in the absence of process gas control technology, these emissions from furnace 2 would result in direct air emissions. To the authors’ knowledge this is the first report of gas-phase PFAS emission factors from a thermal fabric coating process. However, it should be noted that these emission factors represent the physical bench-scale system used in this study and, although the bench-scale system was designed to be as representative as possible, it cannot completely duplicate conditions within an actual commercial facility, which also vary from facility to facility. Additional studies of bench-scale systems and process gas emission sampling from commercial facilities would reduce uncertainty for these emission factors.
TD tube GC-MS results
The bottom of presents the results for the nontargeted, qualitative TD tube PTFE DISP 30 and FEPD 121 samples. Three TD tube samples were collected at each of the furnace exits for PTFE DISP 30 (nominal temperature), PTFE DISP 30 (low temperature), and FEPD 121 (low temperature) experiments and the samples were analyzed as previously described. In all three dispersion experiments, only one fluorinated compound, E1 was detected at all three furnace exits in the samples analyzed by TD-GC-Orbitrap-MS in EI mode, and this identification was further confirmed using PCI spectra. This corroborates the detection of E1 in the canister samples for these dispersions. In PTFE DISP 30 (nominal temperature) sample, the breakdown product fluoroethene was also detected using the TD-GC-Quadrupole-MS. Fluoroethene was not able to be detected using the TD-GC-Orbitrap-MS due to the differences in the lower limits of the m/z scan ranges employed on the instruments (30 vs. 50 m/z), with the most abundant ion in the mass spectrum of this compound being 46 m/z.
Dynamic temperature ramp experiments
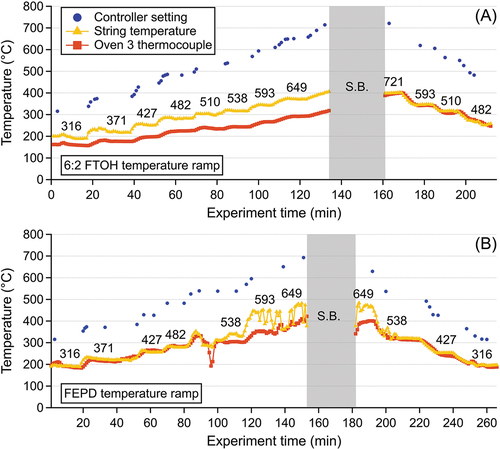
The temperature of furnace 3 was ramped, see , to characterize changes in PFAS emissions, observed by CIMS and PTR-MS, over a large range of furnace 3 temperatures for both FEPD 121 and the 6:2 FTOH 3 component mixture. PTFE DISP 30 was not analyzed, as nominal and low sintering temperatures were explored in the static experiments. These temperatures included low, nominal/optimum (for polymer sintering), and high temperatures, resulting in polymer degradation and charring. Temperatures indicated represent furnace 3 controller temperatures, with the third from the left (371°C) likely close to the optimum temperature. Photos of the coated fiberglass are presented in SI Figure S2.
Figure 4. Recorded temperatures from temperature ramp experiments for (A) Water + Tergitol + 6:2 FTOH and (B) FEPD 121. Black text on graphs represents temperature setpoints of the temperature controller in degrees Celsius. Note: String broke during 721°C setpoints as indicated by gray box and “S.B.”.
Water-Tergitol-6:2 FTOH mixture
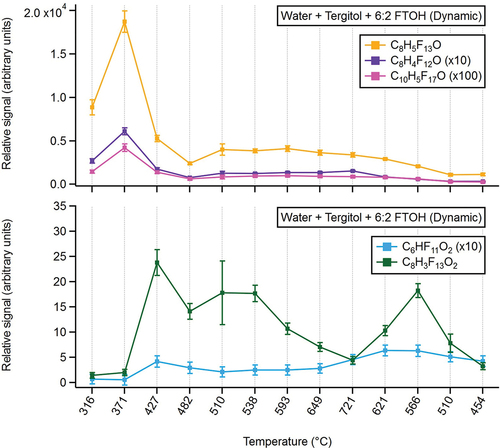
During the water-Tergitol-6:2 FTOH temperature ramp experiments, CIMS signals from C8H5F13O (6:2 FTOH), C8H4F12O, and C10H5F17O (8:2 FTOH) were maximized between 316°C and 371°C, then subsequently dropped off at higher reactor temperatures, consistent with observations from the static water-Tergitol-6:2 FTOH experiment. At temperatures ≥427°C, substantial production of C6HF11O2 and C8H3F13O2 was observed, consistent with the hypothesis that these compounds arise as thermal decomposition products of 6:2 FTOH (). Similar to the static experiments, several nonfluorinated, small-chain organic acids and alcohols were detected, and discussed in the SI (Text S6).
Figure 5. CIMS measurements from the Water + Tergitol + 6:2 FTOH temperature ramp.
FEPD 121
Several fluorinated organic species were observed by CIMS while performing the FEPD 121 temperature ramp experiments, including C6HF11O3, C8HF17O2, C3H2F4O2 (). The formula C6HF11O3 likely corresponds to HFPO-DA (the acid form of GenX), which was likely present in the dispersion as a polymer processing aid as previously discussed. The chemical identities of C8HF17O2 and C3H2F4O2, and mechanisms by which these compounds arise, remain unclear and warrant further investigation. CIMS signals from C6HF11O3 are maximized at furnace controller temperatures of 316°C and substantially decreased at higher temperatures. Signals from C8HF17O2 peak between 482°C and 538°C, while signal trends from C3H2F4O2 resemble those of C6HF11O3, with an additional peak at 649°C.
Figure 6. CIMS (top panel) and PTR-MS (bottom panel) measurements from FEPD 121 temperature ramp experiment.
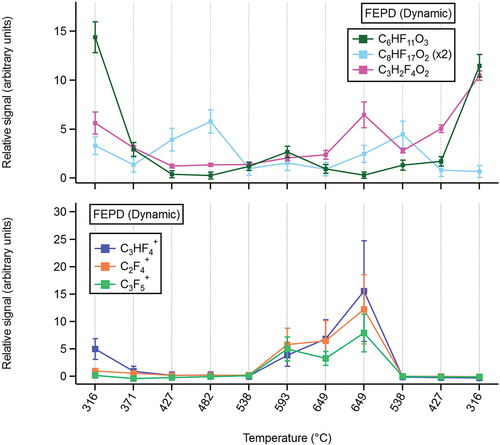
Increases in PTR-MS signals were also observed for fluorinated ions (or possibly ion fragments) with the formulas C2F4+, C3F4H+, and C3F5+ (). The mechanisms of ionization resulting in these species are unclear, though these species likely arose via either charge transfer or hydride/fluoride abstraction with O2+, a ubiquitous background ion in PTR-MS, as opposed to a proton-transfer reaction (Yuan et al. Citation2017). Signals of these ions peak at furnace controller temperatures of 593–649°C. These ions likely arose either via thermal degradation of the fluoropolymer itself or degradation of fluorinated PPAs present within the dispersion. These fluorinated PTR-MS ions were not observed during the water-Tergitol-6:2 FTOH experiment, nor the corresponding temperature ramp. Nonfluorinated compound identification from the FEP temperature ramp is discussed in SI Text S6.
Conclusion
Results from the simplified single PFAS mixture suggest that 6:2 FTOH can be transformed into multiple different PFAS under operationally relevant conditions and that these thermal degradation products are most prevalent at the exit of the highest temperature sintering furnace. Experimental results using two different commercial dispersions are similar despite containing different fluoropolymer species. Although the dispersion compositions are not known in detail, ppmv concentrations of E1 were measured in these experiments. E1 concentrations reached the maximum after the second (baking) furnace and then were reduced at the exit of the third (sintering) furnace. This also corresponded to an increase in other PFAS emissions. It is suspected that HFPO-DA or GenX is present in these dispersions, either as a surfactant to maintain the polymer in suspension or as a residual polymer processing aid. In either case, E1 is the first thermal decomposition product, formed by the decarboxylation (loss of CO2) of HFPO-DA and/or GenX. E1 can then be further transformed into additional PFAS thermal decomposition products as temperatures increase further.
Emission factors for E1 from the commercial dispersions were calculated using furnace 2 concentrations () and dispersion use rates (). The PTFE DISP 30 low temperature experiment represents the highest at 475 µg E1/g of dispersion. This would result in direct air emissions of PFAS degradation products without effective air pollution control technology. Additional studies exploring parameters that control the rate of emissions as well as source sampling of commercial-scale fabric coating facilities are needed to further develop emission factors.
Real-time CIMS measurements during dynamic experiments, in which the sintering furnace temperature was cycled from low to high and back to low, suggest that thermal degradation products are formed and decompose in different temperature windows. It should be noted that much of this behavior, often producing C2-C3 PFAS, starts to occur within 10°C of sintering temperatures, but produces higher concentrations outside of reasonable operating temperatures.
Results indicate that commercially relevant fabric-coating operating conditions are fully able to alter PFAS compositions and produce a variety of thermal decomposition products that would be released as air emissions unless a thermal oxidizer or another type of air pollution control device were installed. In the absence of such emission treatment technologies, it is possible that these PFAS thermal byproducts, as well as others not yet identified, could impact air quality and environmental and human health.
This study utilized a bench-scale experimental system that was designed to replicate process variables (temperatures and gas and fabric residence times) that simulate operation of industrial-scale processes used to apply fluoropolymer dispersions onto fabrics. While field studies utilizing commercial equipment at an industrial location are most representative, access to these systems and the ability to modify process parameters and sampling locations is typically very limited. Further, experiments utilizing bench-scale equipment allowed use of online CIMS and PTRMS analytical tools in a laboratory setting and minimized cross-contamination between experiments. Future efforts may include field studies, expanded analytical techniques and PFAS identification and quantification, additional commercial dispersions, explore different operating conditions, and expanded calculations of emission factors. The bench-scale three-furnace tower could also be used to generate realistic thermal decomposition emissions for the development and application of new low temperature catalytic thermal oxidizers specifically for these commercial units.
Rev-SI_PFAS_Air_Emissions_from_Fabric_Coating_20230213_final.docx
Download MS Word (2.7 MB)Acknowledgment
Portions of this work were supported by EPA contract 68HERC20F0377-001 with Jacobs Technology Inc. The authors are grateful to Josh Varga, Mike Tufts, Preston Burnette, Peter Kariher, and William Roberson for their assistance in the design, construction, maintenance, calibration, and operation of the string reactor. The authors acknowledge the unfortunate passing of our colleague Theran Riedel, without his innovations this work would not have been possible. The research described in this article has been reviewed by the U.S. EPA Center for Environmental Measurement and Modeling and approved for publication. The views expressed in this article are those of the authors and do not necessarily represent the views or policies of the U.S. Environmental Protection Agency nor does mention of trade names or commercial products that constitute endorsements or recommendations for use.
Disclosure statement
No potential conflict of interest was reported by the author(s).
Data availability statement
The data that support the findings of this study are openly available on ScienceHub at http://doi.org/10.23719/1527849 reference number D-g4fk.
Supplementary data
Supplemental data for this paper can be accessed online at https://doi.org/10.1080/10962247.2023.2192009.
Additional information
Notes on contributors
Lindsay C. Wickersham
Lindsay C. Wickersham was a Physical Scientist with U.S. EPA’s Office of Research and Development in the Air Methods and Characterization Division. Since the research of this work was performed, she has transitioned to a new position as a Physical Scientist with the Air and Radiation Division of U.S. EPA’s Region 9 Office. Lindsay has a research background in antimicrobial resistance in waterways, salivary assays, and PFAS incineration.
James M. Mattila
James M. Mattila is an ORISE postdoctoral scholar at the U.S. EPA Office of Research and Development. His work currently focuses on performing online mass spectrometry measurements of airborne PFAS.
Jonathan D. Krug
Jonathan D. Krug is an Environmental Engineer with U.S. EPA’s Office of Research and Development in the Air Methods and Characterization Division. His current research focuses on thermal treatment of PFAS and methods for determining effectiveness of treatment.
Stephen R. Jackson
Stephen R. Jackson is a Chemist with U.S. EPA’s Office of Research and Development in the Air Methods and Characterization Division. His research focuses on source characterization methods development and nontargeted analysis of polar and nonpolar organic samples.
M. Ariel Geer Wallace
M. Ariel Geer Wallace is a Chemist with U.S. EPA’s Office of Research and Development in the Air Methods and Characterization Division. Her research focuses on methods development for thermal desorption-gas chromatography/mass spectrometry applications to detect and quantify volatile organic compounds and emerging contaminants in air emissions.
Erin P. Shields
Erin P. Shields is a Physical Scientist with U.S. EPA’s Office of Research and Development in the Air Methods and Characterization Division. His research area involves developing methods to characterize source emissions and to evaluate pollution control devices.
Hannah Halliday
Hannah Halliday is a Physical Scientist with the U.S. EPA’s Office of Research and Development in the Air Methods and Characterization Divison. She specializes in non-targeted measurements of volatile organics.
Emily Y. Li
Emily Y. Li is a Research Chemist with U.S. EPA’s Office of Research and Development in the Air Methods and Characterization Division. Her current research focuses on developing methods for characterization and mitigation solutions for air pollutant sources to assess and control emerging air emissions.
Hannah K. Liberatore
Hannah K. Liberatore is a Physical Scientist with U.S. EPA’s Office of Research and Development in the Air Methods and Characterization Division. Her current research focuses on characterization of source emissions and environmental contaminants through nontargeted analysis.
Stanley (Mac) Farrior
Stanley (Mac) Farrior (CSS-Inc.) is a Fabrication Specialist that supports U.S. EPA’s Office of Research and Development. He specializes in design and fabrication of unique solutions enabling researchers to pursue relevant environmental questions.
William Preston
William Preston (CSS-Inc.) is an Analytical Chemist and Task Order leader for the Analytical Support Laboratory that supports U.S. EPA’s Office of Research and Development. Mr. Preston specializes in method development and method implementation that characterizes emerging source and ambient volatile and/or semi volatile organic emission profiles.
Jeffrey V. Ryan
Jeffrey V. Ryan is a Senior Research Chemist with EPA’s Office of Research and Development in the Air Methods and Characterization Division. His research focuses on method development to characterize source emissions of pollutants of emerging concern.
Chun-Wai Lee
Chun-Wai Lee, Ph.D., retired from EPA’s Office of Research and Development as a Senior Research Scientist in the Air Methods and Characterization Division. His research focuses on emissions and control of hazardous air pollutants from combustion and industrial sources.
William P. Linak
William P. Linak, Ph.D., is a Senior Research Engineer with EPA’s Office of Research and Development in the Air Methods and Characterization Division. His research focusses on the formation, emissions, and control of air pollutants from combustion processes.
References
- Baker, B.B., and D.J. Kasprzak. 1993. Thermal degradation of commercial fluoropolymers in air. Polym. Degrad. Stab. 42 (2):181–88. doi:10.1016/0141-3910(93)90111-U.
- Buck, R.C., J. Franklin, U. Berger, J.M. Conder, I.T. Cousins, P. de Voogt, A.A. Jensen, K. Kannan, S.A. Mabury, and S.P.J. van Leeuwen. 2011. Perfluoroalkyl and polyfluoroalkyl substances in the environment: Terminology, classification, and origins. Integr. Environ. Assess. Manag. 7 (4):513–41. doi:10.1002/ieam.258.
- The Chemours Company FC, LLC. 2017. FEP Fluoroplastic Dispersion FEPD 121, FEP Fluoroplastic Dispersion FEPD 121. SDS No: 1336887-00032. https://www.fuelcellstore.com/msds-sheets/chemours-teflon-fepd121-msds.pdf
- The Chemours Company, LLC. 2020a. Teflon™ FEPD 121 Fluoroplastic Resin FEP Aqueous Dispersion Product Information. https://www.teflon.com/en/-/media/files/teflon/teflon-fepd-121-product-info.pdf?rev=6c7648855b99404d8c45c9b552318eeb
- The Chemours Company, LLC. 2020b. Teflon™ PTFE DISP 30 Fluoroplastic Dispersion Product Description Information. https://www.teflon.com/en/-/media/files/teflon/teflon-ptfe-disp-30-product-info.pdf?rev=9edbd400fa65486292d5c2c4fed3af0a
- Conesa, J.A., and R. Font. 2001. Polytetrafluoroethylene decomposition in air and nitrogen. Polym. Eng. Sci. 41 (12):2137–47. doi:10.1002/pen.10908.
- D’Ambro, E.L., H.O.T. Pye, J.O. Bash, J. Bowyer, C. Allen, C. Efstathiou, R.C. Gilliam, L. Reynolds, K. Talgo, and B.N. Murphy. 2021. Characterizing the air emissions, transport, and deposition of per- and polyfluoroalkyl substances from a fluoropolymer manufacturing facility. Environ. Sci. Technol. 55 (2):862–70. doi:10.1021/acs.est.0c06580.
- DuPont. 2010. DuPont GenX processing aid for making fluoropolymer resins. https://bladenonline.com/wp-content/uploads/2017/06/Chemours_GenX_Brochure_Final_07July2010.pdf
- Ellis, D.A., S.A. Mabury, J.W. Martin, and D.C.G. Muir. 2001. Thermolysis of fluoropolymers as a potential source of halogenated organic acids in the environment. Nature 412 (6844):321–24. doi:10.1038/35085548.
- Ellis, D.A., J.W. Martin, A.O. De Silva, S.A. Mabury, M.D. Hurley, M.P. Sulbaek Andersen, and T.J. Wallington. 2004. Degradation of fluorotelomer alcohols: A likely atmospheric source of perfluorinated carboxylic acids. Environ. Sci. Technol. 38 (12):3316–21. doi:10.1021/es049860w.
- Ellis, D.A., J.W. Martin, D.C.G. Muir, and S.A. Mabury. 2003. The use of 19F NMR and mass spectrometry for the elucidation of novel fluorinated acids and atmospheric fluoroacid precursors evolved in the thermolysis of fluoropolymers. Analyst. (Lond) 128 (6):756–64. doi:10.1039/b212658c.
- Greenberg, M.I., and D. Vearrier. 2015. Metal fume fever and polymer fume fever. Clin. Toxicol. 53 (4):4, 195–203. doi:10.3109/15563650.2015.1013548.
- Hassel, D. 2016. David Hassel testimony during ‘Public Hearing on Water Quality and Contamination’ Committee on Health & Environmental Conservation, New York State Senate. Accessed September 7, 2016. https://www.nysenate.gov/calendar/public-hearings/september-07-2016/water-quality-and-contamination.
- Heydebreck, F., J. Tang, Z. Xie, and R. Ebinghaus. 2016. Emissions of per- and polyfluoroalkyl substances in a textile manufacturing plant in China and their relevance for workers’ exposure. Environ. Sci. Technol. 50 (19):10386–96. doi:10.1021/acs.est.6b03213.
- Huber, S., M.K. Moe, N. Schmidbauer, G.H. Hansen, and D. Herzke. 2009. Emissions from incineration of fluoropolymer materials. Kjeller, Norway: Norwegian Institute for Air Research.
- Lewis, E.E., and M.A. Naylor. 1947. Pyrolysis of Polytetrafluoroethylene. J. Am. Chem. Soc. 69 (8):1968–70. doi:10.1021/ja01200a039.
- Liberatore, H.K., S.R. Jackson, M.J. Strynar, and J.P. McCord. 2020. Solvent suitability for HFPO-DA (“GenX” Parent Acid) in toxicological studies. Environ. Sci. Technol. Lett. 7 (7):477–81. doi:10.1021/acs.estlett.0c00323.
- McKeen, L.W. 2006. Fluorinated coatings and finishes handbook. 1st ed. Norwich, NY: William Andrew Publishing.
- Prevedouros, K., I.T. Cousins, R.C. Buck, and S.H. Korzeniowski. 2006. Sources, fate and transport of perfluorocarboxylates. Environ. Sci. Technol. 40 (1):32–44. doi:10.1021/es0512475.
- Riedel, T.P., M.A. Geer Wallace, E.P. Shields, J.V. Ryan, C.W. Lee, and W.P. Linak. 2021. Low temperature thermal treatment of gas-phase fluorotelomer alcohols by calcium oxide. Chemosphere 272:129859. doi:10.1016/j.chemosphere.2021.129859.
- Schlummer, M., C. Solch, T. Meisel, M. Still, L. Gruber, and G. Wolz. 2015. Emission of perfluoroalkyl carboxylic acids (PFCA) from heated surfaces made of polytetrafluoroethylene (PTFE) applied in food contact materials and consumer products. Chemosphere 129:46–53. doi:10.1016/j.chemosphere.2014.11.036.
- The Chemours Company, L.L.C. 2022. PTFE Fluoroplastic Dispersion DISP 30, PTFE Fluoroplastic Dispersion DISP 30. In SDS No: 1339069-00047. https://fluorogistx.com/wp-content/uploads/2022/11/PTFE-Fluoroplastic-Dispersion-DISP-30-SDS.pdf.
- Treon, J.F., J.W. Cappel, F.P. Clevelan.d, E.E. Larson, R.W. Atchley, and R.T. Denham. 1955. The toxicity of the products formed by the thermal decomposition of certain organic substances. Am. Ind. Hyg. Assoc. Q 16 (3):187–95. doi:10.1080/00968205509344029.
- U.S. EPA. 1999. Air method, Toxic Organics-15 (TO-15): Compendium of methods for the determination of toxic organic compounds in ambient air, second edition: Determination of Volatile Organic Compounds (VOCs) in air collected in specially-prepared canisters and analyzed by Gas Chromatography/Mass Spectrometry (GC/MS).
- U.S. EPA. 2023. Recommended procedures for development of emissions factors and use of the WebFIRE database. Publication no. EPA-453/R-23-001.
- Waritz, R.S., and B.K. Kwon. 1968. The inhalation toxicity of products of polytetrafluoroethylene heated below 500 degrees centigrade. Am. Ind. Hyg. Assoc. J. 29 (1):19–26. doi:10.1080/00028896809342976.
- Washington, J.W., J.E. Naile, T.M. Jenkins, and D.G. Lynch. 2014. Characterizing fluorotelomer and polyfluoroalkyl substances in new and aged fluorotelomer-based polymers for degradation studies with GC/MS and LC/MS/MS. Environ. Sci. Technol. 48 (10):5762–69. doi:10.1021/es500373b.
- Watkins, T.H. 2019. Laboratory data Report #6: Non-Targeted PFAS measurements in MM5 sample trains. Edited by New Hampshire Department of Environmental Services. United States Environmental Protection Agency. https://www4.des.state.nh.us/nh-pfas-investigation/?p=1019.
- Weston Solutions, Inc. 2016. Perfluorinated sulfonic acids and perfluorinated carboxylic acids testing program report, saint-gobain performance plastics, Merrimack, New Hampshire. New Hampshire Department of Environmental Services.
- Yuan, B., A.R. Koss, C. Warneke, M. Coggon, K. Sekimoto, and J.A. de Gouw. 2017. Proton-transfer-reaction mass spectrometry: Applications in atmospheric sciences. Chem. Rev. 117 (21):13187–229. doi:10.1021/acs.chemrev.7b00325.